Simultaneous radio and X-ray observations of PSR B0611+22
Abstract
We report results from simultaneous radio and X-ray observations of PSR B0611+22 which is known to exhibit bursting in its single-pulse emission. The pulse phase of the bursts vary with radio frequency. The bursts are correlated in 327/150 MHz datasets while they are anti-correlated, with bursts at one frequency associated with normal emission at the other, in 820/150 MHz datasets. Also, the flux density of this pulsar is lower than expected at 327 MHz assuming a power law. We attribute this unusual behaviour to the pulsar itself rather than absorption by external astrophysical sources. Using this dataset over an extensive frequency range, we show that the bursting phenomenon in this pulsar exhibits temporal variance over a span of few hours. We also show that the bursting is quasi-periodic over the observed band. The anti-correlation in the phase offset of the burst mode at different frequencies suggests that the mechanisms responsible for phase offset and flux enhancement have different dependencies on the frequency. We did not detect the pulsar with XMM-Newton and place a 99 confidence upper limit on the X-ray efficiency of .
keywords:
— Neutron stars — pulsars:individual — PSR B0611+221 Introduction
The 0.33 s pulsar PSR B0611+22 (characteristic age 90 kyr) was discovered by Davies et al. (1972) and was initially thought to be associated with the supernova remnant (SNR) IC 443 which lies at close angular separation to the pulsar (Davies et al., 1972; Hill, 1972). This association was always doubtful as the pulsar lies well beyond the radio shell (Duin & van der Laan, 1975) of the remnant. Recent X-ray observations detected a compact X-ray source within the remnant shell and the corresponding pulsar wind nebula (Olbert et al., 2001) which rejected any association of the pulsar with the remnant. Moreover, IC 443 is known to lie within the molecular cloud G1893.3 (Bocchino & Bykov, 2000) which lies along the line of sight to the pulsar. Although, the distances to these sources are highly uncertain, it is reasonable to assume that the pulsar lies beyond these dense regions (Fesen, 1984; Welsh & Sallmen, 2003). This suggests that the radio emission propagates through the dense medium which might contribute to the pulsar’s dispersion measure (DM) of 96 . The environment of this pulsar makes it an interesting object for studies of radio emission and single-pulse properties.
The pulsar was studied by Nowakowski (1992), who found that PSR B0611+22 appears to exhibit different modes in which the enhanced emission mode peaked at a later pulse phase than the average profile and the weak mode peaked at an earlier phase. Recently, Seymour et al. (2014) performed a detailed study of the emission behaviour of PSR B0611+22. They found that, at 327 MHz, the pulsar shows steady emission in one mode which is enhanced by bursting emission that is slightly offset in pulse phase from this steady emission. Seymour et al. (2014) also observed the bursting to be quasi-periodic with a period around pulse periods. This type of behaviour has also been seen in other pulsars like PSR J1752+2358 (Gajjar et al., 2014) and PSR J1938+2213 (Lorimer et al., 2013). PSR B0611+22’s short mode changes with offset in the emission phase could be responsible for the high degree of timing noise the pulsar exhibits (Arzoumanian et al., 1994).
The phenomena of nulling and mode changing which relate to such emission behaviour have been studied in different pulsars for four decades. They were first observed and reported by Backer (Backer, 1970a, b, c, d). Mode changing pulsars are pulsars in which, from time to time, the mean profile abruptly changes between two or more quasi-stable states (Wang et al., 2007; Bartel, 1982) while nulling is the abrupt cessation of radio emission for one or more pulse periods. Nulling has been postulated to be an extreme case of mode changing (Wang et al., 2007; Timokhin, 2010). In a series of papers, Rankin (Rankin, 1983, 1986; Rankin & Ramachandran, 2003) tried to understand the emission geometry and behaviour of such pulsars. According to her model, the emission beam of a pulsar consists of a central core emission beam surrounded by multiple annular cones of emission. The pulse profile we observe depends on which core and/or cone beams are traversed by the line of sight of the observer. Rankin suggested that mode changing can be thought of as a reorganization of such core and conal emission resulting in a change in the observed pulse profile. Mode changing has been observed in most multi-component pulsars (pulsars with more than one component in their emission profile) (Rankin, 1986). Many pulsars like PSR B2319+60 (Wright & Fowler, 1981), PSR B0943+10 (Suleymanova et al., 1998) and PSR B1918+19 (Rankin et al., 2013) exhibit this phenomenon. Both nulling and mode changing have been studied in 200 pulsars so far (Biggs, 1992; Weltevrede et al., 2006; Wang et al., 2007; Gajjar et al., 2012). PSR B0611+22 has been classified as a core emission pulsar with a single component (Rankin, 1983). This makes the pulsar interesting as the phase offsets and flux enhancement are small in comparison to other pulsars in terms of magnitude and timescale and are harder to explain in the standard framework. Recently, a global picture of quasi-stable states of the magnetosphere has come to the fore (Lyne et al., 2010; Hermsen, 2013). Hermsen (2013) discovered an anti-correlation between X-ray and radio emission in the two modes of emission of PSR B0943+10. This result motivated us to ask whether such X-ray emission is also detectable in PSR B0611+22 and, if yes, how does it relate to the mode changes seen in radio? This led to a simultaneous radio and X-ray observation campaign of PSR B0611+22.
As mentioned above, PSR B0611+22 has a supernova remnant and a molecular cloud in its vicinity. Such dense environments around and likely, in front of the pulsar make it an ideal candidate to study the effects of these environments on the measured flux density. Previously, pulsars within such dense environments have been known to show a spectral turnover at frequencies around GHz (Kijak et al., 2007; Kijak et al., 2011). A recent study by Rajwade et al. (2016) shows that it is possible to derive the physical parameters of these dense regions by modeling the flux density spectrum of the pulsar. In this paper, we try to characterize the peculiar emission behaviour with a multi-wavelength, broadband dataset of the pulsar. The observational details are given in Section 2. The results are presented in Section 3. The discussions based on the results are in Section 4. The conclusions are given in Section 5.
2 Observations
All observations were carried out on MJD 56756. PSR B0611+22
was observed at three different radio frequencies including 327 MHz (Arecibo
Observatory), 820 MHz (Green Bank Telescope) and 150 MHz (International LOFAR station-Nançay, France). The observation configurations for the radio
telescopes are given in Table 1. The data were recorded and converted into multi-channel
filterbank format before being written out to disk. Then, the data were
incoherently dedispersed using PRESTO111http://www.cv.nrao.edu/~sransom/presto at the pulsar DM of 96 to remove the dispersion delay of
incoming radio waves due to the interstellar medium. For the LOFAR (FR606) data, coherent dedispersion was carried out using DSPSR222http://dspsr.sourceforge.net (van Straten et al., 2011).
| Telescope | UT | |||||||
|---|---|---|---|---|---|---|---|---|
| (MHz) | (ms) | (MHz) | (hrs) | (K/Jy) | (K) | hh:mm | ||
| Green Bank Telescope (GBT) | 820 | 0.15 | 200 | 1.25 | 2048 | 2 | 101 | 16:30 - 17:45 |
| Arecibo Observatory (AO) | 327 | 0.5 | 50 | 2 | 2048 | 11 | 117 | 20:30 - 22:30 |
| LOFAR (FR606) | 148 | 0.32 | 80 | 6 | 400 | 0.97 | 900 | 16:45 - 22:30 |
| XMM-Newton | 16:30 - 22:30 |
Simultaneously, the pulsar was observed by XMM-Newton. The XMM-Newton observations used the photon imaging camera (EPIC) (Strüder et al., 2001; Turner et al., 2001). The PN-CCD was operated in small-window mode with a medium filter to block stray optical light. All the events recorded by the PN camera are time-tagged with a temporal resolution of 5.7 ms. On the other hand, the MOS CCDs were operated in full-window mode with a medium filter in each camera, which provide us with a large field-of-view. The coverage of various telescopes during the whole observation is illustrated in Table. 1.
3 Results
3.1 Broadband bursting
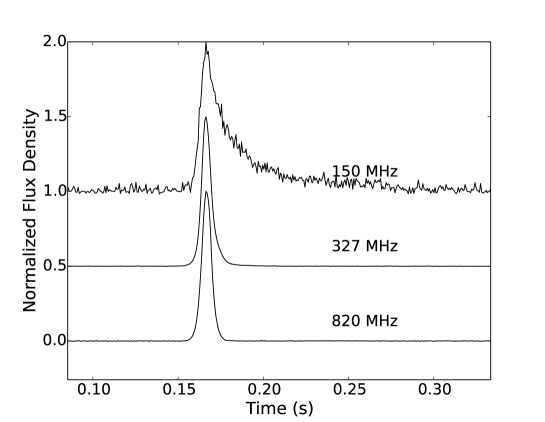
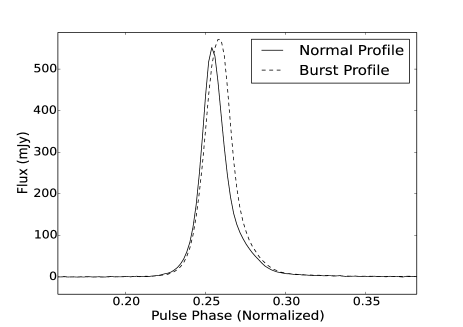
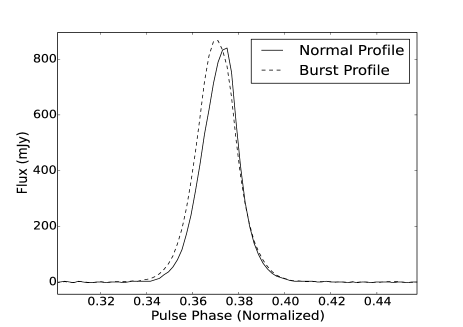
We analyzed the radio data for bursting behaviour at different frequencies similar to Seymour et al. (2014). For each frequency, namely 820, 327 and 150 MHz, the time series were folded at the topocentric period of the pulsar to generate the averaged pulse profiles shown in Fig. 1.
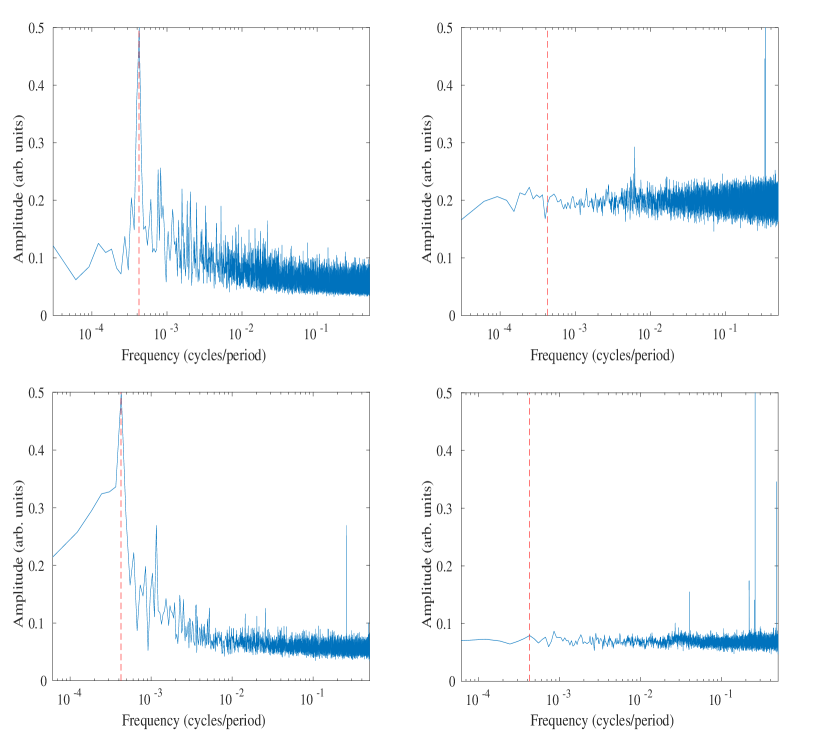
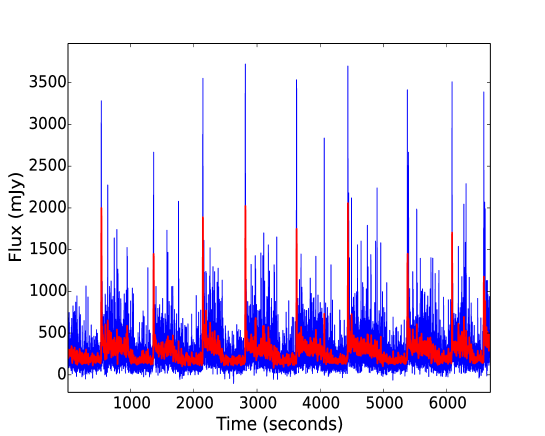
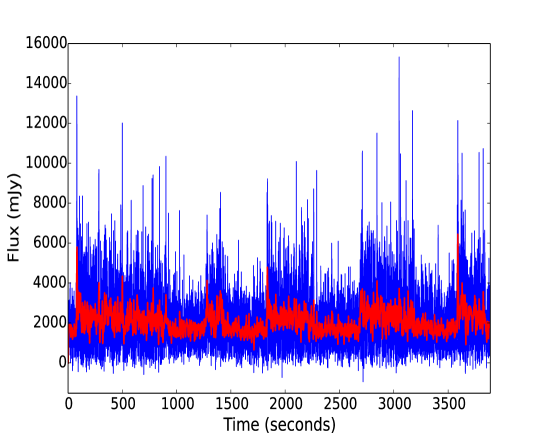
For these folded time series (see Fig. 5), we Fourier transformed the energies at each pulse longitude (phase bin) to obtain a longitude resolved fluctuation spectrum for 327 and 820 MHz. The fluctuation spectrum was integrated over specific On and Off pulse windows to obtain the integrated power spectrum for both regions as shown in Fig. 2. The figure suggests that bursts seem to be quasi-periodic at both frequencies. We derived a rough periodicity for the bursts of 2500 pulse periods from Fig. 2. The periodic nature of emission is evident in Fig. 3 which shows how energy of a single bin corresponding to the peak in the average profile varies in time. The profile was chosen from the ON pulse window at 327 and 820 MHz as done in Seymour et al. (2014).
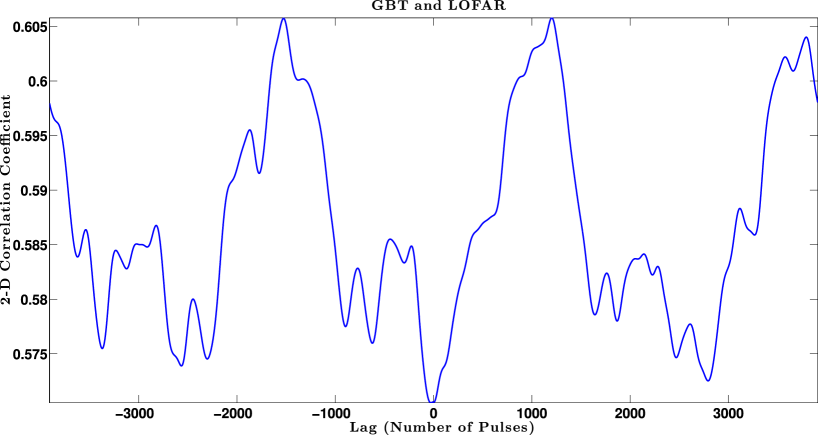
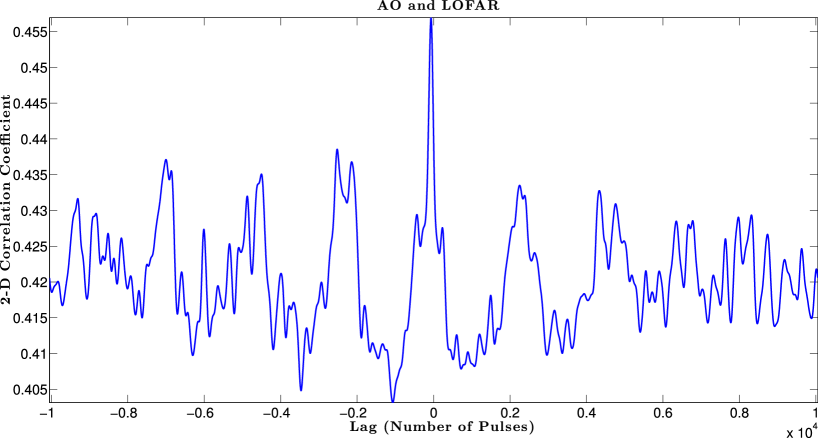
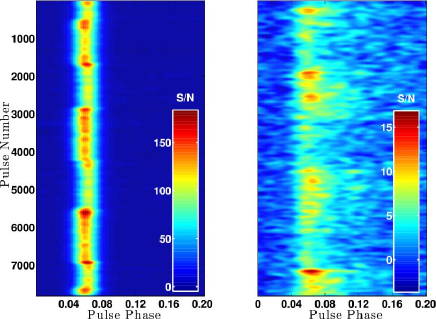
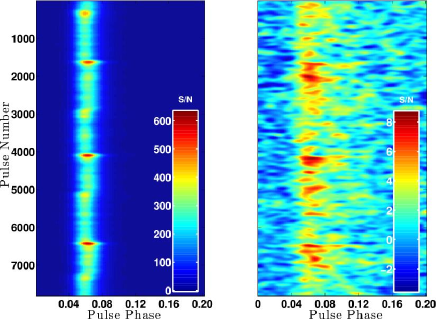
Due to telescope scheduling constraints, there was no overlap between the 327 and 820 MHz observations. However, each of those observations overlapped with the 150 MHz observations so we decided to compare the observations at 327 MHz and 820 MHz with the corresponding spans in the 150 MHz observations. Since we do not have high enough sensitivity from the LOFAR (FR606) observations to detect single pulses, we decided to convolve the pulse stack using a 2-D Gaussian kernel with a width spanning 64 time bins (i.e. single pulses) and 5 pulse phase bins. We applied the same smoothing to each dataset to give them comparable resolution. To ensure time alignment, we removed dispersion delay for each telescope using infinite frequency as the reference. The timeseries for each dataset were barycentered to remove any time delays due to different locations of the telescopes.
 |
 |
By doing this, we were able to obtain snippets of datasets where we could study the bursting behaviour simultaneously at different radio frequencies. Figure 5 clearly shows enhanced emission to study broadband correlations. The emission exhibits a change in its behaviour going from 820/150 MHz observations to 327/150 MHz observations. The direction of phase shift during bursting is different at 327 and 820 MHz when compared to their corresponding 150 MHz datasets. The correlation in 327/150 MHz and the anti-correlation in 820/150 MHz of the bursting is evident in Fig. 4 which shows the cross-correlations between the two frequencies. Fig. 4 reveals a slight offset in the maximum of the 327/150 MHz (60 bins) and the minimum of the 820/150 MHz (50 bins) plot from the zero lag. Since the offsets are comparable to the kernel width used to smooth the datasets along the time axis, they are insignificant and most likely not intrinsic to this phenomena.
We divided the time series into sections with no bursting and where bursting was clearly evident. The sections were selected visually from the smoothed data. From these sections, average profiles were created by summing the energies over the phase bins where the pulsed emission was seen. The profiles clearly bring out the difference in the behaviour of bursting at both frequencies. The profile for the bursting pulses is phase shifted in pulse longitude at the two frequencies as reported by Seymour et al. (2014) although there is a difference in the direction of the phase shift. At 327 MHz, the phase shift occurs towards the trailing edge of the profile while it occurs at the leading edge of the profile at 820 MHz. This is illustrated in Fig. 6.
 |
 |
 |
 |
3.2 Spectral turnover
As we had multi-frequency data, we investigated the spectral behaviour of this pulsar. Using the modified radiometer equation (Lorimer & Kramer 2012), the flux density
| (1) |
where is the area under the pulse, is the total number of phase bins in the profile, is the number of polarizations, is the total integration time of each phase bin of the pulse profile, is the correction factor for digitization, is the rms of the noise in the pulsar timeseries and the rest of the parameters are as given in Table 1.
Estimating the flux of the LOFAR observations was not a straightforward process. For FR606, which consists of antennas without moving parts, the temperature is strongly dependent on frequency, while the gain depends on frequency and on source position on the sky (elevation and azimuth). To calibrate the observed flux, we have used software described in detail by Kondratiev et al. (2016). The software produces flux density scaling factor using Eq 1 for each pulse and frequency channel. In order to properly estimate and , the software makes use of the Hamaker beam model (Hamaker, 2006) and mscorpol333https://github.com/2baOrNot2ba/mscorpol by Tobia Carozzi to calculate Jones matrices of the HBA antenna response for a given frequency and sky coordinates. The HBA antenna temperature, , is derived from CasA measurements done by Wijnholds & van Cappellen (2011). The background sky temperature, , is taken from a sky map at 408 MHz by Haslam et al. (1982), scaled to the HBA frequency as (Lawson et al., 1987). The error on the flux density calculation is 50 and can be attributed to e.g. error on system parameters, beam jitter due to the propagation in the ionosphere or strong sources contributing through the side lobes of the beam. Detailed discussion on error calculation is provided by Bilous et al. (2015).
To obtain reliable flux estimates, it was important to consider all the biases that are introduced in this analysis due to the interstellar medium. The first effect we considered is interstellar scattering. The profiles in Fig. 1 suggest that at no frequency is the scattering tail a significant fraction of the pulse period. Therefore, scattering does not significantly alter any flux estimates; hence we decided to not compensate for scattering in the analysis of this paper. Yet, a detailed treatment of the scattering will be discussed in another upcoming paper. Pulsar flux is also modulated by the free electron content along the line of sight. These modulations occur due to refractive interstellar scintillation (Gupta et al., 1994) which has timescale of the order of days and diffractive interstellar scintillation (Lewandowski et al., 2011) which can be of the order of minutes. Refractive scintillation will have little effect on our analysis as the timescales are much larger than the average observation length. However, since we were comparing our fluxes with those from Lorimer et al. (1995) and since those fluxes were measured twenty years ago, we decided to check whether refractive scintillations would affect our spectrum. We calculated the flux of the pulsar at 1400 MHz from an observation done few years ago for (Seymour et al., 2014) and found that flux to match with the Lorimer et al. (1995) flux indicating that refractive scintillation may not dramatically modulate the flux. To check if the diffractive scintillations were biasing our flux estimates, we used the NE2001 electron distribution model (Cordes & Lazio, 2002) to calculate the diffractive scintillation timescales at 150, 327 and 820 MHz. The values we obtained were 46, 65 and 100 s, respectively, which were small compared to the total integration time and the timescale of intrinsic variation of pulsar flux. Hence, we could use the pulse profiles as they were for further analysis.
| Frequency | Flux |
|---|---|
| (MHz) | (mJy) |
| 150 | 88 |
| 327 | 13.8 |
| 408 | 29 |
| 820 | 16.1 |
| 1408 | 2.2 |
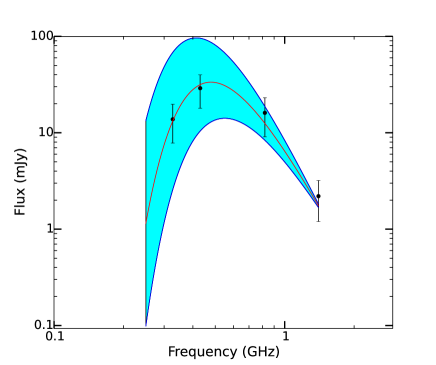
The flux densities at various frequencies are listed in Table 2. The values suggest that the pulsar spectrum does not follow the standard power law model. To make sure that the 327 MHz flux was not lower due to refractive scintillations, we calculated the flux of another observation at the same frequency which was used in Seymour et al. (2014). The calculated flux value was comparable to the new observations. In this analysis, we realized that the peak flux in our calculations did not match with peak fluxes in Seymour et al. (2014). After further cross-checks and verification, we conclude that the flux estimates in Seymour et al. (2014) are off by a factor of 16 as in their calculations, the time per bin ( in Eq 1) is incorrect. Hence, we use the flux estimates computed here for further analysis. The turnover we see is in the middle of the frequencies where we see a temporal anti-correlation in the bursts which suggests that the physical processes responsible for the anti-correlation in bursts might also be responsible for this turnover. The other possibility is that the observed turnover is due to absorption of radio emission by an external absorber. The dense environment around the pulsar can lead to a turnover in the spectrum at a higher frequency than expected. This motivated us to model the spectrum using a free-free thermal absorption model to estimate the optical depth and the peak frequency (Lewandowski et al., 2015; Rajwade et al., 2016). Past studies have detected H emission (Bychkov & Lebedev, 1979) in the region suggesting the presence of ionized gas. Fig. 7 shows the best fit model to the spectrum without the 150 MHz observation. Although the dense ISM along the line of sight makes this model very tempting, the model fails to explain the whole spectrum of the pulsar.
3.3 Broadband flux density modulation
To quantify the variation in the detected flux from the pulsar, we estimated the modulation index at different frequencies. Modulation index is a measure of pulse to pulse intensity fluctuation. To derive the intrinsic modulation indices () we used the method described in Kramer et al. (2003). First, we estimated the flux of each of the observations. Since we did not have calibrator observations, we used the radiometer equation (Lorimer et al., 2012) to obtain flux densities at different frequencies. Then, we normalized the time series by a 200 s running median to correct the pulsar signal for any possible effects of interstellar scintillation. Finally, the datasets were re-scaled to be consistent with the initial average flux density. For every observation, we integrated individual pulses to obtain the average pulse profile and calculated its flux density (see Table 2). After correcting the datasets for the effects of interstellar scintillation, for each one, we calculated the intrinsic modulation index
| (2) |
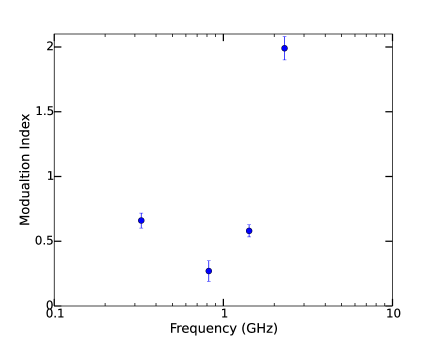
where, is the mean flux density and is the measured flux density of a single pulse. We compared our results with results for other pulsars (Bartel et al., 1980; Kramer et al., 2003). It is clearly seen that decreases with frequency until a certain “cut off” frequency and rises again (see Fig. 8). Our results are consistent with other pulsars where a similar trend is observed (Maron et al., 2013).
3.4 X-ray flux upper limits
We observed PSR B0611+22 for 33 ks using XMM Newton. We observed the pulsar using both PN CCD and MOS camera mounted on the telescope. We did not detect the pulsar but obtained an upper limit on the X-ray flux using the method described in Lorimer et al. (2012). We obtained an upper limit on the count rate of 10-4 counts s-1 at 99% confidence level. Then, assuming a non-thermal emission from the pulsar with a photon index (Pavlov et al., 2009) and using the publicly available software WEBPIMMS444https://heasarc.gsfc.nasa.gov/cgi-bin/Tools/w3pimms/w3pimms.pl, we obtained a limit on the unabsorbed X-ray flux, of ergs cm-2 s-1 assuming a neutral hydrogen column density of cm-2, estimated using 10% ionization fraction. The obtained upper limit is less than the flux reported for PSR B0943+10 (Hermsen, 2013) using the same non-thermal model for fitting. From this flux, we estimated an upper limit of X-ray luminosity, to be ergs s-1. From there, we were able to obtain an upper bound on the X-ray efficiency by assuming an = ergs . This upper limit has an errorbar of roughly 50 given the uncertainties in the distance to the source.
4 Discussion
4.1 Quasi-stable magnetosphere?
A detailed understanding of the physics of pulsar magnetospheres has presented a major challenge to astronomers over the past four decades. Recently, new observations have shed some light on emission physics. Lyne et al. (2010) reported a correlation between the spin-down rate and pulse profile changes in a sample of mode changing pulsars. They concluded that the magnetosphere switched between multiple quasi-stable states of emission. This hypothesis was bolstered by recent radio and X-ray observations of PSR B0943+10, which showed that the thermal X-ray emission was anti-correlated with the radio emission (Hermsen, 2013).
Based on Rankin’s model of radio emission from neutron stars (Rankin, 1983), PSR B0611+22 is a single core component pulsar. Later, Lyne & Manchester (1988) and Johnston et al. (2008) classified this pulsar as a partial cone based on the polarization position angle sweep across the profile. Partial cone pulsars are known to exhibit broadband phenomena like nulling and mode changing (Bhat et al., 2007; Gajjar et al., 2014). We observed that in PSR B0611+22, during the burst, the phase of the pulse shifts slightly, which agrees with the results in Seymour et al. (2014). In the 820 MHz observation, the bursting occurred when the pulse phase shifted towards the leading edge. On the other hand, the bursting occurred when the pulse phase shifted towards the trailing edge in the 327 MHz observations. This opposing behaviour at different frequencies leads to an anti-correlation when compared to the simultaneous 150 MHz data. Though PSR B0611+22 seems to be a mode changing pulsar, the frequency dependence of the mode change is not explained by current mode changing models and observations (Rankin, 1983). Kern (2000) claims that phase offset in the bursting profile occurs due to the periodic existence of a conal component along with the core component. Though the model is able to explain the slight increase in the width of the pulse profile in bursting mode, it fails to account for the different direction of phase offset at different frequencies. The observations presented here suggest that the spectral indices of the two components are different. Therefore, if the components preserve their phase, this manifests itself as an anti-correlation in the two simultaneous datasets We intend to do follow-up observations with a wider frequency coverage before making any claims on the model of emission of this pulsar.
At 327 and 820 MHz, we observed quasi-periodic bursting behaviour. Though the period can be derived from the peak in the power spectrum, the lack of harmonics suggests that we need to sample more bursts to better characterize the periodicity. This also puts forth a question of whether similar pulsars like PSR J1752+2359 (Gajjar et al., 2014) and PSR J1939+2213 exhibit such behaviour.
The non-detection of the pulsar in the X-ray waveband contradicts the predictions made in Seymour et al. (2014), based on assuming the 1 X-ray efficiency of PSR B0943+10. However, it is consistent with average efficiency of found in Vink et al. (2011) for old (age 17 kyr) pulsars and their nebulae. This shows that the pulsar is a weak X-ray emitter. The assumption of efficiency of 1 in Seymour et al. (2014) is based on PSR B0943+10 which has different spin down properties compared to PSR B0611+22. Hence, it is not surprising that the efficiency is dramatically different.
4.2 Flux Density Spectrum
From our flux density estimates, we were able to conclude that the spectrum of PSR B0611+22 does not exhibit single power law behaviour. This could be due to free-free thermal absorption along the line of sight. Recently, Kijak et al. (2011) and Dembska et al. (2014) have shown that these so called giga hertz peaked (GPS) spectra pulsars have peculiar environments in close vicinity of the pulsar or potential absorbers lying along the line of sight. This clearly suggests a turnover might occur at a frequency higher than 100 MHz. Recent modeling and simulations (Lewandowski et al., 2015; Rajwade et al., 2016) suggest that free-free absorption in high density plasma surrounding supernova remnants, pulsar wind nebulae or dense, cold, partially ionized gas is responsible for high frequency turnovers. Using this idea, we modeled the spectrum with a free-free thermal absorption model. The main caveat in this result is that the model cannot explain the whole spectrum of the pulsar because of the higher flux value of 150 MHz observation even though free-free thermal absorption seems like a promising explanation to the non-power law behaviour given the dense environment along the line of sight toward the pulsar.
Since the model cannot explain the whole spectrum, external absorption scenario seems unlikely. The other possibility we considered is that the irregular spectral behaviour could be caused due to the intrinsic variations in the pulsar itself. The different spectral indices of the two components within the partial cone could appear as a turnover in the flux density spectrum. Future observations at frequencies higher than 820 MHz will shed some light on this phenomenon. Also, it will be important to verify the flux densities at LOFAR frequencies for future studies.
We also calculated the modulation indices at various frequencies. It can be seen (Fig. 8) that there is a turnover at GHz. This result agrees with what is seen in other pulsars (Maron et al., 2000). The turnover in the modulation indices is mainly caused by decreasing average pulsar energy. Therefore the number of so-called pseudo nulls (no detection due to inadequate receiver sensitivity) increases with frequency.
5 Conclusions
We have carried out a detailed analysis of simultaneous radio and X-ray observations of pulsar PSR B0611+22. The multi-frequency data reveal a wealth of information about the emission characteristics of this pulsar. The bursting behaviour varied across the radio band with a quasi-periodic characteristic at all frequencies. The 327/150 MHz and 820/150 MHz simultaneous observations show an anti-correlation in bursting. We leave modeling this unusual behaviour to a later paper. Future polarimetric studies of both modes will help in discerning the emission physics of this pulsar. Moreover, we obtained a flux density spectrum from the radio observations of this pulsar. The spectrum shows a turnover at higher frequencies. We considered free-free thermal absorption by the surrounding ISM as a possible explanation but such model cannot explain the flux density at 150 MHz. From the X-ray non-detection, we obtained an upper bound on the X-ray luminosity and X-ray efficiency of the pulsar. The X-ray non-detection shows that the X-ray efficiency is low and consistent with X-ray efficiencies measured for other similarly aged pulsars.
Acknowledgements
We thank our referee for useful comments that greatly improved the manuscript. This work was supported by a NASA XMM-Newton grant (award no. 74279). We thank West Virginia University for its financial support of GBT operations, which enabled some of the observations for this project. We thank the staff of LOFAR station, Nançay, France for the observations. The financial assistance of the South African SKA project (SKA SA) towards this research is hereby acknowledged. Opinions expressed and conclusions arrived at are those of the authors and are not necessarily to be attributed to the SKA SA.
References
- Arzoumanian et al. (1994) Arzoumanian Z., Nice D. J., Taylor J. H., Thorsett S. E., 1994, ApJ, 422, 671
- Backer (1970a) Backer D. C., 1970a, Nature, 228, 752
- Backer (1970b) Backer D. C., 1970b, Nature, 227, 692
- Backer (1970c) Backer D. C., 1970c, Nature, 228, 1297
- Backer (1970d) Backer D. C., 1970d, Nature, 228, 42
- Bartel et al. (1980) Bartel N., Sieber W., Graham D. A., 1980, A&A, 87, 282
- Bartel (1982) Bartel N. & Hankins T. H., 1982, ApJL, 254, L35
- Bhat et al. (2007) Bhat N. D. R., Gupta Y., Kramer M., Karastergiou A., Lyne A. G., Johnston S., 2007, A&A, 462, 257
- Biggs (1992) Biggs J. D., 1992, ApJ, 394, 574
- Bilous et al. (2015) Bilous A., Kondratiev V., Kramer M., Keane E., Hessels J., Stappers B., Malofeev V., Sobey C., et al. 2015, ArXiv e-prints 1511.01767
- Bocchino & Bykov (2000) Bocchino F., Bykov A. M., 2000, A&A, 362, L29
- Bychkov & Lebedev (1979) Bychkov K. V., Lebedev V. S., 1979, A&A, 80, 167
- Cordes & Lazio (2002) Cordes J. M., Lazio T. J. W., 2002, ArXiv Astrophysics e-prints 0207156
- Davies et al. (1972) Davies J. G., Lyne A. G., Seiradakis J. H., 1972, Nature, 240, 229
- Dembska et al. (2014) Dembska M., Kijak J., Jessner A., Lewandowski W., Bhattacharyya B., Gupta Y., 2014, MNRAS, 445, 3105
- Duin & van der Laan (1975) Duin R. M., van der Laan H., 1975, A&A, 40, 111
- Fesen (1984) Fesen R. A., 1984, ApJ, 281, 658
- Gajjar et al. (2012) Gajjar V., Joshi B. C., Kramer M., 2012, MNRAS, 424, 1197
- Gajjar et al. (2014) Gajjar V., Joshi B. C., Wright G., 2014, MNRAS, 439, 221
- Gupta et al. (1994) Gupta Y., Rickett B. J., Lyne A. G., 1994, MNRAS, 269, 1035
- Hamaker (2006) Hamaker J. P., 2006, A& A, 456, 395
- Haslam et al. (1982) Haslam C. G. T., Salter C. J., Stoffel H., Wilson W. E., 1982, AAPS, 47, 1
- Hermsen (2013) Hermsen e. a., 2013, Science, 339, 436
- Hill (1972) Hill L. E., 1972, MNRAS, 157, 419
- Johnston et al. (2008) Johnston S., Karastergiou A., Mitra D., Gupta Y., 2008, MNRAS, 388, 261
- Kern (2000) Kern J. S., 2000, in Kramer M., Wex N., Wielebinski R., eds, IAU Colloq. 177: Pulsar Astronomy - 2000 and Beyond Vol. 202 of Astronomical Society of the Pacific Conference Series, Single Pulse Analysis of the Core-Dominated Pulsar B0611+22. p. 175
- Kijak et al. (2007) Kijak J., Gupta Y., Krzeszowski K., 2007, A&A, 462, 699
- Kijak et al. (2011) Kijak J., Lewandowski W., Maron O., Gupta Y., Jessner A., 2011, A&A, 531, A16
- Kondratiev et al. (2016) Kondratiev V. I., Verbiest J. P. W., Hessels J. W. T., Bilous A. V., Stappers B. W., Kramer M., Keane E. F., Noutsos A., Osłowski S., et al. 2016, A& A, 585, A128
- Kramer et al. (2003) Kramer M., Karastergiou A., Gupta Y., Johnston S., Bhat N. D. R., Lyne A. G., 2003, A&A, 407, 655
- Lawson et al. (1987) Lawson K. D., Mayer C. J., Osborne J. L., Parkinson M. L., 1987, MNRAS, 225, 307
- Lewandowski et al. (2011) Lewandowski W., Kijak J., Gupta Y., Krzeszowski K., 2011, A&A, 534, A66
- Lewandowski et al. (2015) Lewandowski W., Rożko K., Kijak J., Melikidze G. I., 2015, ApJ, 808, 18
- Lorimer et al. (2013) Lorimer D. R., Camilo F., McLaughlin M. A., 2013, MNRAS, 434, 347
- Lorimer et al. (2012) Lorimer D. R., Lyne A. G., McLaughlin M. A., Kramer M., Pavlov G. G., Chang C., 2012, ApJ, 758, 141
- Lorimer et al. (1995) Lorimer D. R., Yates J. A., Lyne A. G., Gould D. M., 1995, MNRAS, 273, 411
- Lyne et al. (2010) Lyne A., Hobbs G., Kramer M., Stairs I., Stappers B., 2010, Science, 329, 408
- Lyne & Manchester (1988) Lyne A. G., Manchester R. N., 1988, MNRAS, 234, 477
- Maron et al. (2000) Maron O., Kijak J., Kramer M., Wielebinski R., 2000, A&A, 147, 195
- Maron et al. (2013) Maron O., Serylak M., Kijak J., Krzeszowski K., Mitra D., Jessner A., 2013, A&A, 555, A28
- Nowakowski (1992) Nowakowski L. A., 1992, in Hankins T. H., Rankin J. M., Gil J. A., eds, IAU Colloq. 128: Magnetospheric Structure and Emission Mechanics of Radio Pulsars Four Pulsars with New Faces. p. 280
- Olbert et al. (2001) Olbert C. M., Clearfield C. R., Williams N. E., Keohane J. W., Frail D. A., 2001, ApJL, 554, L205
- Pavlov et al. (2009) Pavlov G. G., Kargaltsev O., Wong J. A., Garmire G. P., 2009, ApJ, 691, 458
- Rajwade et al. (2016) Rajwade K., Lorimer D. R., Anderson L. D., 2016, MNRAS, 455, 493
- Rankin (1983) Rankin J. M., 1983, ApJ, 274, 333
- Rankin (1986) Rankin J. M., 1986, ApJ, 301, 901
- Rankin & Ramachandran (2003) Rankin J. M., Ramachandran R., 2003, ApJ, 590, 411
- Rankin et al. (2013) Rankin J. M., Wright G. A. E., Brown A. M., 2013, MNRAS, 433, 445
- Seymour et al. (2014) Seymour A. D., Lorimer D. R., Ridley J. P., 2014, MNRAS, 439, 3951
- Strüder et al. (2001) Strüder L., Briel U., Dennerl K., Hartmann R., Kendziorra E., Meidinger N., Pfeffermann E., Reppin C. e. a., 2001, A& A, 365, L18
- Suleymanova et al. (1998) Suleymanova S. A., Izvekova V. A., Rankin J. M., Rathnasree N., 1998, Journal of Astrophysics and Astronomy, 19, 1
- Timokhin (2010) Timokhin A. N., 2010, MNRAS, 408, L41
- Turner et al. (2001) Turner M. J. L., Abbey A., Arnaud M., Balasini M., Barbera M., Belsole E., Bennie P. J., Bernard J. P. e. a., 2001, A& A, 365, L27
- van Straten et al. (2011) van Straten W., Demorest P., Khoo J., Keith M., Hotan A., et al., 2011, PSRCHIVE: Development Library for the Analysis of Pulsar Astronomical Data, Astrophysics Source Code Library
- Vink et al. (2011) Vink J., Bamba A., Yamazaki R., 2011, ApJ, 727, 131
- Wang et al. (2007) Wang N., Manchester R. N., Johnston S., 2007, MNRAS, 377, 1383
- Welsh & Sallmen (2003) Welsh B. Y., Sallmen S., 2003, A& A, 408, 545
- Weltevrede et al. (2006) Weltevrede P., Edwards R. T., Stappers B. W., 2006, A&A, 445, 243
- Wijnholds & van Cappellen (2011) Wijnholds S. J., van Cappellen W. A., 2011, IEEE Transactions on Antennas and Propagation, 59, 1981
- Wright & Fowler (1981) Wright G. A. E., Fowler L. A., 1981, A&A, 101, 356