Why is a flare-rich active region CME-poor?
Abstract
Solar active regions (ARs) are the major sources of two kinds of the most violent solar eruptions, namely flares and coronal mass ejections (CMEs). The largest AR in the past 24 years, NOAA AR 12192, crossed the visible disk from 2014 October 17 to 30, unusually produced more than one hundred flares, including 32 M-class and 6 X-class ones, but only one small CME. Flares and CMEs are believed to be two phenomena in the same eruptive process. Why is such a flare-rich AR so CME-poor? We compared this AR with other four ARs; two were productive in both and two were inert. The investigation of the photospheric parameters based on the SDO/HMI vector magnetogram reveals that the flare-rich AR 12192, as the other two productive ARs, has larger magnetic flux, current and free magnetic energy than the two inert ARs, but contrast to the two productive ARs, it has no strong, concentrated current helicity along both sides of the flaring neutral line, indicating the absence of a mature magnetic structure consisting of highly sheared or twisted field lines. Furthermore, the decay index above the AR 12192 is relatively low, showing strong constraint. These results suggest that productive ARs are always large and have enough current and free energy to power flares, but whether or not a flare is accompanied by a CME is seemingly related to (1) if there is mature sheared or twisted core field serving as the seed of the CME, (2) if the constraint of the overlying arcades is weak enough.
1 Introduction
Both solar flares and coronal mass ejections (CMEs) indicate the rapid release of a huge amount of magnetic energy in the solar corona, and in particular, CMEs are the most important driving source of hazardous space weather near the geospace. As the major producer of flares and CMEs, active regions (ARs) have been studied for decades. It was revealed based on lots of observational studies that parameters characterizing the AR’s non-potentiality, e.g., shear length, magnetic gradient, total electric current, free energy, are all correlated with the flare and CME productivity (e.g., Canfield et al., 1999; Sammis et al., 2000; Falconer et al., 2002, 2006; Leka and Barnes.G, 2003; Leka and Barnes, 2003; Jing et al., 2006; Ternullo et al., 2006; Schrijver, 2007; Georgoulis and Rust, 2007; Guo et al., 2007; Wang and Zhang, 2008), and particularly larger ARs are more likely to produce eruptions (e.g., Tian et al., 2002; Chen et al., 2011). However, not all large ARs have similar productivities in flares and CMEs, some may be productive in flares only (e.g., Tian et al., 2002; Akiyama et al., 2007; Chen and Wang, 2012). How to distinguish the productivity of an AR is a key issue in space weather forecasting, and still unsolved so far.
The recent super AR, 12192, crossing the visible solar disk during 2014 October 17 – 30, caught a wide attention (RHESSI science nugget no.239, ; Sun et al., 2015; Thalmann et al., 2015). It is the largest AR since 1990 November, but produced only one small CME though a total of 127 C-class and intenser flares, including 32 M-class and 6 X-class ones, were generated. Flares and CMEs are thought to be the consequences of the same eruptive process (e.g., Harrison, 1995; Lin and Forbes, 2000). Although the released energy of them during a strong eruption are on the same order of about erg (Emslie et al., 2012), they are clearly different. Flares are relatively local phenomena and the released energy is mostly converted into radiation and energetic particles; while CMEs are more global phenomena and the energy mostly goes into mechanical energies through ejection of magnetized plasma structures. An intense flare may not necessarily be accompanied by a CME (e.g., Feynman and Hundhausen, 1994; Green et al., 2002b; Yashiro et al., 2005; Wang and Zhang, 2007), because whether or not there is a CME is substantially determined by the driving force of the inner core magnetic field and the confining force of the external overlying field (e.g., Wang and Zhang, 2007; Liu, 2008; Schrijver, 2009).
The inner driver is always in a form of highly sheared or twisted magnetic structure, e.g., a flux rope as required in most CME models (T. Amari, J. F. Luciani, Z. Mikic, 1999; Torok and Kliem, 2005). Sheared or twisted field carries magnetic helicity, thus provides a way to transport the helicity naturally (Low, 1994; T. Amari, J. F. Luciani, Z. Mikic, 1999). Since magnetic helicity is an invariant in the high conductive corona, it makes a point that a CME may be an inevitable product with the accumulation of helicity in corona (Low, 1994; Green et al., 2002a; Nindos et al., 2003; Zhang, 2006; Zhang et al., 2006; Zhang and Flyer, 2008; Valori et al., 2012; Liu and Schuck, 2012).
However, such an AR of continuously generating M and X-class flares without a strong CME was rarely noticed before, and particularly, 3 out of 6 non-CME X-class flares were of long-duration (lasting more than one hour), which is quite conflicting to many earlier studies that long-duration flares tend to be easier to erupt out (e.g., Harrison, 1995; Yashiro et al., 2006). In order to understand the underlying physical nature, we compare this super AR with other two pairs of ARs, 11157 and 11158, 11428 and 11429 firstly, then investigate the temporal evolution of photospheric parameters, pre-flare distribution of current helicity, and decay index of the five ARs in the next two sections. In the last section, we give the summary and the discussion.
2 Activities of the ARs
AR pairs 11157 and 11158 are chosen for comparison because their productivities are quite different and they transited the visible solar disk almost during the same time, the same reason for AR 11428 and 11429.
AR 11157 was a very poor AR, no flare or CME was generated during its visible disk passage. In contrast, AR 11158 produced 68 flares above C1.0 and 12 CMEs, 10 of them were associated with flares above C1.0. AR 11429, similar to AR 11158, was an prolific AR, too. It produced 64 flares above C1.0 and 16 CMEs, 10 were flare-accompanied. AR 11428 was chosen as a comparison for 11429, it produced only 5 C-class flares without any CME. It is noteworthy that AR 11429 and its neighbour AR 11430 were clustered, they had closely magnetic connection with each other, and some weaker flares simultaneously occurred in AR 11430 when AR 11429 generated flares, the SHARP (Space weather HMI Active Region Patches, cutout maps of vector magnetograms that contain single AR (or cluster of ARs ) (Bobra et al., 2014; Hoeksema et al., 2014) ) data also contains the two ARs. So we simply treat them as an AR complex here. Information of the ARs are showed in Table 1. The associations of flares, CMEs and ARs are checked manually by using GOES 1.0–8.0 Å soft X-ray flux data and the imaging data from SOHO/LASCO (Brueckner et al, 1995), STEREO/COR (Kaiser et al., 2008) and SDO/AIA (Lemen et al., 2012).
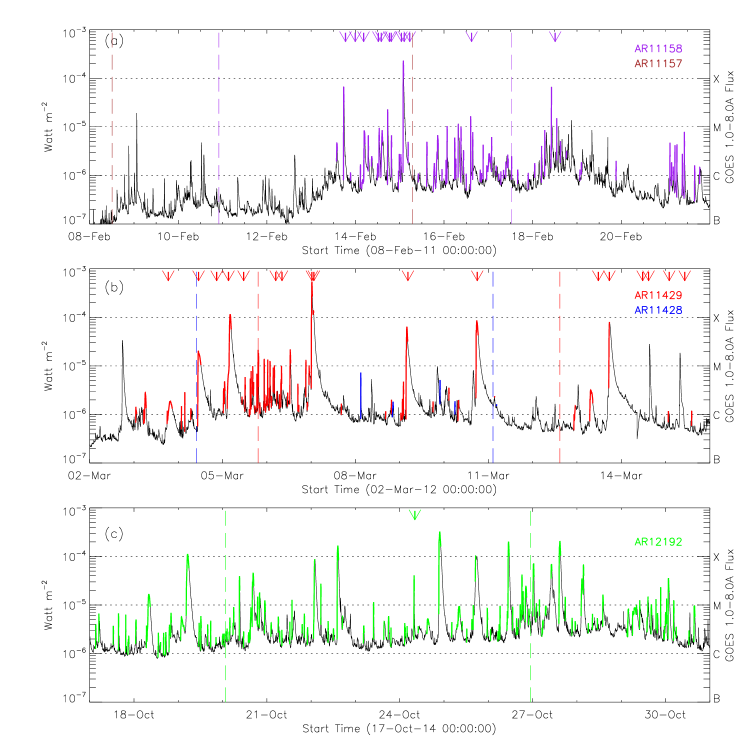
For clarity, Fig. 1 shows the GOES soft X-ray (SXR) flux during these ARs’ transits. AR 11157 and 11158 share the same light curve of the GOES SXR, same for AR 11428 and 11429. To distinguish the eruptions from the ARs, we use different colors for different ARs. In the figure, all the associated flares are indicated by colored lines and the associated CMEs are marked by arrows. All the flares above M1.0 and the CMEs have been listed in Table LABEL:tb_acts. The parameters of the flares are got from the SolarMonitor111http://www.solarmonitor.org/, which is generated based on NOAA active region summaries, and the parameters of the CMEs are from the SOHO/LASCO CME Catalog222http://cdaw.gsfc.nasa.gov/CME_list/ (Yashiro, 2004) and the SECCHI/COR2 CME Catalog333http://spaceweather.gmu.edu/seeds/secchi.php (Olmedo et al., 2008).
3 Temporal evolution of the photospheric parameters
Considering that an eruption, i.e., a flare or a CME, only lasts for a relatively short duration and an AR is not always active, we suggest that the overall features of the parameters during a noticeable duration may be more appropriate than instant values to characterize an AR’s total productivity, though instant values are more valuable for the prediction of single event. Based on this idea, we carefully check the temporal evolution of all the SHARP parameters based on photospheric vector magnetograms (Bobra et al., 2014). The duration as indicated by the vertical dashed lines in Fig. 1, during which the central meridian distance (CMD) of the AR’s geometric center is within , is chosen to avoid the low signal-to-noise of the data near the solar limb.
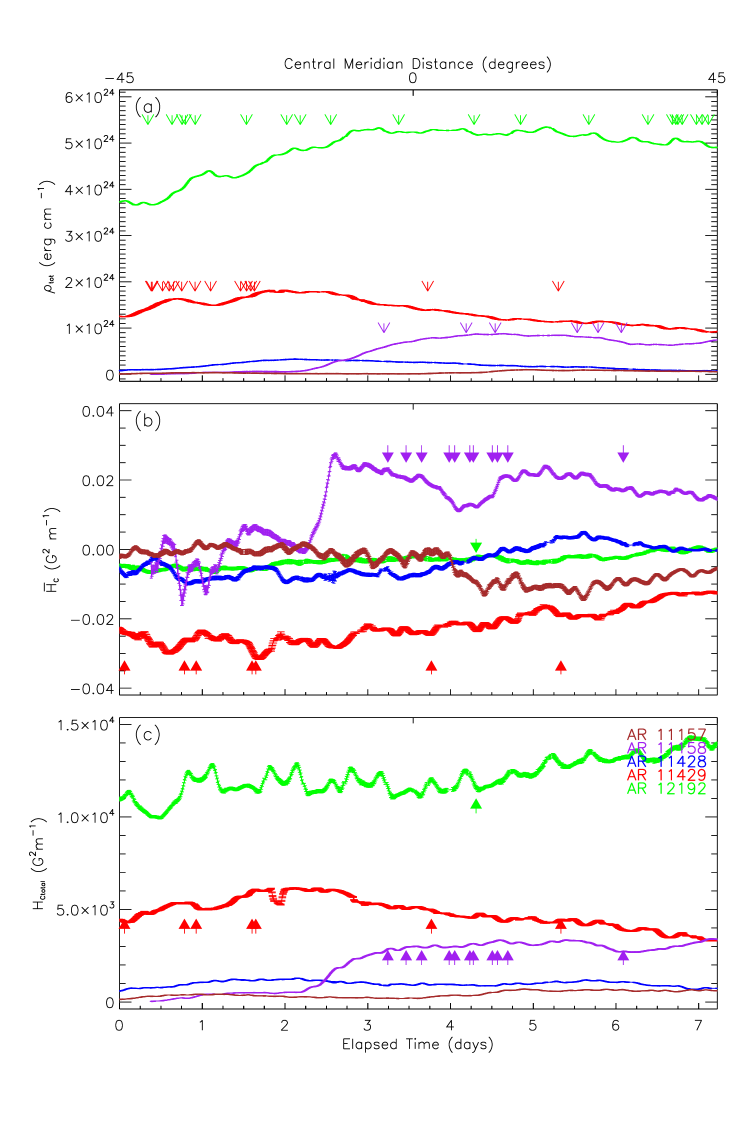
We first find that the three parameters, the total magnetic flux (), total unsigned vertical current (), proxy of photospheric free magnetic energy () may be useful to distinguish ARs of different flare productivities. Since the evolutionary trends of them are similar, only is showed in Fig. 2(a). The formal random error from the determination of vector field are overplotted as error bars, which are smaller compared to the values of the parameters themselves. Detailed formulas of the parameters are listed in Table 3.
It is obvious that the two flare-rich ARs, 11429 and 12192 have larger than the two inert ARs during their entire durations. The value of of the other prolific AR, 11158, is small until it reached the central meridian since it’s a newly emerged AR. There was no intense flare from the AR until became large, as showed by the purple hollow arrows in Fig. 2(a). The mean values of , and of AR 11158, 11429, 12192 during the duration, as showed in Table 1, are also larger than the two inert ones’. The results are consistent with the well-known picture that total flux is a physical measure of the size of an AR, reflecting the total magnetic energy contained in the AR; the electric current describes the deviation of the magnetic field from potential configuration, referring to the accumulation of free energy. The rapid dissipation of current could be manifested by flares, thus the strong current system seems to be a favorable condition for flares.
It is hard to tell which parameter is more critical. As achieved by many previous studies, the combination of the three parameters is responsible for the flare productivity (Leka and Barnes, 2007). In fact, such a combination of the sharp parameters have been used for flare prediction: through employing a machine-learning algorithm, a set of quantities that mostly describe the magnetic energy and vertical current, could achieve a relatively high ability to distinguish flaring and non-flaring ARs (Bobra and Couvidat, 2015).
We also find another parameter, mean current helicity (), being well consistent with the CME productivity, as showed in Fig. 2 (b). Though AR 12192 is the largest AR, its mean current helicity () is comparable to the two inert ARs’, smaller than the two both-rich ARs’.
Quantities describing current helicity are sometimes used as photospheric proxies of magnetic helicity (e.g., N.seehafer, 1990; Abramenko et al., 1996; Bao and Zhang, 1998; Zhang and Bao, 1998; Zhang et al., 2000; Wang and Zhang, 2015). Magnetic helicity, defined as , reflecting the twist, shear, linking or other non-potential properties of magnetic field, is approximately conserved in nearly-ideal MHD circumstance, e.g., the atmosphere of the sun (Berger and Field, 1984; Low and Berger, 2003; Brown et al., 1999; Pevtsov et al., 1995; Démoulin, 2007; Pevtsov et al., 2014). Excess injected into the corona could be reorganized by locally resistant activities, finally erupt out in the form of highly sheared or twisted core field (e.g., flux ropes) contained in CMEs. It is pointed that ARs with eruptive flares contain more coronal magnetic helicity than the ones with confined flares (M.D.Andrews and A.Nindos, 2004; Tziotziou et al., 2012). In the nearly force-free state, the currents are almost parallel to the magnetic field lines, the helicity of current therefore could be a proxy of magnetic helicity.
However, the mean current helicity () that we used above is a signed average. Large value of does indicate the presence of highly sheared or twisted field in one handedness, but small value of could be the result of either absence of highly sheared or twisted field, or the offset between two highly sheared or twisted fields with opposite handedness. Thus an additional parameter, total unsigned current helicity , is checked to find the reason of small of the three CME-poor ARs . As showed in Fig. 2 (c), AR 11157, 11428 have small , but AR 12192 has quite large , which means that there may be some sheared or twisted fields in AR 12192, too. Pre-existing, highly sheared or twisted core field could serve as a seed structure for a CME, so why is AR 12192 still CME-poor? The position and the maturity of the core field and the confinement above the AR may be responsible. To further check this speculation, we investigate the spatial distribution of current helicity on the photosphere and decay index of the magnetic field above the ARs in the next section.
4 Pre-flare conditions
4.1 Spatial Distribution of Current Helicity
We inspect the spatial distribution of current helicity on the photosphere of the ARs at specific moments: central meridian transits for the two inert ARs, 11157 and 11428; the moments right before the onsets of the largest flares of the three productive ARs: the X2.2 (2011-02-15T01:44) flare for 11158, the X5.4 (2012-03-07T00:02) flare for 11429, and the X3.1 (2014-10-24T21:07) flare for 12192. The former two flares are eruptive, and the last one is confined.
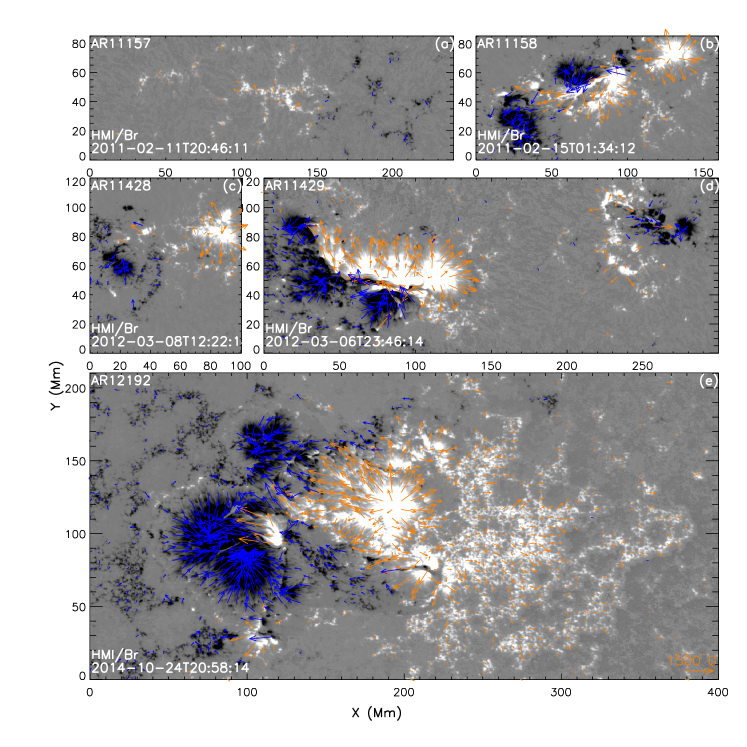
Fig. 3 shows the vector magnetic field at the specific moments of the five ARs, component is plotted as background in a dynamic range of Gausses, white (black) patches for the positive (negative) . Orange (blue) arrows show the horizontal field component, that originate from positive (negative) region. The panels are plotted in unit of Mm with the same scale, allowing direct comparison of the size of the ARs. Clealy AR 12192 is the largest one, having strong magnetic field as the other two productive ARs. It should be noted that there are some “bad pixels” with abnormal weak in the center of the neagtive polarity of AR 12192, may be a result of failed inversion. We set thresholds on both the values of formal errors and the relative errors to the vector magnetic field, find out those pixels and smooth them with ambient pixels. Current helicity is calculated after the smooth. In each pixel, it is calculated by the formula , in which the vertical current density is weighted by , the vertical component of magnetic field, which makes more sensitive to the twist or shear of vertical field under the force-free assumption.
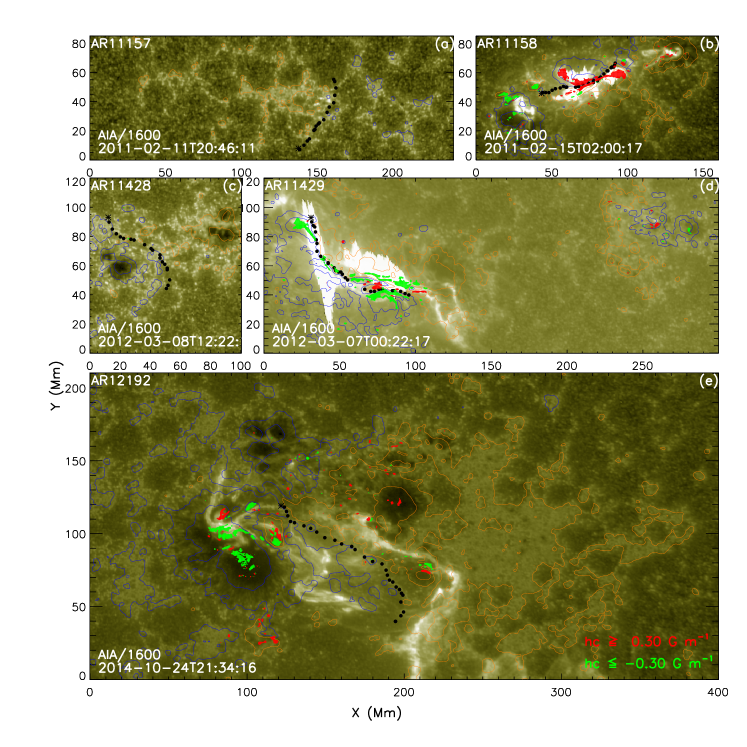
Colored patches in Fig. 4 shows the distribution of the current helicity, red for the regions of and green for , the threshold of is about two times of standard deviation from mean value of map of AR 12192, which could find regions of extremely large . The background are images of near the flares’ peak, showing the positions of the flare ribbons. component of the field is contoured on the images, orange contours for positive of gausses , blue contours for negative of gausses.
The black dotted lines indicate the neutral lines where the flares originated if any. One may expect the flare of AR 12192 mainly associated with the positive polarity within the major negative-polarity concentration, but the flare did light along the neutral line indicated by the black dotted line, as showed by the flare ribbons in Fig. 4(e), that is also confirmed in Thalmann’s work (Thalmann et al., 2015). It is clear that in each of the two ARs with eruptive flares, AR 11158 and 11429, there is strong, concentrated current helicity along both sides of the neutral lines associated with the flare ribbons; while almost no strong current helicity exists in the two inert ARs, 11157 and 11428. In the AR with confined flare, AR 12192, strong, concentrated current helicity exists predominantly in the biggest negative polarity spot, far from the flaring neutral line.
The concentrated patches of strong current helicity along the flaring neutral line may indicate the photospheric footprints of the highly sheared or twisted core field that may serve as the seed of a CME. We think that for a mature core field, its field lines should come out from a strong region of the positive polarity, and go into a strong region of the negative polarity, which means that there should be strong regions in both positive and negative polarities on the photosphere. Then one may expect the magnetic flux in the positive and negative polarity patches with strong being roughly balanced. Thus we propose a ratio () between the magnetic flux contributed by the strong regions in both polarities to test this speculation. The current helicity and magnetic flux in the strong region of the three productive ARs are listed in Table. 4. For all pixels where , of AR 11158, 11429 are not larger than 1.6, indicating a rough balance between the positive and negative magnetic flux in those regions; while of AR 12192 is 2.58, indicating a stronger flux imbalance. Furtherly, an AR usually has a dominant current helicity sign, as indicated by in Fig. 2 and Table. 1, positive for AR 11158, negative for AR 11429 and AR 12192. It may refer to a dominant handedness of twist or shear in an AR. Thus we introduce another ratio, , similar to but only for the pixels where greater than the threshold in the dominant sign. It is found that of AR 12192 is 4.67, much larger than the value of AR 11158 and AR 11429, showing a stronger flux imbalance of strong regions in both polarities. These results suggest that there might be no mature sheared or twisted core field in AR 12192, and the large value of shown in Fig. 2c could be a result of the large area of the AR. For the two inert ARs, 11157 and 11428, there are no such seed structures, too, as exhibited by the distribution. The current helicity explored here can be easily derived from the measurements of the photosphere magnetic field, and could be a useful parameter for the space weather forecasting.
4.2 Decay Index
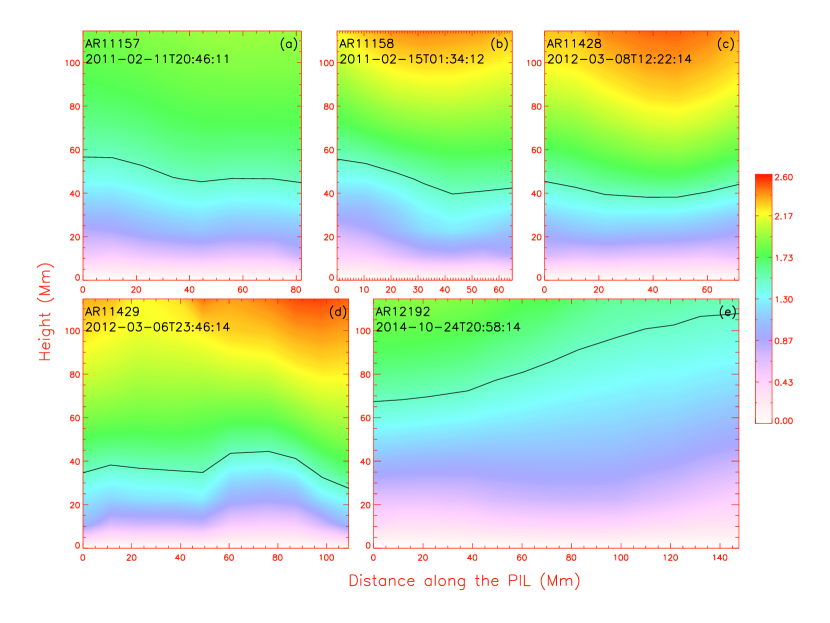
Further, the pre-existing core field may be constrained by the external field. We check the decay index of the ARs in this section to discover the constraint above the ARs. Decay index is defined by , in which is the height from the solar surface, is the external field above the AR. The coronal magnetic field here is potential field extrapolated from SDO/HMI synoptic chart by using the potential field source surface (PFSS) model (Schatten et al., 1969; Wang and Sheeley Jr, 1992). A larger decay index means that the constraint in the corona decrease faster with increasing height, and therefore a perturbation in the lower corona may cause the CME seed to erupt out more easily (Torok and Kliem, 2005; Wang and Zhang, 2007; Liu, 2008). Critical value above which an eruption is more likely to occur is (Török and Kliem, 2007; Aulanier et al., 2010).
Fig. 5 shows the spatial distribution of decay index along the flaring neutral lines, the black lines mark the critical heights where reaches . Clearly, the heights of AR 11158 and 11429 where reach 1.5 are lower than AR 12192, which means the constraining field above the two ARs with eruptive flares decays rapidly than the one with confined flare, making a CME more easily. The two inert ARs, 11157 and 11428 also have relatively low critical heights, but they have no appreciable seed structures as pointed out before. Thus there was no CME even though the external field decayed rapidly.
5 Concluding Remarks
In this work, through comparing AR 12192 with other four ARs, we find that three parameters: the total magnetic flux (), total unsigned vertical current (), proxy of photospheric free magnetic energy (), could be responsible for the flare productivity of our sample ARs. The flare-rich only AR 12192, same as the other two flare-rich ARs, 11158 and 11429, has larger , and , which means that they have larger size, and contain stronger current system and more free magnetic energy than the two inert ARs 11157 and 11428. It is reasonable since sufficient amount of free magnetic energy is a necessary condition for an AR to power flares.
No single threshold on any parameter could be used to distinguish the flare and CME productivity of the ARs, but the combination of the mean current helicity and the total unsigned current helicity can be used to distinguish the flare and CME productivity. The magnitude of the mean current helicity () is large for the CME-rich ARs, and small for AR 12192 and the other two CME-poor ARs, while the total unsigned current helicity () of AR 12192 is as large as the two CME-rich ARs, indicating the presence of sheared or twisted field in all three flare-productive ARs. Considering the spatial distribution of current helicity, AR 12192 has concentrated in only one polarity, suggesting the absence of a mature seed structure for CME formation during flares. The CME-rich ARs can also be distinguished by the constraint of the overlying arcade field: AR 12192 has a smaller decay index than the CME-rich ARs, thus no strong CME accompanied the many intense flares it produced.
Our study here suggests that pre-existing seed structures at flaring position might be a necessary condition for CMEs. Besides, a large decay index above the AR’s flaring neutral lines, which indicates a weak constraint, may be another necessary condition for CMEs. All these facts explain the unusual behaviour of the AR 12192: super flare-rich but CME-poor. The conclusion is obtained based on a sample of five ARs, it’s generality should be checked within a larger sample, which would be performed in the future.
References
- Abramenko et al. [1996] Abramenko, V. I., T. Wang, and V. B. Yurchishin, Analysis of electric current helicity in active regions on the basis of vector magnetograms, Sol. Phys., 168, 75–89, 10.1007/BF00145826, 1996.
- Akiyama et al. [2007] Akiyama, S., S. Yashiro, and N. Gopalswamy, The CME-productivity associated with flares from two active regions, Adv. Sp. Res., 39(9), 1467–1470, 10.1016/j.asr.2007.03.033, 2007.
- Aulanier et al. [2010] Aulanier, G., T. Török, P. Démoulin, and E. E. DeLuca, Formation of Torus-Unstable Flux Ropes and Electric Currents in Erupting Sigmoids, Astrophys. J., 708(1), 314–333, 10.1088/0004-637X/708/1/314, 2010.
- Bao and Zhang [1998] Bao, S., and H. Zhang, Patterns of Current Helicity for Solar Cycle 22, Astrophys. J., 496, L43–L46, 10.1086/311232, 1998.
- Berger and Field [1984] Berger, M. a., and G. B. Field, The topological properties of magnetic helicity, J. Fluid Mech., 147, 133–148, 10.1017/S0022112084002019, 1984.
- Bobra and Couvidat [2015] Bobra, M. G., and S. Couvidat, Solar Flare Prediction Using SDO /HMI Vector Magnetic Field Data With a Machine-Learning Algorithm, Astrophys. J., 798(2), 135, 10.1088/0004-637X/798/2/135, 2015.
- Bobra et al. [2014] Bobra, M. G., X. Sun, J. T. Hoeksema, M. Turmon, Y. Liu, K. Hayashi, G. Barnes, and K. D. Leka, The Helioseismic and Magnetic Imager (HMI) Vector Magnetic Field Pipeline: SHARPs – Space-Weather HMI Active Region Patches, Sol. Phys., 289(9), 3549–3578, 10.1007/s11207-014-0529-3, 2014.
- Brown et al. [1999] Brown, M. R., R. C. Canfield, and A. A. Pevtsov, Magnetic helicity in space and laboratory plasmas, Am. Geophys. Union, Geophys. Monogr. Ser., 111, 1999.
- Brueckner et al [1995] Brueckner, GE and Howard, RA and Koomen, MJ and Korendyke, CM and Michels, DJ and Moses, JD and Socker, DG and Dere, KP and Lamy, PL and Llebaria, A., The Large Angle Spectroscopic Coronagraph (LASCO), Sol. Phys., 162, 357–402, 1995.
- Canfield et al. [1999] Canfield, R. C., H. S. Hudson, and D. E. McKenzie, Sigmoidal morphology and eruptive solar activity, Geophys. Res. Lett., 26(6), 627–630, 10.1029/1999GL900105, 1999.
- Chen and Wang [2012] Chen, A., and J. Wang, Quantifying solar superactive regions with vector magnetic field observations, Astron. Astrophys., 543, 49, 10.1051/0004-6361/201118037, 2012.
- Chen et al. [2011] Chen, C., Y. Wang, and C. Shen, Statistical study of coronal mass ejection source locations: 2. Role of active regions in CME production, J. Geophys. Res. Sp. Phys., 116(A12108), 10.1029/2011JA016844, 2011.
- Démoulin [2007] Démoulin, P., Recent theoretical and observational developments in magnetic helicity studies, Adv. Sp. Res., 39, 1674–1693, 10.1016/j.asr.2006.12.037, 2007.
- Emslie et al. [2012] Emslie, a. G., B. R. Dennis, a. Y. Shih, P. C. Chamberlin, R. a. Mewaldt, C. S. Moore, G. H. Share, A. Vourlidas, and B. T. Welsch, Global Energetics of Thirty-Eight Large Solar Eruptive Events, Astrophys. J., 759(1), 71, 10.1088/0004-637X/759/1/71, 2012.
- Falconer et al. [2002] Falconer, D. A., R. L. Moore, and G. A. Gary, Correlation of the Coronal Mass Ejection Productivity of Solar Active Regions with Measures of Their Global Nonpotentiality from Vector Magnetograms: Baseline Results, Astrophys. J., 569(2), 1016, 2002.
- Falconer et al. [2006] Falconer, D. A., R. L. Moore, and G. a. Gary, Magnetic Causes of Solar Coronal Mass Ejections: Dominance of the Free Magnetic Energy over the Magnetic Twist Alone, Astrophys. J., 644(2), 1258–1272, 10.1086/503699, 2006.
- Feynman and Hundhausen [1994] Feynman, J., and A. J. Hundhausen, Coronal mass ejections and major solar flares: The great active center of March 1989, J. Geophys. Res. Sp. Phys., 99(A5), 8451–8464, 1994.
- Georgoulis and Rust [2007] Georgoulis, M. K., and D. M. Rust, Quantitative forecasting of major solar flares, Astrophys. J. Lett., 661(1), L109, 2007.
- Green et al. [2002a] Green, L. M., M. C. López Fuentes, C. H. Mandrini, P. Démoulin, L. Van Driel-Gesztelyi, and J. L. Culhane, The magnetic helicity budget of a CME-prolific active region, Sol. Phys., 208, 43–68, 10.1023/A:1019658520033, 2002a.
- Green et al. [2002b] Green, L. M., S. A. Matthews, L. van Driel-Gesztelyi, L. K. Harra, and J. L. Culhane, Multi-wavelength observations of an X-class flare without a coronal mass ejection., Sol. Phys., 205(2), 325–339, 2002b.
- Guo et al. [2007] Guo, J., H. Q. Zhang, and O. V. Chumak, Magnetic properties of flare-CME productive active regions and CME speed, Astron. Astrophys., 462(3), 1121–1126, 10.1051/0004-6361:20065888, 2007.
- Harrison [1995] Harrison, R. A., The nature of solar flares associated with coronal mass ejection., Astron. Astrophys., 304, 585, 1995.
- Hoeksema et al. [2014] Hoeksema, J., Y. Liu, K. Hayashi, and X. Sun, The Helioseismic and Magnetic Imager (HMI) Vector Magnetic Field Pipeline: Overview and Performance, Sol. Phys., 289, 3483–3530, 10.1007/s11207-014-0516-8, 2014.
- Jing et al. [2006] Jing, J., H. Song, and V. Abramenko, The statistical relationship between the photospheric magnetic parameters and the flare productivity of active regions, Astrophys. J., 644(2), 1273–1277, 2006.
- Kaiser et al. [2008] Kaiser, M. L., T. a. Kucera, J. M. Davila, O. C. S. Cyr, M. Guhathakurta, and E. Christian, The STEREO mission: An introduction, Space Sci. Rev., 136(1), 5–16, 10.1007/s11214-007-9277-0, 2008.
- Leka and Barnes [2003] Leka, K. D., and G. Barnes, Photospheric Magnetic Field Properties of Flaring versus Flare‐quiet Active Regions. II. Discriminant Analysis, Astrophys. J., 595(2), 1296–1306, 10.1086/377512, 2003.
- Leka and Barnes [2007] Leka, K. D., and G. Barnes, Photospheric Magnetic Field Properties of Flaring versus Flare‐quiet Active Regions. IV. A Statistically Significant Sample, Astrophys. J., 656(2), 1173–1186, 10.1086/510282, 2007.
- Leka and Barnes.G [2003] Leka, K. D., and Barnes.G, Photospheric magnetic field properties of flaring versus flare-quiet active regions. i. data, general approach, and sample results, Astrophys. J., 595, 1277–1295, 2003.
- Lemen et al. [2012] Lemen, J. R., et al., The Atmospheric Imaging Assembly (AIA) on the Solar Dynamics Observatory (SDO), Sol. Phys., 275(1-2), 17–40, 10.1007/s11207-011-9776-8, 2012.
- Lin and Forbes [2000] Lin, J., and T. G. Forbes, Effects of reconnection on the coronal mass ejection process, J. Geophys. Res. Sp. Phys., 105(A2), 2375–2392, 2000.
- Liu [2008] Liu, Y., Magnetic Field Overlying Solar Eruption Regions and Kink and Torus Instabilities, Astrophys. J. Lett., 679(2), L151, 2008.
- Liu and Schuck [2012] Liu, Y., and P. W. Schuck, Magnetic Energy and Helicity in Two Emerging Active Regions in the Sun, Astrophys. J., 761(2), 105, 10.1088/0004-637X/761/2/105, 2012.
- Low [1994] Low, B. C., Magnetohydrodynamic processes in the solar corona: Flares, coronal mass ejections, and magnetic helicity, Phys. Plasmas, 1(5), 1684–1690, 10.1063/1.870671, 1994.
- Low and Berger [2003] Low, B. C., and M. a. Berger, A Morphological Study of Helical Coronal Magnetic Structures, Astrophys. J., 589, 644–657, 10.1086/374614, 2003.
- M.D.Andrews and A.Nindos [2004] M.D.Andrews, and A.Nindos, The association of big flares and coronal mass ejections :what is the role of magnetic helicity?, Astrophys. J., 616, 175–178, 2004.
- Nindos et al. [2003] Nindos, A., J. Zhang, and H. Zhang, The Magnetic Helicity Budget of Solar Active Regions and Coronal Mass Ejections, Astrophys. J., 594, 1033–1048, 2003.
- N.seehafer [1990] N.seehafer, Electric current helicity in the solar atmosphere, Sol. Phys., 125, 219–232, 1990.
- Olmedo et al. [2008] Olmedo, O., J. Zhang, H. Wechsler, A. Poland, and K. Borne, Automatic detection and tracking of coronal mass ejections in coronagraph time series, Sol. Phys., 248(2), 485–499, 10.1007/s11207-007-9104-5, 2008.
- Pevtsov et al. [1995] Pevtsov, A. a., R. C. Canfield, and T. R. Metcalf, Latitudinal variation of helicity of photospheric magnetic fields, Astrophys. J., 440, 109–112, 10.1086/187773, 1995.
- Pevtsov et al. [2014] Pevtsov, A. a., M. a. Berger, A. Nindos, A. a. Norton, and L. van Driel-Gesztelyi, Magnetic Helicity, Tilt, and Twist, Space Sci. Rev., 186(1-4), 285–324, 10.1007/s11214-014-0082-2, 2014.
- [41] RHESSI science nugget no.239, http://sprg.ssl.berkeley.edu/~tohban/wiki/index.php/A_Record-Setting_CMEless_Flare.
- Sammis et al. [2000] Sammis, I., F. Tang, and H. Zirin, The dependence of large flare occurrence on the magnetic structure of sunspots, Astrophys. J., 540(1), 583, 2000.
- Schatten et al. [1969] Schatten, K. H., J. M. Wilcox, and N. F. Ness, A model of interplanetary and coronal magnetic fields, Sol. Phys., 6(3), 442–455, 1969.
- Schrijver [2007] Schrijver, C. J., A Characteristic Magnetic Field Pattern Associated with All Major Solar Flares and Its Use in Flare Forecasting, Astrophys. J., 655(2), L117–L120, 10.1086/511857, 2007.
- Schrijver [2009] Schrijver, C. J., Driving major solar flares and eruptions: A review, Adv. Sp. Res., 43(5), 739–755, 10.1016/j.asr.2008.11.004, 2009.
- Sun et al. [2015] Sun, X., et al., Why is the great solar active region 12192 flare-rich but cme-poor?, Astrophys. J., 804, L28, 10.1088/2041-8205/804/2/L28, 2015.
- T. Amari, J. F. Luciani, Z. Mikic [1999] T. Amari, J. F. Luciani, Z. Mikic, J. L., Three-dimensional solutions of magnetohydrodynamic equations for prominence magnetic support: Twisted magnetic flux rope, Astrophys. J., 518, 57–60, 1999.
- Ternullo et al. [2006] Ternullo, M., L. Contarino, P. Romano, and F. Zuccarello, A statistical analysis of sunspot groups hosting M and X flares, Astron. Nachrichten, 327(1), 36–43, 10.1002/asna.200510485, 2006.
- Thalmann et al. [2015] Thalmann, J. K., Y. Su, M. Temmer, and a. M. Veronig, The Confined X-Class Flares of Solar Active Region 2192, Astrophys. J., 801(2), L23, 10.1088/2041-8205/801/2/L23, 2015.
- Tian et al. [2002] Tian, L., Y. Liu, and J. Wang, The Most Violent Super-Active Regions in the 22nd and 23rd Cycles, Sol. Phys., 209(2), 361–374, 2002.
- Torok and Kliem [2005] Török, T., and B. Kliem, Confined and ejective eruptions of kink-unstable flux ropes, Astrophys. J., 630, 97–100, 10.1086/462412, 2005.
- Török and Kliem [2007] Török, T., and B. Kliem, Numerical simulations of fast and slow coronal mass ejections, Astron. Nachrichten, 328(8), 743–747, 10.1002/asna.200710795, 2007.
- Tziotziou et al. [2012] Tziotziou, K., M. K. Georgoulis, and N.-E. Raouafi, The Magnetic Energy-Helicity Diagram of Solar Active Regions, Astrophys. J., 759(1), L4, 10.1088/2041-8205/759/1/L4, 2012.
- Valori et al. [2012] Valori, G., P. Démoulin, and E. Pariat, Comparing values of the relative magnetic helicity in finite volumes, Sol. Phys., 278(2), 347–366, 10.1007/s11207-012-9951-6, 2012.
- Wang and Zhang [2015] Wang, C., and M. Zhang, Correlation Between CME Occurrence Rate and Current Helicity in the Global Magnetic Field of Solar Cycle 23, Sol. Phys., 290(46), 811–818, 10.1007/s11207-015-0648-5, 2015.
- Wang and Zhang [2007] Wang, Y., and J. Zhang, A Comparative Study between Eruptive X-Class Flares Associated with Coronal Mass Ejections and Confined X-Class Flares, Astrophys. J., 665(2), 1428, 2007.
- Wang and Zhang [2008] Wang, Y., and J. Zhang, A statistical study of solar active regions that produce extremely fast coronal mass ejections, Astrophys. J., 680(2), 1516–1522, 2008.
- Wang and Sheeley Jr [1992] Wang, Y.-M., and N. R. Sheeley Jr, On potential field models of the solar corona, Astrophys. J., 392, 310–319, 1992.
- Yashiro [2004] Yashiro, S., A catalog of white light coronal mass ejections observed by the SOHO spacecraft, J. Geophys. Res., 109(A7), A07,105, 10.1029/2003JA010282, 2004.
- Yashiro et al. [2005] Yashiro, S., N. Gopalswamy, S. Akiyama, G. Michalek, and R. A. Howard, Visibility of coronal mass ejections as a function of flare location and intensity, J. Geophys. Res. Sp. Phys., 110(A12S05), 10.1029/2005JA011151, 2005.
- Yashiro et al. [2006] Yashiro, S., S. Akiyama, N. Gopalswamy, and R. a. Howard, Different Power-law Indices in the Frequency Distributions of Flares with and without Coronal Mass Ejections, Astrophys. J., 650, 143–146, 10.1086/508876, 2006.
- Zhang and Bao [1998] Zhang, H., and S. Bao, Latitudinal distribution of Photospheric Electric Current Helicity and Solar Activities, Astron. Astrophys., 339, 880–886, 10.1086/307378, 1998.
- Zhang et al. [2000] Zhang, H., L. Tian, S. Bao, and M. Zhang, Twist of Magnetic Fields in Solar Active Regions, J. Astrophys. Astron., 21, 245–247, 10.1134/1.163872, 2000.
- Zhang [2006] Zhang, M., Helicity Observation of Weak and Strong Fields, Astrophys. J., 646, 85–88, 10.1086/506560, 2006.
- Zhang and Flyer [2008] Zhang, M., and N. Flyer, The dependence of the helicity bound of force-free magnetic fields on boundary conditions, Astrophys. J., 683, 1160–1167, 10.1086/589993, 2008.
- Zhang et al. [2006] Zhang, M., N. Flyer, and B. C. Low, Magnetic Field Confinement in the Corona: The Role of Magnetic Helicity Accumulation, Astrophys. J., 644(1), 575–586, 10.1086/503353, 2006.
| NOAA | 11157 | 11158 | 11428 | 11429 | 12192 |
|---|---|---|---|---|---|
| Hemisphere | North | South | South | North | South |
| Date on the visible disk | 20110208-0217 | 20110211-0221 | 20120302-0313 | 20120303-0315 | 20141018-1030 |
| Productivity | Inert | Flare-CME-rich | Inert | Flare-CME-rich | Flare-rich only |
| () | |||||
| () | |||||
| () | |||||
| () | |||||
| () | |||||
| The lower 5 rows show the mean values and the standard deviations of the quantities during the period in which | |||||
| the CMD was within . See Table 3 for the formulas of the parameters. | |||||
| Flares | CMEs | ||||||||
| AR No. | No. | Date | Begin | End | Peak | Class | Time+ | Width | Speed |
| (UT) | (UT) | (UT) | (UT) | (degree) | (km/s) | ||||
| 11158 | 1 | 2011/02/13 | 17:28:00 | 17:47:00 | 17:38:00 | M6.6 | 18:36:05 | 276 | 373 |
| 2 | 2011/02/13 | 23:54:00 | 73 | 370† | |||||
| 3 | 2011/02/14 | 04:29:00 | 05:09:00 | 04:49:00 | C8.3 | 04:24:00 | 68 | 384† | |
| 4 | 2011/02/14 | 11:51:00 | 12:26:00 | 12:00:00 | C1.7 | 12:24:00 | 61 | 810† | |
| 5 | 2011/02/14 | 13:47:00 | 14:42:00 | 14:27:00 | C7.0 | 14:00:07 | 22 | 380 | |
| 6 | 2011/02/14 | 17:20:00 | 17:32:00 | 17:26:00 | M2.2 | 18:24:05 | 360 | 326 | |
| 7 | 2011/02/14 | 19:23:00 | 19:36:00 | 19:30:00 | C6.6 | 19:24:00 | 81 | 349† | |
| 8 | 2011/02/15 | 00:31:00 | 00:48:00 | 00:38:00 | C2.7 | 00:54:00 | 82 | 1843† | |
| 9 | 2011/02/15 | 01:44:00 | 02:06:00 | 01:56:00 | X2.2 | 02:24:05 | 360 | 669 | |
| 10 | 2011/02/15 | 04:27:00 | 04:37:00 | 04:32:00 | C4.8 | 05:24:00 | 104 | 1748† | |
| 11 | 2011/02/16 | 01:32:00 | 01:46:00 | 01:39:00 | M1.0 | ||||
| 12 | 2011/02/16 | 07:35:00 | 07:44:00 | 07:44:00 | M1.1 | ||||
| 13 | 2011/02/16 | 14:19:00 | 14:29:00 | 14:25:00 | M1.6 | 14:54:00 | 75 | 320† | |
| 14 | 2011/02/18 | 09:55:00 | 10:15:00 | 10:11:00 | M6.6 | ||||
| 15 | 2011/02/18 | 12:12:05 | 89 | 350 | |||||
| 16 | 2011/02/18 | 12:59:00 | 13:06:00 | 13:03:00 | M1.4 | ||||
| 11429 | 1 | 2012/03/03 | 17:56:00 | 18:05:00 | 18:03:00 | C1.1 | 18:36:05 | 192 | 1078 |
| 2 | 2012/03/04 | 10:29:00 | 12:16:00 | 10:52:00 | M2.0 | 11:00:07 | 360 | 1306 | |
| 3 | 2012/03/04 | 20:48:05 | 50 | 720 | |||||
| 4 | 2012/03/05 | 02:30:00 | 04:43:00 | 04:05:00 | X1.1 | 03:12:09 | 92 | 594 | |
| 5 | 2012/03/05 | 11:24:06 | 50 | 428 | |||||
| 6 | 2012/03/05 | 19:10:00 | 19:21:00 | 19:16:00 | M2.1 | ||||
| 7 | 2012/03/05 | 19:27:00 | 19:32:00 | 19:30:00 | M1.8 | ||||
| 8 | 2012/03/05 | 22:26:00 | 22:42:00 | 22:34:00 | M1.3 | ||||
| 9 | 2012/03/06 | 00:22:00 | 00:31:00 | 00:28:00 | M1.3 | ||||
| 10 | 2012/03/06 | 01:36:00 | 01:50:00 | 01:44:00 | M1.2 | ||||
| 11 | 2012/03/06 | 04:01:00 | 04:08:00 | 04:05:00 | M1.0 | 04:48:06 | 111 | 536 | |
| 12 | 2012/03/06 | 07:52:00 | 08:00:00 | 07:55:00 | M1.0 | 08:12:08 | 107 | 599 | |
| 13 | 2012/03/06 | 12:23:00 | 12:54:00 | 12:41:00 | M2.1 | ||||
| 14 | 2012/03/06 | 21:04:00 | 21:14:00 | 21:11:00 | M1.3 | ||||
| 15 | 2012/03/06 | 22:49:00 | 23:11:00 | 22:53:00 | M1.0 | ||||
| 16 | 2012/03/07 | 00:02:00 | 00:40:00 | 00:24:00 | X5.4 | 00:24:06 | 360 | 2684 | |
| 17 | 2012/03/07 | 01:05:00 | 01:23:00 | 01:14:00 | X1.3 | 01:30:24 | 360 | 1825 | |
| 18 | 2012/03/09 | 03:22:00 | 04:18:00 | 03:53:00 | M6.3 | 04:26:09 | 360 | 950 | |
| 19 | 2012/03/10 | 17:15:00 | 18:30:00 | 17:46:00 | M8.4 | 18:00:05 | 88 | 491 | |
| 20 | 2012/03/13 | 11:36:05 | 54 | 229 | |||||
| 21 | 2012/03/13 | 17:12:00 | 17:41:00 | 17:30:00 | M7.9 | 17:36:05 | 360 | 1884 | |
| 22 | 2012/03/14 | 11:36:05 | 11 | 565 | |||||
| 23 | 2012/03/14 | 14:48:05 | 28 | 533 | |||||
| 24 | 2012/03/15 | 02:00:05 | 74 | 318 | |||||
| 25 | 2012/03/15 | 10:24:05 | 31 | 388 | |||||
| 12192 | 1 | 2014/10/18 | 07:02:00 | 08:49:00 | 07:58:00 | M1.6 | |||
| 2 | 2014/10/19 | 04:17:00 | 05:48:00 | 05:03:00 | X1.1 | ||||
| 3 | 2014/10/20 | 09:00:00 | 09:20:00 | 09:11:00 | M3.9 | ||||
| 4 | 2014/10/20 | 16:00:00 | 16:55:00 | 16:37:00 | M4.5 | ||||
| 5 | 2014/10/20 | 18:55:00 | 19:04:00 | 19:02:00 | M1.4 | ||||
| 6 | 2014/10/20 | 19:53:00 | 20:13:00 | 20:03:00 | M1.7 | ||||
| 7 | 2014/10/20 | 22:43:00 | 23:13:00 | 22:55:00 | M1.2 | ||||
| 8 | 2014/10/21 | 13:35:00 | 13:40:00 | 13:38:00 | M1.2 | ||||
| 9 | 2014/10/22 | 01:16:00 | 01:59:00 | 01:59:00 | M8.7 | ||||
| 10 | 2014/10/22 | 05:11:00 | 05:21:00 | 05:17:00 | M2.7 | ||||
| 11 | 2014/10/22 | 14:02:00 | 14:50:00 | 14:28:00 | X1.6 | ||||
| 12 | 2014/10/23 | 09:44:00 | 09:56:00 | 09:50:00 | M1.1 | ||||
| 13 | 2014/10/24 | 07:37:00 | 07:53:00 | 07:48:00 | M4.0 | 08:00:05 | 96 | 677 | |
| 14 | 2014/10/24 | 21:07:00 | 22:13:00 | 21:40:00 | X3.1 | ||||
| 15 | 2014/10/25 | 16:55:00 | 17:08:00 | 17:08:00 | X1.0 | ||||
| 16 | 2014/10/26 | 10:04:00 | 11:18:00 | 10:56:00 | X2.0 | ||||
| 17 | 2014/10/26 | 17:08:00 | 17:30:00 | 17:17:00 | M1.0 | ||||
| 18 | 2014/10/26 | 18:07:00 | 18:20:00 | 18:15:00 | M4.2 | ||||
| 19 | 2014/10/26 | 18:43:00 | 18:56:00 | 18:49:00 | M1.9 | ||||
| 20 | 2014/10/26 | 19:59:00 | 20:45:00 | 20:21:00 | M2.4 | ||||
| 21 | 2014/10/27 | 00:06:00 | 00:44:00 | 00:34:00 | M7.1 | ||||
| 22 | 2014/10/27 | 01:44:00 | 02:11:00 | 02:02:00 | M1.0 | ||||
| 23 | 2014/10/27 | 03:35:00 | 03:48:00 | 03:41:00 | M1.3 | ||||
| 24 | 2014/10/27 | 09:59:00 | 10:26:00 | 10:09:00 | M6.7 | ||||
| 25 | 2014/10/27 | 14:12:00 | 15:09:00 | 14:47:00 | X2.0 | ||||
| 26 | 2014/10/27 | 17:33:00 | 17:47:00 | 17:40:00 | M1.4 | ||||
| 27 | 2014/10/28 | 02:15:00 | 03:08:00 | 02:41:00 | M3.4 | ||||
| 28 | 2014/10/28 | 03:23:00 | 03:41:00 | 03:32:00 | M6.6 | ||||
| 29 | 2014/10/28 | 13:54:00 | 14:23:00 | 14:06:00 | M1.6 | ||||
| 30 | 2014/10/29 | 06:03:00 | 08:20:00 | 08:20:00 | M1.0 | ||||
| 31 | 2014/10/29 | 09:54:00 | 10:06:00 | 10:01:00 | M1.2 | ||||
| 32 | 2014/10/29 | 14:24:00 | 14:33:00 | 14:33:00 | M1.4 | ||||
| 33 | 2014/10/29 | 16:06:00 | 16:33:00 | 16:20:00 | M1.0 | ||||
| 34 | 2014/10/29 | 18:47:00 | 18:52:00 | 18:50:00 | M1.3 | ||||
| 35 | 2014/10/29 | 21:18:00 | 21:25:00 | 21:22:00 | M2.3 | ||||
| 36 | 2014/10/30 | 00:34:00 | 00:40:00 | 00:37:00 | M1.3 | ||||
| 37 | 2014/10/30 | 01:19:00 | 01:56:00 | 01:35:00 | M3.5 | ||||
| 38 | 2014/10/30 | 04:17:00 | 04:36:00 | 04:28:00 | M1.2 | ||||
∗ Blanks in the flare (CME) column mean no C-class or intenser flare (CME) associated with the CME (flare). + First appearance in the field of view of the SOHO/LASCO C2 or the STEREO/COR2 (Missed by C2). † CMEs recorded by COR2.
| Parameters | Description | Unit | Formula | Statistic |
|---|---|---|---|---|
| Total unsigned flux | Integral | |||
| Proxy for total photospheric | Integral | |||
| excess magnetic energy | ||||
| total unsigned vertical current | Integral | |||
| mean current helicity ( contribution) | Mean | |||
| Total unsigned current helicity | Sum |
∗ Adapted from Bobra et al. [2014]. Here
| AR No. | Parameters in all strong pixels | Parameters in strong pixels of dominant sign | ||||||||
| () | () | () | () | |||||||
| in | in | in | in | in | in | in | in | |||
| 11158 | 885.70 | 674.69 | 2.11 | -2.24 | 1.06 | 625.86 | 441.28 | 1.64 | -1.46 | 1.12 |
| 11429 | 964.28 | 1642.08 | 2.83 | -4.47 | 1.58 | -732.27 | -1381.21 | 2.24 | -3.83 | 1.71 |
| 12192 | 1307.59 | 1988.95 | 3.58 | -9.23 | 2.58 | -589.88 | -1385.31 | 1.49 | -6.95 | 4.67 |
∗ () refers to positive (negative) polarity.
Strong regions refer to pixels where
Quantities are calculated by:
; ;
;
() is the larger ratio between () in different polarities.
Superscript t means threshold ( here) of ; subscript d means dominant sign of .