Optically Detected Ferromagnetic Resonance in Metallic Ferromagnets via Nitrogen Vacancy Centers in Diamond
Abstract
We report quantitative measurements of optically detected ferromagnetic resonance (ODFMR) of ferromagnetic thin films that use nitrogen-vacancy (NV) centers in diamonds to transduce FMR into a fluorescence intensity variation. To uncover the mechanism responsible for these signals, we study ODFMR as we 1) vary the separation of the NV centers from the ferromagnet (FM), 2) record the NV center longitudinal relaxation time during FMR, and 3) vary the material properties of the FM. Based on the results, we propose the following mechanism for ODFMR. Decay and scattering of the driven, uniform FMR mode results in spinwaves that produce fluctuating dipolar fields in a spectrum of frequencies. When the spinwave spectrum overlaps the NV center ground-state spin resonance frequencies, the dipolar fields from these resonant spinwaves relax the NV center spins, resulting in an ODFMR signal. These results lay the foundation for an approach to NV center spin relaxometry to study FM dynamics without the constraint of directly matching the NV center spin-transition frequency to the magnetic system of interest, thus enabling an alternate modality for scanned-probe magnetic microscopy that can sense ferromagnetic resonance with nanoscale resolution.
Understanding magnetic dynamics in future storage and information processing technologies will be a key to their development (Bader and Parkin, 2010; Žutić et al., 2004). In particular, it will be necessary to measure and understand relaxation (Tserkovnyak et al., 2002; Slonczewski, 1996), angular momentum transfer (Ralph and Stiles, 2008; Qiu et al., 2013; Adur et al., 2014, 2015) and spinwave propagation (Vashkovskii et al., 1996; Kajiwara et al., 2010; Demokritov, 2009), not only in extended magnetic films, but also in nanoscale devices (Krivoruchko, 2015). In addition, establishing new mechanisms for imaging magnetization dynamics in confined structures will aid in improving current magnetic technologies (Childress et al., 2008; Parkin et al., 1999; Ikeda et al., 2010; Parkin et al., 2008) and enhance them using emerging materials such as those featuring magnetic textures (Nagaosa and Tokura, 2013; Tokunaga et al., 2015; Fert et al., 2013).
The nitrogen-vacancy (NV) center in diamond has emerged as a flexible and sensitive platform for nanoscale magnetic sensing (Schirhagl et al., 2014; Balasubramanian et al., 2008; Maze et al., 2008) due to its atomic-scale size and its spin-sensitive fluorescence, enabling optical detection of magnetic dynamics (Tetienne et al., 2014; van der Sar et al., 2015; Dussaux et al., 2015). NV-based magnetometry aimed at dynamic magnetic fields have typically required either spin-echo protocols (Taylor et al., 2008), which are constrained to frequencies that are quasi-static compared to FMR (e.g. MHz or below), or it requires direct resonance with an NV center spin transition (Wang et al., 2015; Appel et al., 2015).
In contrast, we have recently demonstrated an alternate modality (Wolfe et al., 2014, 2016) for detecting ferromagnetic resonance with diamond NV centers placed in nanoscale proximity to Yttrium Iron Garnet (YIG) that uses a simple, continuous wave (CW) protocol. A surprising observation was the change of NV center fluorescence due to ferromagnetic resonance at frequencies that were well separated from the NV center spin resonance. Conveniently, these signals were acquired with no direct resonant manipulation of the NV center spins, making them ideal for integration with future NV center-based scanned-probe microscopy of magnetic resonance. Establishing the mechanism of these signals is key to their future use.
We posit that the off-resonant, FMR-induced change in NV center spin-state – and thus its fluorescence variation – must result from fluctuating dipolar fields produced by the ferromagnetic excitation. Since the uniform FMR mode of a continuous film cannot produce a fluctuating dipolar field outside its boundaries, we suggest that a spectrum of spatially-inhomogeneous dipole fields from spinwaves are generated during the decay of the uniform mode that relax the NV center spins (Schultheiss et al., 2012). The effect will be largest when the wavelength of a spinwave is comparable to the separation between the surface of the ferromagnet and the NV centers, and when the spinwave frequency matches the NV center spin resonance. Here we present experimental data which supports this idea.
The experimental results and related analysis are organized as follows: In Section I, we first show an ODFMR signal from a permalloy (Ni80Fe20) thin film measured using a single crystal diamond which has well-defined NV orientations. In contrast to previous ODFMR measurements using randomly oriented NV centers in nanodiamonds, the single crystal samples containing a thin layer of implanted NV centers allow us to control the NV center-ferromagnet (NV-FM) separation, . We study the variation of the ODFMR signal as a function of . This data suggests that the signal is optimized at a separation matching the wavelength of spinwaves whose frequency matches the NV spin resonance. In Section II, we quantitatively measure the longitudinal spin relaxation lifetime () of the ground-state NV center spin, which is reduced as we drive the FM on resonance. This directly demonstrates that ODFMR arises due to interactions between the ground-state NV center spin and a driven ferromagnetic system. In Section III, we demonstrate the generality of the ODFMR effect by measuring it in three ferromagnets: permalloy (Py), cobalt (Co), and cobalt manganese iron germanium (CMFG) (Page et al., 2016), a Heusler alloy of interest for read heads; this helps us probe the mechanism by measuring the variation of the signal with material properties. Finally, in Section IV, we discuss our conclusions and key future experiments.
I I: Demonstration of ODFMR in single crystal NV-Py system and dependence of signal on NV-FM separation
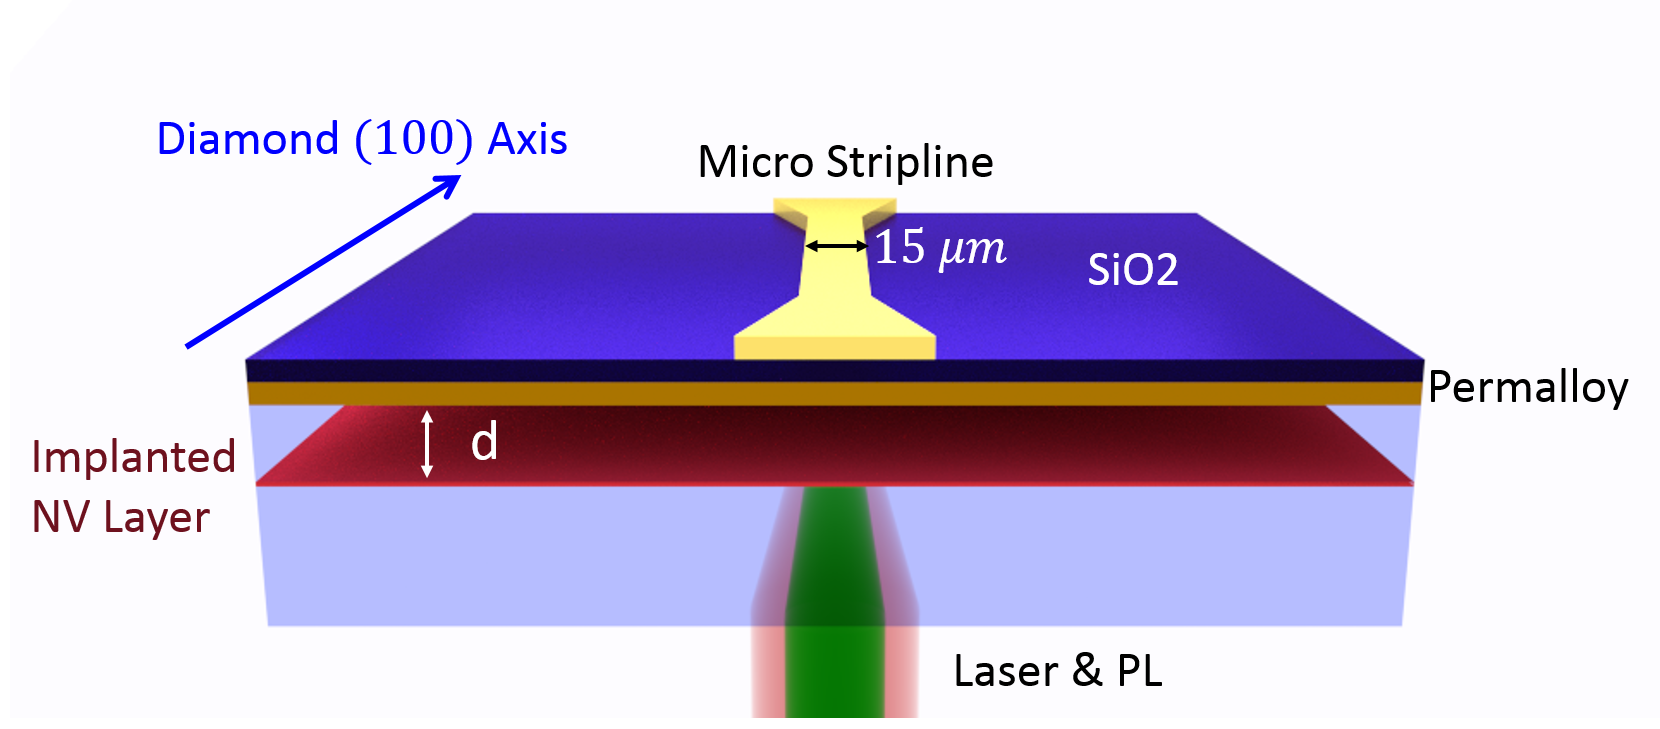
To unravel the origin of the ODFMR signals, we study its dependence on the controlled separation between the NV center spins and the surface of a continuous FM film under microwave drive. If a dipolar spinwave mechanism is relevant, then we expect that spinwaves with a wavevector on the order of will have the largest stray field at the NV center position. Fig. 1 presents a schematic of the sample and the geometry used for measurements presented in Figs. 2 and 3. The key elements are a single crystal diamond substrate with a layer of NV centers implanted a distance from the surface. There are also NV centers at a lower density throughout the volume of the diamond, but can be experimentally distinguished from the implanted NV centers, as discussed in the supplementary information (SI). We deposited Py on the diamond surface and then patterned an electrically isolated microstripline antenna to produce a microwave magnetic field, . To record ODFMR, we monitor the fluorescence from implanted NV centers as a function of the static magnetic field and the microwave frequency, , of . can be oriented in the plane of the Py film or along one of the NV center axes. In addition, we also record the microwave power reflected by the microstripline, , providing an alternative, spatially averaged measure of FMR. Additional details of each measurement are provided in the SI.
In Fig. 2(a)-(c), we show ODFMR measurements of Py films. The continuous wave (CW), normalized fluorescence change (FL) is measured using a lock-in amplifier that is referenced to amplitude modulation of . We recorded FL as a function of and for three single crystal (100) diamond substrates with = 25 nm, 50 nm, and 100 nm. Black circles overlaid on the 2D color plots show FMR peaks detected by . The features in FL appearing near GHz are the directly-driven ground-state resonances of the NV centers, marked with a guide-to-the-eye. With aligned in the plane of the sample along the 100 axes, the four orientations of NV center 111 symmetry axes are degenerate in this measurement set-up. The feature around 1.2 GHz-1.6 GHz and extending over the measured field range is due to the NV center excited-state spin resonances, which are broader than ground-state, and thus overlap (Fuchs et al., 2008). The ODFMR peaks due to the Py FMR appear most clearly in the low-field, low-frequency regime. Fig. 2(d) also shows that as increases, the intensity of the ODFMR signal also increases. Furthermore, the ODFMR signal is consistent with the direct measurement of , shown along the black points. However, as a subtle but intriguing point, the ODFMR peaks are centered at lower fields than the detected FMR peaks. This may merely be related to differences in the local and global FMR, since we probe NV centers at the narrowest point of the stripline, and thus they experience a larger than the majority of the FM. Alternatively, this may provide valuable clues as to the spectral efficiency of spinwave generation that produce ODFMR.

As discussed above, we hypothesize that ODFMR results from fluctuating dipolar fields due to spinwaves that decay from the driven, uniform FMR mode. Here we discuss the spinwave dispersion in relation to FMR frequency. Fig. 2(e) shows representative dispersions for the spin waves in Py for uniform mode FMR frequencies of 1 GHz, 1.5 GHz, and 2 GHz. The uniform mode can decay into spinwaves with frequencies and wavevectors that are allowed by this dispersion (Lukaszew, 2015). We use this dispersion to estimate the wavelength (see the SI for details), , of the spinwave whose frequency is resonant with the NV center spin transition for each frequency of the uniform mode FMR.
To summarize the importance of matching to , in Fig. 2(f) we present the measured ODFMR peak intensity from Fig. 2(d), re-plotted as a function of . This difference can be varied either through , by changing the uniform FMR resonance frequency (e.g. by changing the magnetic field), or through , by changing the NV center implantation depth. The blue points show the intensity at = 100 nm, but plotted versus using the spinwave dispersion to convert the horizontal coordinate. The correlation between and frequency is shown in the top axis. The red points are measured using a 1 GHz microwave drive, so = 302 nm for each of the three samples ( = 25 nm, 50 nm, 100 nm). The variation of the ODFMR signal obtained by these two methods shows the qualitative trend that we expect from our hypothesis: the signal decreases as the difference between and grows, regardless of the method by which is changed. Note that we have removed the data in the extremely low-field regime in which the film is in a multi-domain state. Additionally, we point out other effects that appear in the ODFMR signal. For example, the peak around 210 nm arises from the coincidence of the NV center excited-state resonance and the FMR frequency, while the dip around 230 nm is an artifact due to reduced arising from a standing wave resonance in our microwave circuit.
II II: Effect of FMR on NV center longitudinal spin-relaxation time and T1 spectroscopy
Fluctuating dipolar fields of spinwaves will enhance the NV spin relaxation rate (van der Sar et al., 2015). Here we present measurements that demonstrate a reduction of the NV center in response to excitation of FMR.
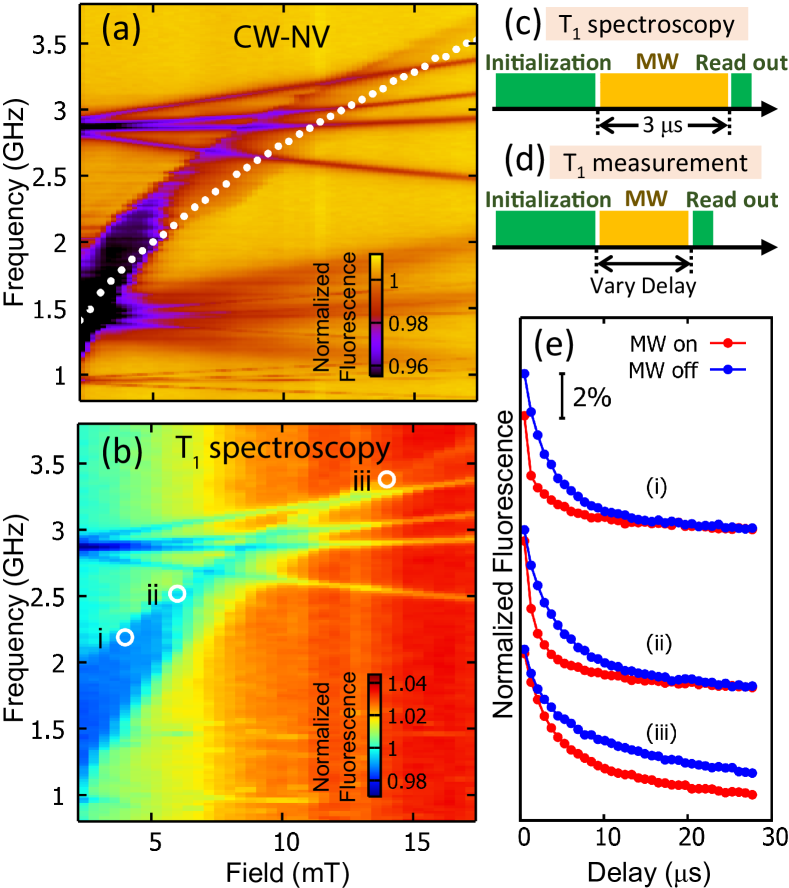
We expect that the fluorescence change in ODFMR can be interpreted as a change in the NV center spin populations as we drive FMR. By measuring the longitudinal spin-relaxation lifetime of the NV center ground spin state with and without FMR, we can quantify how driving FMR modifies the NV spin populations. Using the nm sample described above, we first characterize CW ODFMR in a different measurement set-up that is configured to measure the lifetimes of the NV centers, shown in Fig. 3. In this setup, is applied along one of the 111 NV center axes and the fluorescence is monitored using a single photon counter. For this field orientation the four NV center ground state branches are visible, in contrast to the two for in-plane field (Fig. 2). Next we perform a spectroscopy measurement using the pulse sequence shown in Fig. 3(c). The NV centers are first initialized in the spin state with a laser pulse, and following a fixed delay time of 3 s, we pulse the laser again for fluorescence readout. During the 3 s dark time, a microwave pulse is applied with the same power as in Fig. 3(a). We sweep the microwave frequency at fixed field, then repeat the spectroscopy measurement as a function of applied field, as shown in Fig. 3(b).
spectroscopy is an effective approach to quickly find the conditions in which changes. Two main features are displayed in Fig. 3(b). First, when the FMR occurs, we observe a significant reduction in the NV center . As in Fig. 3(a), the FMR signal is pronounced in the low field/frequency region. At high field/frequency where the FMR frequency exceeds the NV center resonance frequency, the FMR signal gradually diminishes. The second feature in Fig. 3(b) is that the background of spectroscopy increases with increasing field. The field dependent spectroscopy background is consistent with a separate measurement of vs. field without the microwave drive. The effect has been previously studied in an undriven Py/diamond system where it was attributed to relaxation by thermal fluctuations of the Py magnetization that produces wide spectrum spin noise (van der Sar et al., 2015). These measurements directly demonstrate that the ODFMR signal arises due to fluctuating dipolar fields generated by a driven ferromagnetic system that relax the ground-state NV center spins, without requiring participation of the NV center excited state.

To better quantify the change during FMR, we also directly measure with and without a microwave drive. We choose three points in Fig. 3(b) for measurement, as shown in Fig. 3 (e). When the FMR condition is met, a large reduction in is observed, in agreement with our spectroscopy results. For example, at 40 G (curve (i) in Fig. 3(e)) the measured s with no microwave applied. However, when a microwave of 2.19 GHz is applied to satisfy the FMR condition, s, which has reduced nearly by a factor of 2. Despite the fact that the FMR frequency is not resonant with the NV center spin resonances, the reduction during FMR suggests an incoherent coupling mechanism between NV centers and the nearby driven FM. This hypothesis pertains to the FL as a result of driving the uniform mode. Changes in the fluorescence of NV centers as a result of thermal equilibrium spin waves in a nearby Py disk in the undriven case have already been investigated (van der Sar et al., 2015).
III III: Demonstration of ODFMR in different ferromagnets and dependence of the signal on material properties
The spinwave dispersion is sensitive to saturation magnetization, , and exchange stiffness, , making this phenomenon sensitive to material-specific details of the FM. Here we describe differences in ODFMR as a function of material properties, and their relationship to our proposed mechanism.
The sample structure is shown in the inset of Fig. 4 and additional details can be found in the SI. FL collected from a nanodiamond film was measured using a lock-in amplifier and is presented in Fig. 4 as a function of in-plane and for four samples: a 30 nm YIG film on GGG from (Wolfe et al., 2014), a 20 nm Py film on Si, a 5 nm CMFG film on glass, and a 20 nm Co film on Si. The white dashed boxes highlight the frequencies, , above which the ODFMR signal decays for each material. This frequency is lowest for the Co ODFMR signal, with GHz, and it is larger for Py and CMFG which exhibit GHz, while the YIG ODFMR signal does not strongly decay in this frequency range. Note that the field scale in panel (b)-(d) is smaller than in (a). In Fig. 4(e) the calculated is plotted as a function of the FMR frequency for each material. The values of and in the various materials affect their spinwave dispersions, and hence the wavelengths of the spinwaves that are resonant with the NV center ground state spin transition. The horizontal black dashed lines indicate the value of that is expected based on the thickness of the nanodiamond films. When becomes larger than this limiting value of , we expect that the signal intensity will decay. The estimated decay frequencies are shown by the vertical dashed lines. We find that (Co) (Py) (CMFG) (YIG), which matches the experimental trend for the ODFMR cut-off frequency in each material.
IV IV: Conclusions and outlook
While our hypothesis qualitatively explains the results presented here and in the previous work (Wolfe et al., 2014), a more quantitative theory of the NV-FM coupling is still needed. Noise arising from the incoherent bath of spinwaves reduces the NV center spin lifetime as shown in Fig. 3. Thus measuring the spin lifetime of the NV centers on and off FMR as a function of is an important future step. The change of is related to the strength of the fluctuating dipolar fields generated by these spinwaves, which can be calculated theoretically and be quantitatively compared with our measurements. A more detailed theory will also include the spectral density of spinwaves generated by the decay of the uniform mode. An important aspect of this work is the possible avenues it highlights for experimentally characterizing damping processes in ferromagnets, such as magnon-magnon interactions, which are likely responsible for generating higher energy spinwaves from the uniform mode. Understanding this phenomenon could lead to a new method for deducing the rate at which spinwaves are generated by magnetization dynamics of ferromagnets, with a sensitivity that can be selected by controlling the separation between the NV centers and FM surface to match the desired properties of spinwave to be measured. Extending this idea to scanned-probe sensing in dynamical magnetic systems will offer a unique modality for nanoscale magnetic imaging.
In conclusion, we have demonstrated the optical detection of ferromagnetic resonance in a variety of ferromagnets using NV centers. We hypothesize that spinwaves generated by decay of the uniform mode that match the NV center resonance are responsible for altering the NV center spin lifetime, thus generating an ODFMR signal. Although our data qualitatively support this hypothesis, it requires further measurements of the NV spin lifetime and a detailed theoretical analysis.
We thank Dr. Sergei Manuilov for helpful discussion. Funding for this research at The Ohio State University was provided by the ARO through award number W911NF-12-1-0587 and the Center for Emergent Materials at the Ohio State University, an NSF MRSEC through award Number DMR-1420451. We acknowledge use of Ohio State Nanosystems Laboratory shared facilities. Research at Cornell is supported in part by the AFOSR (grant # FA9550-14-1-0243). We acknowledge use of the shared facilities of the Cornell Center for Materials Research under grant DMR-1120296.
References
- Bader and Parkin (2010) S. D. Bader and S. S. P. Parkin, Annual Review of Condensed Matter Physics 1, 71 (2010).
- Žutić et al. (2004) I. Žutić, J. Fabian, and S. Das Sarma, Reviews of Modern Physics 76, 323 (2004).
- Tserkovnyak et al. (2002) Y. Tserkovnyak, A. Brataas, and G. E. W. Bauer, Physical Review Letters 88, 117601 (2002).
- Slonczewski (1996) J. C. Slonczewski, Journal of Magnetism and Magnetic Materials 159, L1 (1996).
- Ralph and Stiles (2008) D. C. Ralph and M. D. Stiles, Journal of Magnetism and Magnetic Materials 320, 1190 (2008).
- Qiu et al. (2013) Z. Qiu, K. Ando, K. Uchida, Y. Kajiwara, R. Takahashi, H. Nakayama, T. An, Y. Fujikawa, and E. Saitoh, Applied Physics Letters 103, 092404 (2013).
- Adur et al. (2014) R. Adur, C. Du, H. Wang, S. A. Manuilov, V. P. Bhallamudi, C. Zhang, D. V. Pelekhov, F. Yang, and P. C. Hammel, Physical Review Letters 113, 176601 (2014).
- Adur et al. (2015) R. Adur, C. Du, J. Cardellino, N. Scozzaro, C. S. Wolfe, H. Wang, M. Herman, V. P. Bhallamudi, D. V. Pelekhov, F. Yang, and P. C. Hammel, Journal of Applied Physics 117, 172604 (2015).
- Vashkovskii et al. (1996) A. V. Vashkovskii, É. G. Lokk, and V. I. Shcheglov, Journal of Experimental and Theoretical Physics Letters 63, 572 (1996).
- Kajiwara et al. (2010) Y. Kajiwara, K. Harii, S. Takahashi, J. Ohe, K. Uchida, M. Mizuguchi, H. Umezawa, H. Kawai, K. Ando, K. Takanashi, S. Maekawa, and E. Saitoh, Nature 464, 262 (2010).
- Demokritov (2009) S. O. Demokritov, Spin Wave Confinement (Pan Stanford Publishing, 2009).
- Krivoruchko (2015) V. N. Krivoruchko, Low Temperature Physics 41, 670 (2015).
- Childress et al. (2008) J. R. Childress, M. J. Carey, S. Maat, N. Smith, R. E. Fontana, D. Druist, K. Carey, J. A. Katine, N. Robertson, T. D. Boone, M. Alex, J. Moore, and C. H. Tsang, IEEE Transactions on Magnetics 44, 90 (2008).
- Parkin et al. (1999) S. S. P. Parkin, K. P. Roche, M. G. Samant, P. M. Rice, R. B. Beyers, R. E. Scheuerlein, E. J. O’Sullivan, S. L. Brown, J. Bucchigano, D. W. Abraham, Y. Lu, M. Rooks, P. L. Trouilloud, R. A. Wanner, and W. J. Gallagher, Journal of Applied Physics 85, 5828 (1999).
- Ikeda et al. (2010) S. Ikeda, K. Miura, H. Yamamoto, K. Mizunuma, H. D. Gan, M. Endo, S. Kanai, J. Hayakawa, F. Matsukura, and H. Ohno, Nature Materials 9, 721 (2010).
- Parkin et al. (2008) S. S. P. Parkin, M. Hayashi, and L. Thomas, Science 320, 190 (2008).
- Nagaosa and Tokura (2013) N. Nagaosa and Y. Tokura, Nature Nanotechnology 8, 899 (2013).
- Tokunaga et al. (2015) Y. Tokunaga, X. Z. Yu, J. S. White, H. M. Rønnow, D. Morikawa, Y. Taguchi, and Y. Tokura, Nature Communications 6, 7638 (2015).
- Fert et al. (2013) A. Fert, V. Cros, and J. Sampaio, Nature Nanotechnology 8, 152 (2013).
- Schirhagl et al. (2014) R. Schirhagl, K. Chang, M. Loretz, and C. L. Degen, Annual Review of Physical Chemistry 65, 83 (2014).
- Balasubramanian et al. (2008) G. Balasubramanian, I. Y. Chan, R. Kolesov, M. Al-Hmoud, J. Tisler, C. Shin, C. Kim, A. Wojcik, P. R. Hemmer, A. Krueger, T. Hanke, A. Leitenstorfer, R. Bratschitsch, F. Jelezko, and J. Wrachtrup, Nature 455, 648 (2008).
- Maze et al. (2008) J. R. Maze, P. L. Stanwix, J. S. Hodges, S. Hong, J. M. Taylor, P. Cappellaro, L. Jiang, M. V. G. Dutt, E. Togan, A. S. Zibrov, A. Yacoby, R. L. Walsworth, and M. D. Lukin, Nature 455, 644 (2008).
- Tetienne et al. (2014) J.-P. Tetienne, T. Hingant, J.-V. Kim, L. H. Diez, J.-P. Adam, K. Garcia, J.-F. Roch, S. Rohart, A. Thiaville, D. Ravelosona, and V. Jacques, Science 344, 1366 (2014).
- van der Sar et al. (2015) T. van der Sar, F. Casola, R. Walsworth, and A. Yacoby, Nature Communications 6, 7886 (2015).
- Dussaux et al. (2015) A. Dussaux, P. Schoenherr, K. Chang, N. Kanazawa, Y. Tokura, C. L. Degen, and D. Meier, arXiv:1503.06622 [cond-mat] (2015).
- Taylor et al. (2008) J. M. Taylor, P. Cappellaro, L. Childress, L. Jiang, D. Budker, P. R. Hemmer, A. Yacoby, R. Walsworth, and M. D. Lukin, Nature Physics 4, 810 (2008).
- Wang et al. (2015) P. Wang, Z. Yuan, P. Huang, X. Rong, M. Wang, X. Xu, C. Duan, C. Ju, F. Shi, and J. Du, Nature Communications 6, 6631 (2015).
- Appel et al. (2015) P. Appel, M. Ganzhorn, E. Neu, and P. Maletinsky, New Journal of Physics 17, 112001 (2015).
- Wolfe et al. (2014) C. S. Wolfe, V. P. Bhallamudi, H. L. Wang, C. H. Du, S. Manuilov, R. M. Teeling-Smith, A. J. Berger, R. Adur, F. Y. Yang, and P. C. Hammel, Physical Review B 89, 180406 (2014).
- Wolfe et al. (2016) C. S. Wolfe, S. A. Manuilov, C. M. Purser, R. Teeling-Smith, C. Dubs, P. C. Hammel, and V. P. Bhallamudi, Applied Physics Letters 108, 232409 (2016).
- Schultheiss et al. (2012) H. Schultheiss, K. Vogt, and B. Hillebrands, Physical Review B 86, 054414 (2012).
- Page et al. (2016) M. R. Page, T. M. Nakatani, D. A. Stewart, B. R. York, J. C. Read, Y.-S. Choi, and J. R. Childress, Journal of Applied Physics 119, 153903 (2016).
- Fuchs et al. (2008) G. D. Fuchs, V. V. Dobrovitski, R. Hanson, A. Batra, C. D. Weis, T. Schenkel, and D. D. Awschalom, Physical Review Letters 101, 117601 (2008).
- Lukaszew (2015) R. A. Lukaszew, ed., Handbook of Nanomagnetism: Applications and Tools (2015).