Search for light scalar Dark Matter candidate with AURIGA detector
Abstract
A search for a new scalar field, called moduli, has been performed using the cryogenic resonant-mass AURIGA detector. Predicted by string theory, moduli may provide a significant contribution to the dark matter (DM) component of our universe. If this is the case, the interaction of ordinary matter with the local DM moduli, forming the Galaxy halo, will cause an oscillation of solid bodies with a frequency corresponding to the mass of moduli. In the sensitive band of AURIGA, some at around , the expected signal, with a , is a narrow peak, . Here the detector strain sensitivity is , within a factor of . These numbers translate to upper limits at on the moduli coupling to ordinary matter around masses , for the standard DM halo model with .
Introduction — A possible source of Dark Matter (DM) is an ultralight scalar field, , with couplings to Standard Model (ordinary) matter weaker than the gravitational strength. For instance, this field may be the moduli field, which is predicted by String Theory. The coupling of this light field with ordinary matter implies a dependence of the constants of nature on DMSound . In particular, electron mass, , and fine structure constant, , vary with respect to their nominal values following:
| (1) |
| (2) |
where is the Newton’s constant and () is the dimensionless coupling of moduli to electrons (photons): can be identified with an electron mass modulus if or an electromagnetic gauge modulus if . Given relations 1 and 2, if the field makes up a significant fraction of the local DM density, the volume of a solid will oscillate in time DMSound . In fact, assuming the mass of these particles, , to be small enough compared to the energy density of the DM, their number density within our Galaxy is high and the field can be described as a classical wave, instead of individual particles:
| (3) |
where is the relative velocity of DM with respect to Earth, roughly equal to the virial velocity in our Galaxy. Thus, the interaction of ordinary matter with the surrounding DM field would make and oscillate in time, causing a fluctuation of the atoms size, , in a solid. This would imply a variation of the length of a body, corresponding to a relative deformation with respect to its equilibrium length, , given by:
| (4) |
where is the Plank mass and the moduli field. To calculate the power spectrum of relative deformation , we use the so-called Standard Halo Model (SHM) that assumes a spherical DM halo for the Galaxy with local DM density , and an isotropic Maxwell-Boltzmann speed distribution DMHaloMod . In this framework, if moduli account for a significant fraction of DM in our Universe then the corresponding field can be described as a zero mean stochastic process with a Maxwell-Boltzmann power spectrum density ModuliModel , consequently the spectrum of the relative deformation is given by:
| (5) |
where is a constant, is the frequency corresponding to moduli with a given mass, and the mean squared velocity of the DM halo. Eq. 5 tells us that the signal strain is a monopole (isotropic strain) and approximately monochromatic.
In this work, we analyze the data of the resonant-mass gravitational wave detector AURIGA AURIGAdet , searching for the strain induced by an hypothetical moduli DM, expressed by eq. (5). AURIGA represents the state-of-art in the class of gravitational wave cryogenic resonant-mass detectors. It is located at INFN National Laboratory of Legnaro (Italy) and has been in continuous operation since year 2004. The detector is based on a , long bar made of low-loss aluminum alloy (Al5056), cooled to liquid helium temperatures. The fundamental longitudinal mode of the bar, sensitive to the moduli induced oscillation, has an effective mass and a resonance frequency . The bar resonator motion is detected by a displacement sensor with a sensitivity of order several over a bandwidth. The spectral noise floor in the relative deformation for the fundamental longitudinal mode, for the frequency interval of maximum sensitivity is given in fig. (2). This sensitivity is accomplished by a multimode resonant capacitive transducer Transd combined with a very low noise dc SQUID amplifier Squid (Fig. 1). In this scheme, the bar resonator is coupled to the fundamental flexural mode of a mushroom-shaped lighter resonator, with effective mass and the same resonance frequency. As the mechanical energy is transferred from the bar to the lighter resonator, the motion is magnified by a factor of roughly . A capacitive transducer, biased with a static electric field of , converts the differential motion between bar and mushroom resonator into an electrical current, which is finally detected by a low noise dc SQUID amplifier through a low-loss high-ratio superconducting transformer LCresonator . The transducer efficiency is further increased by placing the resonance frequency of the electrical LC circuit close to the mechanical resonance frequencies Transd , at . The detector can then be simply modeled as a system of three coupled resonators: its dynamics is described by three normal modes at separate frequencies, each one being a superposition of the bar and transducer mechanical resonators and the LC electrical resonator Modes .
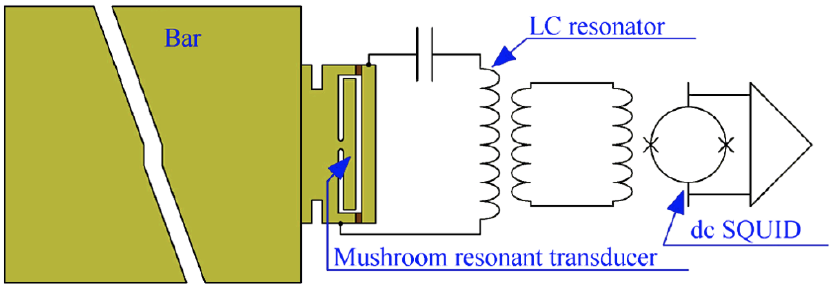
Analysis workflow and data-set — Output from the read-out chain of the AURIGA detector is digitized with a sampling frequency of through an ADC. As stated above, the motion of the bar from the equilibrium length is converted into an electrical signal. A calibration function obtained by a thorough mechanical characterization of the system Modes is then used to convert data from electrical potential difference to relative deformation of the AURIGA bar length. Eq. (5) shows that the relative deformation induced by a signal moduli, would be a sharp resonance around the frequency corresponding to the moduli mass. Therefore, a possible signal could be spotted by analyzing the noise power spectrum of the calibrated AURIGA output . gives the information concerning the relative deformation of the bar:
| (6) |
The expected signal (5) has a bandwidth of about in the sensitive band of AURIGA. Therefore, we split the analyzed dataset into one hour long data streams and perform power spectrum computation on each stream to achieve the proper spectrum resolution. Computed power spectrums are averaged to reduce the noise standard deviation and achieve a better sensitivity. If is the number of averaged power spectrums, the variance of the noise is ProakisManolakis , and the corresponding standard deviation on decreases with the number of averages as . Thus, a good sensitivity on the moduli signal is already achieved with few weeks of data. Using the entire dataset acquired by AURIGA ( years) would improve the sensitivity just by a factor of 3. So that, for this analysis we focused on a dataset corresponding to data acquired during August 2015. AURIGA detector has been running in stable conditions during this period: stability of the detector is inferred by the stable frequencies and shape of the three main detector’s modes, checked by studying the evolution of the detector power spectrum on the analyzed dataset. Spikes in time due to energetic background events could hide a possible signal from moduli and must be removed from the dataset: for each data stream in the time domain the rms is computed, obtaining a distribution of the rms value for the whole dataset; data affected by energetic background lie in the high value tail of the distribution. A cut on the rms is then set to discard data with large rms values. This cut still allows to maintain a duty-cicle of the detector.
After cleaning data streams with rms cut, they are windowed in time domain using a Hann window type, which allows a good frequency resolution and reduced spectral leakage. The measured bar relative deformation spectrum is shown in fig. (2).
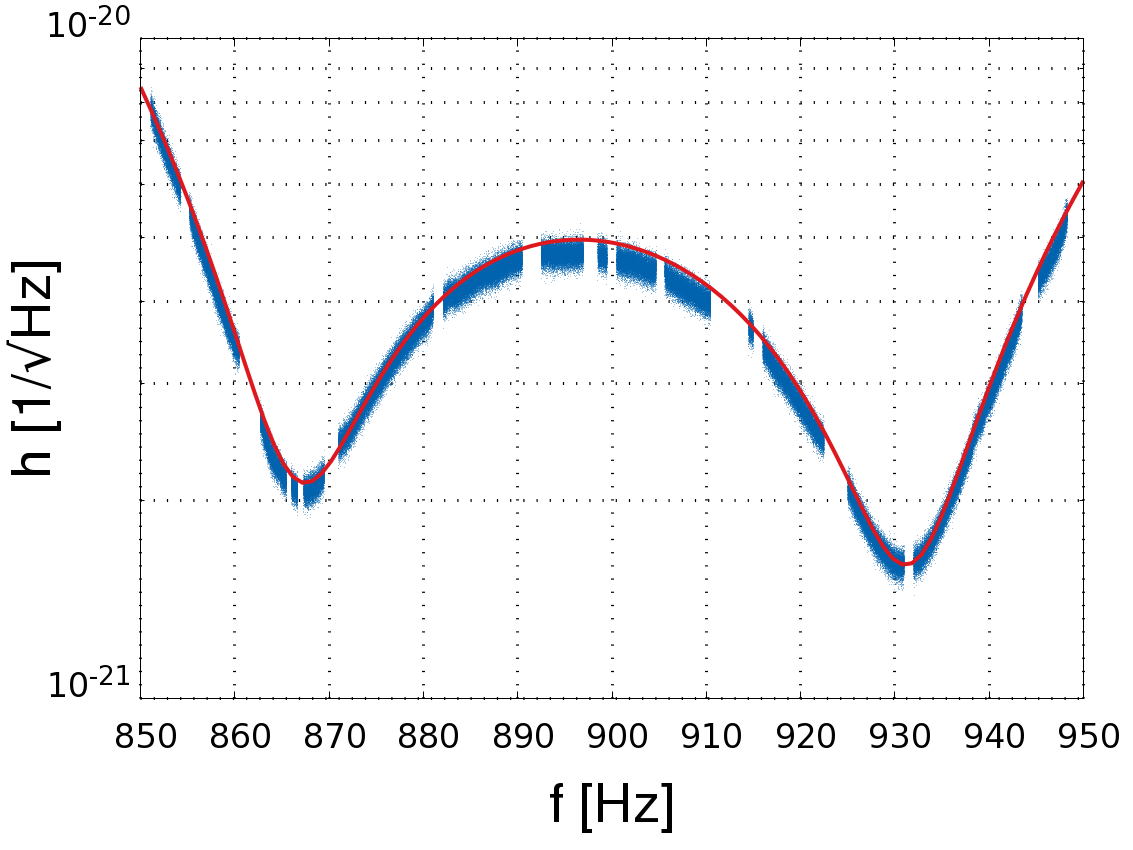
As shown by the figure, the measured noise is in excellent agreement with the predicted noise behaviour. The latter has been obtained out of the sum of computed contributions from each noise source, in turn derived by measured experimental parameters Modes . Few spurious peaks, known to be associated to external background sources, have been excluded from the analysis.
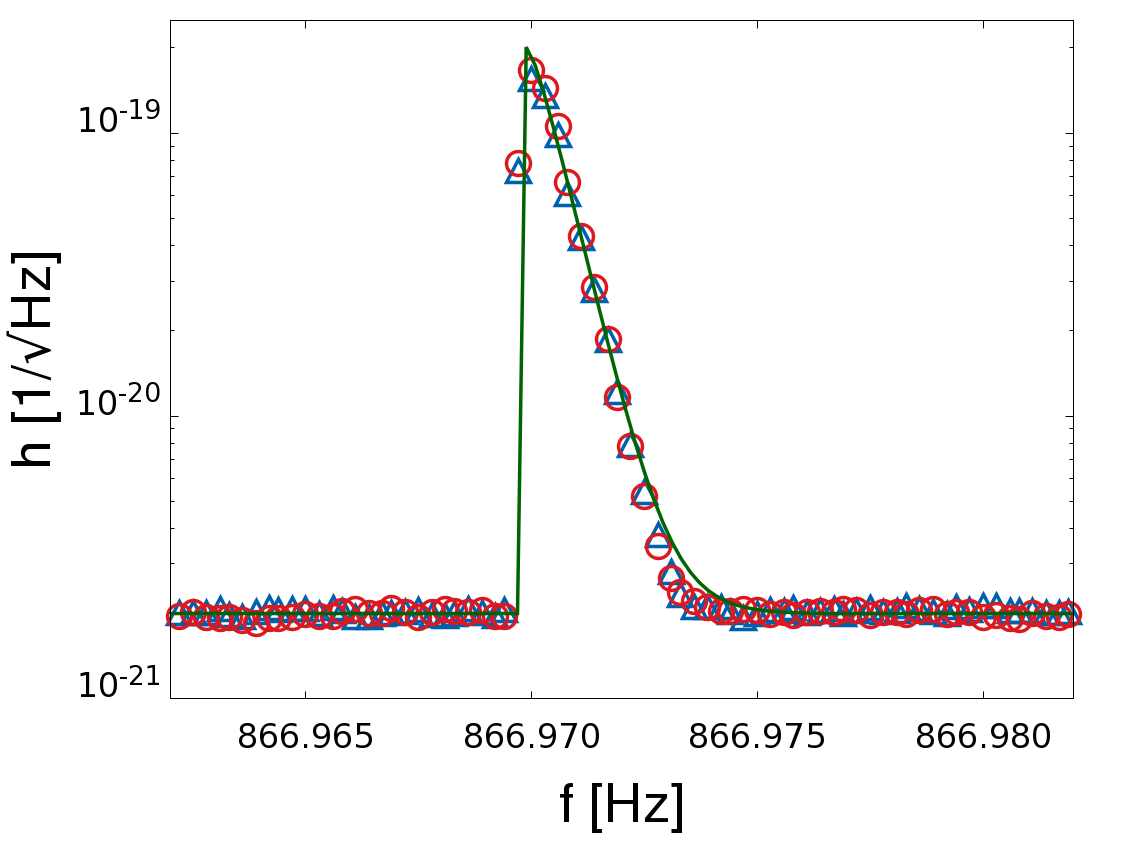
Simulation — To prove we are able to detect this signal with AURIGA, a simulation has been performed to study the actual signal bandwidth within the detector sensitive region and to fine-tune the analysis workflow. Eq. (5) is exploited to simulate a signal with and coupling , which is smaller than the natural values expected for DMSound . lies close to the first minimum of the AURIGA noise curve, shown in fig. (2). Given the narrow bandwidth of this signal, we assumed the noise to be white, , around the signal peak, with a standard deviation , equal to the noise level at (see fig. 2). We have generated an amount of data comparable to the real dataset and applied our analysis pipeline obtaining the result shown in fig. (2). The spectrum of the simulated signal is spread around bins of the spectrum as shown in fig. (3 - blue-triangles). The simulated data have been injected into the real dataset and in fig. (3 - red-circles) we show that the injected signal is well reconstructed at the frequency and it is not removed by the rms cut applied to the data streams. We also show the theoretical signal plus noise, fig. (3 - green-line), obtained using same parameters as for the simulation. The little discrepancy between theory and simulation (injection), can be attributed to the minimal leakage due to the windowing of data.
Statistical analysis — The procedure followed for the statistical analysis of the result shown in fig. (2) is the one proposed by Feldman and Cousin upperlFC . Each bin of the distribution in fig. (2) has a contribution from the noise and a possible contribution from the signal. The squared value of a bin is the result of averaging power spectrums, then its distribution follows a non-central with degree of freedom. Since in our case the squared bin distribution can be approximated by the following gaussian:
| (7) |
with normalization factor:
| (8) |
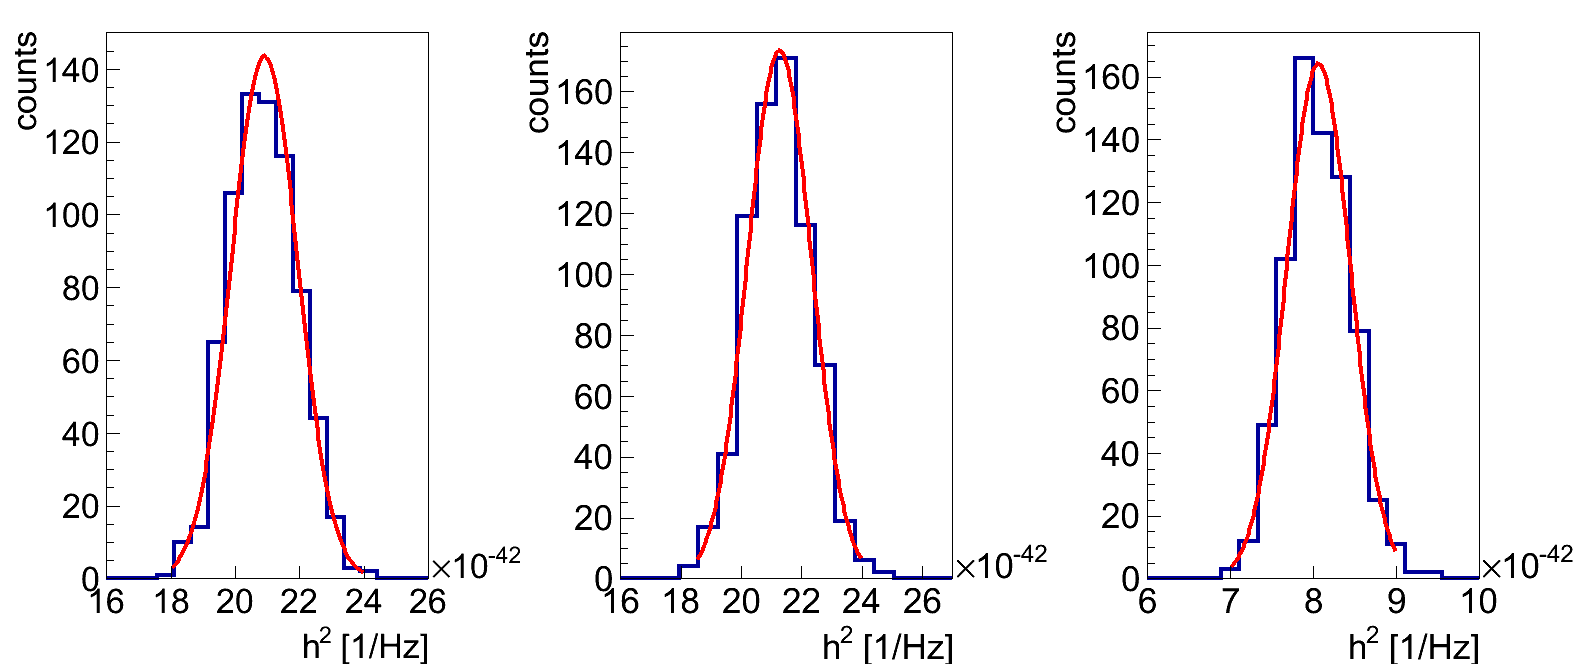
where is the squared bin content, is the expected noise level and the signal strength. The statistical behavior of the bins in distribution of fig. (2) is confirmed by data as predicted by eq. (7). This is shown in fig. (4). By means of eq. (7) we build the confidence belt in the parameter space , delimited by the values such that:
| (9) |
for each value of the signal strength and a confidence level . The contributions to the integral in eq. (9) are ordered following a specific ordering function, as reported in upperlFC , in order to avoid problems on the parameter estimation near the physical bounds of such parameters. Eq. (9) states that for a fixed hypothetical signal strength , the observed value of the bin content falls within the interval with a probability equal to . Thus, for each measured value of the upper and lower limits on the measured signal strength, containing the true value with a probability, is obtained by inversion of the constructed confidence belt. We set a threshold, , corresponding to a maximum false alarm probability of finding a signal, which is not actually there, equal to standard deviations away from the background only hypothesis. For observed values of below we set an upper limit on the signal strain. Values above the threshold would correspond to an observed signal. Since in our measurement in fig. (2) we do not observe values exceeding the threshold, we set upper limits on at confidence level. Interpreting these upper limits as given by moduli through eq. (5), we convert these values in upper limits on the moduli coupling to ordinary matter. To improve the upper limits, we exploited the noise curve obtained adding the thermal noise prediction from Fluctuation-Dissipation theorem and the noise contribution from the SQUID. By performing a least squares fit of data in fig. (2), we obtained the upper limits at from the distribution. This allows to get better upper limits by taking into account a more precise estimation of errors from the fit. Further improvement is obtained by averaging bins in groups of for data in fig. (2), since the signal would be distributed around bins, as shown by fig. (3).
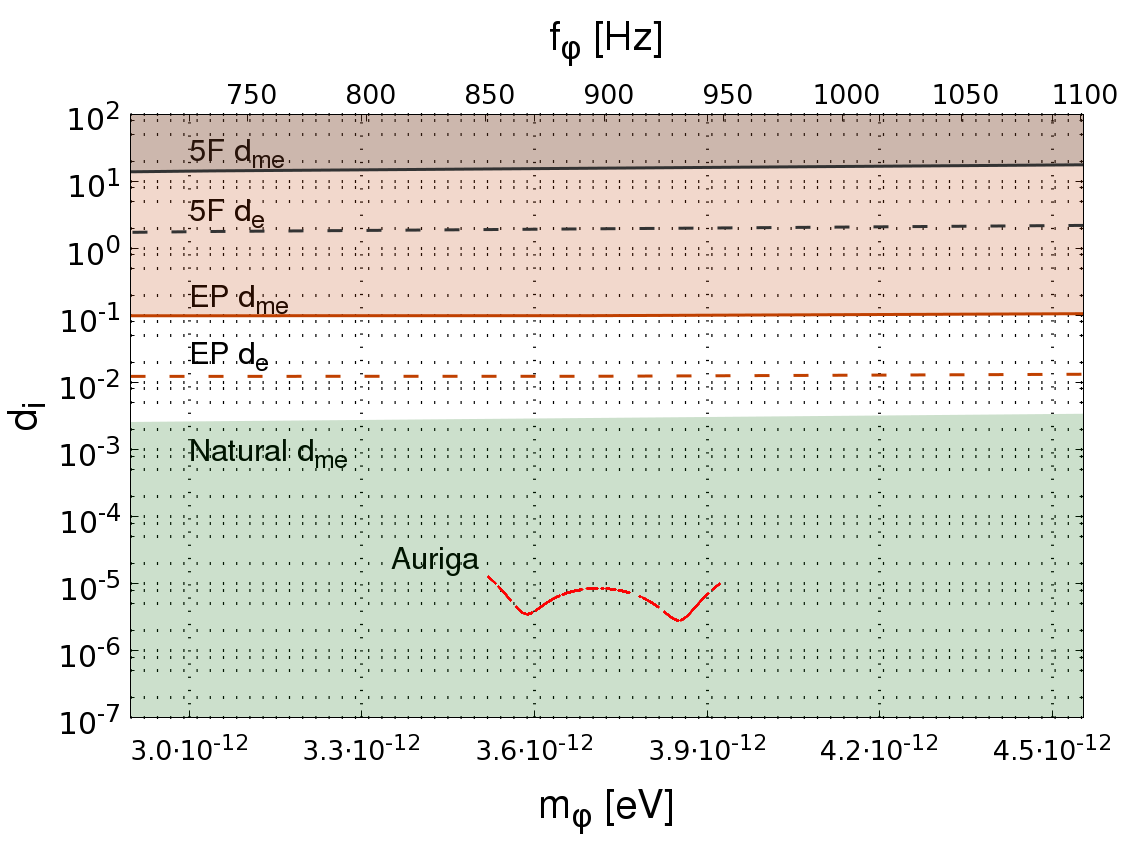
Results — Final upper limits are reported in fig. (5). The upper limits set on the moduli coupling to ordinary matter are better then in the sensitive band of AURIGA, , and explore an interesting physical region of the parameter space, within the natural parameter space for moduli DMSound . With this result we prove that AURIGA, a gravitational wave resonant detector, would be capable to detect light DM candidates with an interesting sensitivity within its bandwidth. We point out that this level of sensitivity can be achieved only by resonant mass detectors, and not by modern laser interferometers developed for gravitational wave detection, such as LIGO LIGO and Virgo VIRGO , even if these have better sensitivity than resonant mass detectors for gravitational waves and recently observed the first event due to a gravitational wave signal GWDiscovery . In fact, because of the monopole nature of the expected moduli strain, we do not expect an interference signal as output from the interferometer due to moduli. Instead, since ultralight scalars can mediate Yukawa forces between objects, one can explore which is the expected effect on the relative position between mirrors within an interferometer arm DMClocks . The moduli signal could be measured as a difference in the travel time between the mirrors. It turns out that the sensitivity is masked by detector noise, therefore resulting in a lower searching power with respect to resonant mass detectors.
Acknowledgements.
MC is very grateful to Asimina Arvanitaki for calling attention to the matter and for initial discussions. AB, MC, AO, and LT thank Asimina Arvanitaki and Ken Van Tilburg for enlightening discussions and for a critical reading of the manuscript.References
- (1) A. Arvanitaki, S. Dimopoulos, K. V. Tilburg, Sound of Dark Matter: Searching for Light Scalars with Resonant-Mass Detectors, Phys. Rev. Lett. 116, 031102 (2016).
- (2) J. D. Lewin and P. F. Smith, Review of mathematics, numerical factors, and corrections for dark matter experiments based on elastic nuclear recoil, Astropart. Phys. 6 (1996) 87.
- (3) L. Krauss, J. Moody, F. Wilczek, D. E. Morris, Calculations for cosmic axion detection, Phys. Rev. Lett. 55, 1797 (1985).
- (4) M. Cerdonio, M. Bonaldi, D. Carlesso et al, The ultracryogenic gravitational-wave detector AURIGA, Class. Quantum Grav., 14 (1997) 1491;
- (5) L. Baggio et al., 3-Mode Detection for Widening the Bandwidth of Resonant Gravitational Wave Detectors, Phys. Rev. Lett. 94, 241101 (2005).
- (6) A. Vinante et al., Dc superconducting quantum interference device amplifier for gravitational wave detectors with a true noise temperature of 16µ K, Appl. Phys. Lett. 79, 2597 (2001).
- (7) M. Bonaldi, P. Falferi, R. Dolesi et al, High Q tunable LC resonator operating at cryogenic temperature, Review of Scientific Instruments 69 (1998) 3690;
- (8) A. Vinante, Present performance and future upgrades of the AURIGA capacitive readout, Classical Quantum Gravity 23, S103 (2006).
- (9) D. G. Manolakis, J. G. Proakis, Digital Signal Processing: principles, algorithms and applications, 3rd ed. (Upper Saddle River: Prentice-Hall, c1996), Chap. 12, p. 908.
- (10) G. J. Feldman, R. D. Cousin, A Unied Approach to the Classical Statistical Analysis of Small Signals, Phys. Rev. D 57, 3873-38891 (1998).
- (11) LIGO Scientific Collaboration, Advanced LIGO, Class. Quantum Grav., 32 (2015) 074001.
- (12) Virgo Collaboration, Advanced Virgo: a second-generation interferometric gravitational wave detector, Class. Quantum Grav., 32 (2014) 024001.
- (13) LIGO Scientific Collaboration and Virgo Collaboration, Observation of Gravitational Waves from a Binary Black Hole Merger, Phys. Rev. Lett. 116, 061102 (2016).
- (14) A. Arvanitaki, J. Huang, K. V. Tilburg, Searching for dilaton dark matter with atomic clocks, Phys. Rev. D 91, 015015 (2015).