Optical Spectroscopy of Four Young Radio Sources
Abstract
We report the optical spectroscopy of four young radio sources which are observed with the Lijiang 2.4m telescope. The Eddington ratios of these sources are similar with those of narrow-line Seyfert 1 galaxies (NLS1s). Their Fe ii emission is strong while [O iii] strength is weak. These results confirm the NLS1 features of young radio sources, except that the width of broad H of young radio sources is larger than that of NLS1s. We thus suggest that the young radio sources are the high black hole mass counterparts of steep-spectrum radio-loud NLS1s. In addition, the broad H component of 4C 12.50 is the blue wing of the narrow component, but not from the broad line region.
keywords:
galaxies: jets — quasars: emission lines — quasars: individual (GB6 J0140+4024, TXS 0942+355, IRAS 11119+3257, 4C 12.50)1 Introduction
The young radio sources, including compact steep spectrum (CSS) and gigahertz peaked spectrum (GPS) radio sources, are believed to represent the earliest stages in the evolution of the powerful radio galaxies (O’Dea, 1998). Some of them are found to be associated with galaxies mergers (Gilmore & Shaw, 1986) or ultraluminous infrared galaxies (ULIRGs) (Holt et al., 2011; Norris et al., 2012). Recent observations also manifest that some radio-loud narrow-line Seyfert 1 galaxies/quasars (NLS1s) have the radio properties consistent with CSS radio sources (Gu & Chen, 2010; Caccianiga et al., 2014; Liao et al., 2015). NLS1s are classified based on their narrow Balmer lines (with the full width at half maximum, FWHM ), small ratio between [O iii]5007 and H ([O iii]5007/H 3) and strong emission of Fe ii complexes (Fe ii 4570/H 0.5, Osterbrock & Pogge 1985; Véron-Cetty et al. 2001). These features are explained as a result of relatively small mass of the central black hole with high accretion rate (Boroson 2002; Xu et al. 2012 , but also see Decarli et al. 2008). Thus NLS1s are suggested to be during the early stage of the accretion activities.
The accretion rates of young radio sources are found to be relatively high, with the average value similar with NLS1s (Wu, 2009; Fan & Bai, 2016). Thus the young radio sources can also stand during the early stage of accretion activities. Moreover, there is another similar feature between the young radio sources and NLS1s. That is the blue wing of narrow [O iii] (Bian et al., 2005; Holt et al., 2008; Wu, 2009; Holt et al., 2009). This feature is always explained as the outflow originated from the disk wind or galactic wind. Some results indicate that the strength of the blueshift is related to the Eddington ratio (Komossa et al., 2008), while other explanations refer to the jet - ISM interaction (Holt et al., 2008).
Although the common radio properties between NLS1s and young radio sources have been discussed frequently in the literature, the common optical properties between them are less discussed. In this paper, we obtain the optical spectra of four young radio sources, and explore their emission lines properties. Throughout this paper, the luminosity is calculated using a CDM cosmology model with h=0.71, =0.27, =0.73.
2 Observations and Data Reduction
The spectra were obtained between 2014 and 2015, with the Yunnan Faint Object Spectrograph and Camera (YFOSC) on the Lijiang 2.4m telescope in Yunnan Observatories. The YFOSC is equipped with a back-illuminated, blue sensitive CCD with 2048 4608 pixels, which works in both imaging and spectroscopy modes. Each pixel of the YFOSC corresponds to the sky angle . The spectra were taken with two gratings, G8 and G3. The dispersions of G8 and G3 are 1.5 and 2.9 , respectively. The wavelength coverage is about 4970 - 9830 Å and 3200 - 9200 Å for G8 and G3, respectively. The details of observations are listed in Table 1.
| Source Name | Date | Exp. (s) | slit (′′) | Grim | Range (Å) | Res. (Å) |
|---|---|---|---|---|---|---|
| GB6 J0140+4024 | 2014/11/25 | 2400 | 1.8 | G3 | 4264 - 8603 | 16 |
| TXS 0942+355 | 2015/03/13 | 3000 | 2.5 | G3 | 3892 - 9110 | 20 |
| IRAS 11119+3257 | 2015/03/16 | 3000 | 2.5 | G3 | 4156 - 9109 | 20 |
| 4C 12.50 | 2014/05/30 | 2400 | 1.8 | G8 | 5182 - 9518 | 8 |
The spectra are reduced with the standard IRAF routines, including the bias substraction, flat field corrections and the removal of cosmic rays. Wavelength calibration is performed with the neon and helium lamps. The spectra are flux calibrated with the spectrophotometric flux of standard stars observed at a similar air mass on the same night. The spectral resolution is estimated using the FWHM of the sky emission lines (Table 1). The four reduced 1-d spectra are plotted in Figure 1.

3 Results on Individual Objects
The galactic extinction is firstly corrected using the dust map from Schlegel et al. (1998) and the extinction curve from Cardelli et al. (1989) with = 3.1. Then we fit the four spectra in the rest frame. The pseudo-continuum are decomposed with a power-law AGN continuum, a host galaxy component (for the optical band in the rest frame), and a Fe ii template. The fitting algorithm is followed Hu et al. (Hu et al., 2015) (also see Hu et al. 2012; Wang et al. 2009; Shen et al. 2011). The emission lines are fitted with Gaussian profiles or Gauss - Hermite function. Throughout this paper, we just focus on the H and Mg ii region. The H and Mg ii are treated as a broad component plus a narrow one. If one single Gaussian can not fit the broad component well, we model it with a Gauss - Hermite function (for IRAS 11119+3257). Each of [O iii] doublet is fitted with one Gaussian. For 4C 12.50, two Gaussian profiles are performed to model the unusual [O iii]. Then the fitted FWHM is corrected for the instrumental broaden listed in Table 1. The strength of optical Fe ii is represented by Fe ii 4570 (integrated between 4434 and 4684). The ultraviolet (UV) Fe ii is integrated in the range 2200 - 3090 Å. The details of each sources are discussed below.
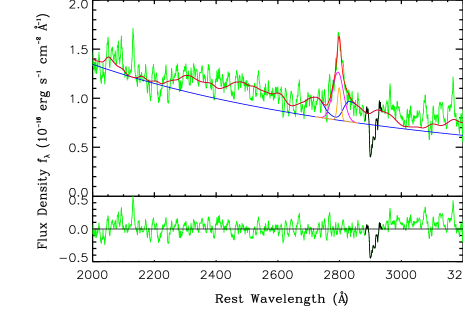
GB6 J0140+4024. This source encounter a low signal/noise ratio (S/N). However, the Mg ii and C iii lines are prominent (upper left panel in Figure 1). The spectrum in rest frame which is corrected the Galactic extinction around Mg ii is plotted in Figure 2, along with the modeled components. The flux and FWHM of the broad Mg ii are and , respectively. The flux of Fe ii is .
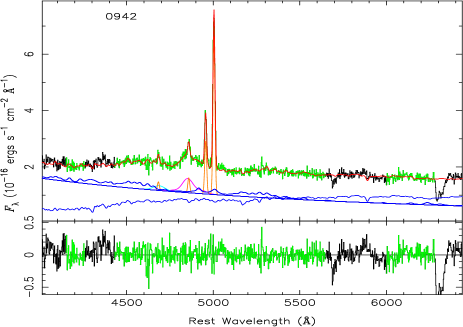
TXS 0942+355. Kunert-Bajraszewska et al. (2010) labelled this sources as a low-luminosity CSS source. Kunert-Bajraszewska & Labiano (2010) noted that the optical image showed weak extended emission. The optical spectrum manifests a large contribution of host galaxy component (Figure 3). We obtain the flux and FWHM of the broad H which are and , respectively. The [O iii]5007/H and Fe ii/H (the so called R4570 parameter) are 1.59 and 0.8, respectively.
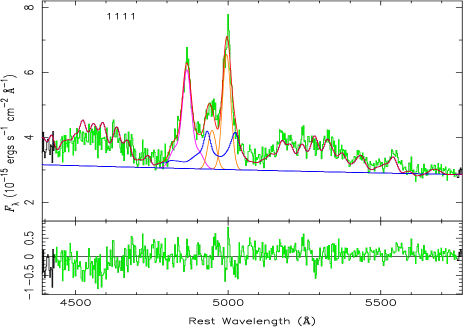
IRAS 11119+3257. This is a famous ULIRG with high velocity outflows observed at optical and X-ray band (Lípari et al., 2003; Tombesi et al., 2015). Komossa et al. (2006) labelled this sources as a radio-loud NLS1 and presented that its radio feature was compact and steep spectrum. The optical spectrum of IRAS 11119+3257 show large intrinsic extinction (Zheng et al., 2002). Thus a intrinsic extinction mag is corrected to make the Balmer decrement close to 3.1 (Dong et al., 2008). The peak of [O iii] has a blueshift about 700 km s-1 relative to the peak of H. The H can be well fitted with a Gauss - Hermite function. Thus we treat total H as a broad component, while the narrow component of H is too weak to model 111Two Gaussian profiles are also used to model H. The central wavelengths of the two Gaussians also have systematic offsets with that of [O iii]. (Figure 4). The FWHM of broad H is , which is slightly larger than listed in Zheng et al. (2002). The flux of broad H is . The [O iii]5007/H and Fe ii/H are 0.80 and 1.58, respectively.
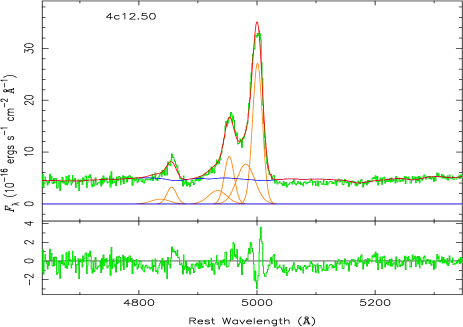
4C 12.50. 4C 12.50 (PKS 1345+12) is hosted in a major merger system which is still ongoing (Gilmore & Shaw, 1986). The GPS nuclei was classified as a narrow line radio galaxy (NLRG) by Grandi (1977). However, it has very broad [O iii] lines. The broad [O iii] can be fitted by two Gaussian profiles (Figure 5). Recent analysis of its SDSS spectrum showed a broad H component (Son et al., 2012). Our results show that the broad H has the same blueshift (about 1549 km s-1) with the blueshifted [O iii] doublet. And its FWHM (2130 km s-1) is also consistent with the blue wing of [O iii]. Thus the detected broad H corresponds to the blue shifted narrow line component, but not originates from broad line region (BLR).
4 Discussion
We estimate the black hole mass of three type 1 sources. The calculations for H follow the relation of single epoch reverberation mapping in Vestergaard & Peterson (2006),
| (1) |
For Mg ii, we use the relation in Wang et al. (2009),
| (2) |
Then we estimate the Eddington ratio (Kaspi et al., 2000). The results are listed in Table 2.
| Source Name | redshift | () | Log | |
|---|---|---|---|---|
| GB6 J0140+4024 | 1.62 | 8.88 | 0.23 | |
| TXS 0942+355 | 0.208 | 7.66 | 0.10 | |
| IRAS 11119+3257 | 0.189 | 7.63 | 2.45 | |
| 4C 12.50 | 0.122 | — | 7.82 | 0.27 |
The estimated average values of Eddiongton ratios for NLS1s are from 0.15 (Bian et al., 2008) to 0.79 (Xu et al., 2012), while the broad line Seyfert 1 galaxies (BLS1) have the average value about 0.16 (Xu et al., 2012). The Eddington ratios of four young radio sources are generally larger than BLS1 and distributes in the range of NLS1s.
The three type 1 sources all show strong Fe ii emissions, and [O iii] emission is weak for TXS 0942+355 and IRAS 11119+3257. These features confirm that the emission lines properties of young radio sources are similar with NLS1s, except that the line width of young radio sources is broader than that of NLS1s. The estimated black hole mass is also larger than the average value of NLS1s (Xu et al., 2012). Meanwhile, the radio powers of the compact steep-spectrum NLS1s are at the low end of that of young radio sources (Gu & Chen, 2010; Caccianiga et al., 2014; Liao et al., 2015), but locate in the range of the low-luminosity compact radio sources (, Kunert-Bajraszewska et al. 2010). Therefore, we suggest the young radio sources are the high mass counterparts of the steep-spectrum radio-loud NLS1s.
The blue wing of [O iii] is a prominent feature in NLS1s (Bian et al., 2005; Komossa et al., 2008). Among the four sources, the blue wings of [O iii] are presented in IRAS 11119+3257 and 4C 12.50. Both sources are ULIRGs, and with relatively high Eddiongton ratio, which links the outflow mechanism to high star formation rate or high accretion rate.
5 Acknowledgments
We acknowledge the support of the staff of the Lijiang 2.4m telescope. Funding for the telescope has been provided by CAS and the People’s Government of Yunnan Province. This research is supported by the Strategic Priority Research Program of the Chinese Academy of Sciences - The Emergence of Cosmological Structures (grant No. XDB09000000), the Key Research Program of the Chinese Academy of Sciences (grant No. KJZD-EW-M06), and the NSFC through NSFC-11133006 and 11361140347.
References
- Bian et al. (2005) Bian, W., Yuan, Q., & Zhao, Y. 2005, \mnras, 364, 187
- Bian et al. (2008) Bian, W.-H., Hu, C., Gu, Q.-S., & Wang, J.-M. 2008, \mnras, 390, 752
- Boroson (2002) Boroson, T. A. 2002, \apj, 565, 78
- Caccianiga et al. (2014) Caccianiga, A., Antón, S., Ballo, L., et al. 2014, \mnras, 441, 172
- Cardelli et al. (1989) Cardelli, J. A., Clayton, G. C., & Mathis, J. S. 1989, \apj, 345, 245
- Dasyra et al. (2006) Dasyra, K. M., Tacconi, L. J., Davies, R. I., et al. 2006, \apj, 638, 745
- Decarli et al. (2008) Decarli, R., Dotti, M., Fontana, M., & Haardt, F. 2008, \mnras, 386, L15
- Dong et al. (2008) Dong, X., Wang, T., Wang, J., et al. 2008, \mnras, 383, 581
- Fan & Bai (2016) Fan, X.-L., & Bai, J.-M. 2016, \apj, 818, 185
- Gilmore & Shaw (1986) Gilmore, G., & Shaw, M. A. 1986, \nat, 321, 750
- Grandi (1977) Grandi, S. A. 1977, \apj, 215, 446
- Gu & Chen (2010) Gu, M., & Chen, Y. 2010, \aj, 139, 2612
- Holt et al. (2008) Holt, J., Tadhunter, C. N., & Morganti, R. 2008, \mnras, 387, 639
- Holt et al. (2009) —. 2009, \mnras, 400, 589
- Holt et al. (2011) Holt, J., Tadhunter, C. N., Morganti, R., & Emonts, B. H. C. 2011, \mnras, 410, 1527
- Hu et al. (2012) Hu, C., Wang, J.-M., Ho, L. C., et al. 2012, \apj, 760, 126
- Hu et al. (2015) Hu, C., Du, P., Lu, K.-X., et al. 2015, \apj, 804, 138
- Kaspi et al. (2000) Kaspi, S., Smith, P. S., Netzer, H., et al. 2000, \apj, 533, 631
- Komossa et al. (2006) Komossa, S., Voges, W., Xu, D., et al. 2006, \aj, 132, 531
- Komossa et al. (2008) Komossa, S., Xu, D., Zhou, H., Storchi-Bergmann, T., & Binette, L. 2008, \apj, 680, 926
- Kunert-Bajraszewska et al. (2010) Kunert-Bajraszewska, M., Gawroński, M. P., Labiano, A., & Siemiginowska, A. 2010, \mnras, 408, 2261
- Kunert-Bajraszewska & Labiano (2010) Kunert-Bajraszewska, M., & Labiano, A. 2010, \mnras, 408, 2279
- Liao et al. (2015) Liao, N.-H., Liang, Y.-F., Weng, S.-S., Gu, M.-F., & Fan, Y.-Z. 2015, ArXiv e-prints, arXiv:1510.05584
- Lípari et al. (2003) Lípari, S., Terlevich, R., Díaz, R. J., et al. 2003, \mnras, 340, 289
- Norris et al. (2012) Norris, R. P., Lenc, E., Roy, A. L., & Spoon, H. 2012, \mnras, 422, 1453
- O’Dea (1998) O’Dea, C. P. 1998, \pasp, 110, 493
- Osterbrock & Pogge (1985) Osterbrock, D. E., & Pogge, R. W. 1985, \apj, 297, 166
- Schlegel et al. (1998) Schlegel, D. J., Finkbeiner, D. P., & Davis, M. 1998, \apj, 500, 525
- Shen et al. (2011) Shen, Y., Richards, G. T., Strauss, M. A., et al. 2011, ApJS, 194, 45
- Son et al. (2012) Son, D., Woo, J.-H., Kim, S. C., et al. 2012, \apj, 757, 140
- Tombesi et al. (2015) Tombesi, F., Meléndez, M., Veilleux, S., et al. 2015, \nat, 519, 436
- Véron-Cetty et al. (2001) Véron-Cetty, M.-P., Véron, P., & Gonçalves, A. C. 2001, \aap, 372, 730
- Vestergaard & Peterson (2006) Vestergaard, M., & Peterson, B. M. 2006, \apj, 641, 689
- Wang et al. (2009) Wang, J.-G., Dong, X.-B., Wang, T.-G., et al. 2009, \apj, 707, 1334
- Wu (2009) Wu, Q. 2009, \mnras, 398, 1905
- Xu et al. (2012) Xu, D., Komossa, S., Zhou, H., et al. 2012, \aj, 143, 83
- Zheng et al. (2002) Zheng, X. Z., Xia, X. Y., Mao, S., Wu, H., & Deng, Z. G. 2002, \aj, 124, 18