New Constraints on the Molecular Gas in the Prototypical HyLIRGs BRI1202–0725 & BRI1335–0417
We present Karl G Jansky Very Large Array (VLA) observations of CO() line emission and rest-frame 250 GHz continuum emission of the Hyper-Luminous IR Galaxies (HyLIRGs) BRI1202-–0725 () and BRI1335–-0417 (), with an angular resolution as high as 0.15′′. Our low order CO observations delineate the cool molecular gas, the fuel for star formation in the systems, in unprecedented detail. For BRI1202–0725, line emission is seen from both extreme starburst galaxies: the quasar host and the optically obscured submm galaxy (SMG), in addition to one of the Ly emitting galaxies in the group. Line emission from the SMG shows an east-west extension of about . For Ly-2, the CO emission is detected at the same velocity as [CII] and [NII], indicating a total gas mass M⊙. The CO emission from BRI1335–0417 peaks at the nominal quasar position, with a prominent northern extension (, a possible tidal feature). The gas depletion timescales are years for the three HyLIRGs, consistent with extreme starbursts, while that of Ly-2 may be consistent with main sequence galaxies. We interpret these sources as major star formation episodes in the formation of massive galaxies and supermassive black holes (SMBHs) via gas rich mergers in the early Universe.
1 Introduction
It is well established that massive galaxies form most of their stars at early times, and the more massive, the earlier (e.g., Renzini 2006; Shapley 2011). Hyper-luminous infrared galaxies (HyLIRGs), or galaxies with Lm L⊙ (Sanders & Mirabel, 1996) at high redshift discovered in wide field submm surveys, play an important role in the study of the early formation of massive galaxies, corresponding to perhaps the dominant star formation episode in the formation of massive elliptical galaxies (e.g., Casey et al. 2014). Star formation rates over 1000 M⊙ year-1, occurring for timescales up to 108 years, can form the majority of stars in a large elliptical (e.g., Narayanan et al. 2015). These systems are typically highly dust-obscured, and best studied at IR through radio wavelengths.
A second important finding in galaxy evolution is the correlation between the masses of supermassive black holes (SMBHs) and their host spheroidal galaxies (e.g., Kormendy & Ho 2013). While the exact nature of this correlation remains under investigation, including its redshift evolution (e.g., Walter et al. 2004; Wang et al. 2013; Willott et al. 2015; Kimball et al. 2015), and certainly counter examples exist (e.g., van den Bosch et al. 2012), the general implication of such a correlation would be that there exists some sort of co-evolution of supermassive black holes and their host galaxies
Submm galaxies (SMGs) and other ultra-luminous infrared galaxies (ULIRGs), powered by either star formation or active galactic nucleus (AGN), have clustering properties that imply they reside in the densest cosmic environments (proto-clusters) in the early Universe (e.g., Blain et al. 2002; Chapman et al. 2009; Capak et al. 2011). The mechanism driving the extreme star formation rates remains uncertain, or at least multivariate. Some systems are clearly in the process of a major gas rich merger, in which nuclear starbursts are triggered by tidal torques driving gas to the galaxy centers (e.g., Engel et al. 2010; Tacconi et al. 2008; Riechers et al. 2011). However, some SMGs show clear evidence for smoothly rotating disk galaxies, with little indication of a major disturbance (e.g., Hodge et al. 2012; Karim et al. 2016, in preparation). There is some evidence that the most extreme luminosity systems, in particular powerful AGN in HyLIRGs (quasars and powerful radio galaxies), are preferentially involved in active, gas rich major mergers leading to compact, nuclear starbursts (e.g., Riechers et al. 2008, 2011; Miley & De Breuck 2008; Ivison et al. 2012). These merging systems may indicate a major accretion event in the formation of the SMBH, coeval with the major star formation episode of the host galaxy.
Wide field surveys have identified thousands of extreme starbursts in the early Universe, and the statistical properties and demographics are reasonably well determined (e.g., Casey et al. 2012). Study of such systems are now turning to the detailed physical processes driving extreme starbursts in the early Universe, enabled by the advent of sensitive, wide-band interferometers such as the Atacama Large Millimeter/submillimeter Array (ALMA), the Very Large Array (VLA), and the NOrthern Millimeter Extended Array (NOEMA). These facilities allow for deep, very high resolution imaging of the dust, gas, star formation, and dynamics in extreme starbursts, unhindered by dust obscuration. Key questions can now be addressed, such as: What is the relationship between gas mass and star formation (i.e., the ‘star formation law’)? What are the interstellar medium (ISM) physical conditions that drive the extreme star formation? What dominates the gas supply? What role does the local environment play (proto-cluster, group harassment)? What is the role of feedback in mediating galaxy formation, driven by either AGN and/or starbursts?
The BRI1202–0725 (4.7) and BRI1335–0417 (4.4) systems were among the first HyLIRG systems discovered at very high redshift (Irwin et al. 1991; McMahon et al. 1994; Omont et al. 1996a), and they remain two of the brightest unlensed submm sources known at . These two systems are the archetypes for coeval extreme starbursts and luminous AGN within 1.4 Gyr of the Big Bang. We have undertaken an extensive study of these systems, using ALMA, the VLA, NOEMA, and other telescopes, to determine the dominant physical processes driving the extreme starbursts and their evolution.
In this paper, we present our latest VLA observations of the CO() emission from these two systems, at a resolution as high as kpc. Imaging of low order CO emission is crucial to understand the distribution and dynamics of the cool molecular gas fueling star formation in the systems. We will assume (,,h)=(0.682,0.308,0.678) (Planck Collaboration et al., 2015) throughout. At this distance, 1 arcsecond corresponds to 6.63 kpc at =4.69 (BRI1202–0725) and 6.82 kpc at =4.41 (BRI1335–0417).
2 The Sources
2.1 BRI1202–0725
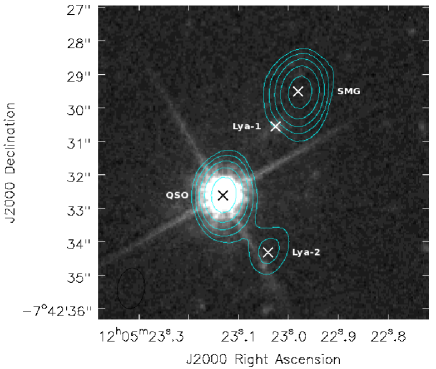
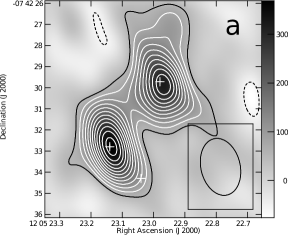
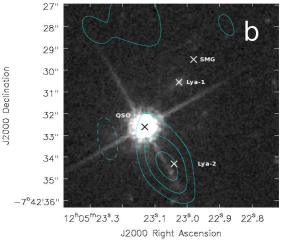
BRI1202–0725 () is perhaps the richest physical laboratory to study major gas rich mergers in the early Universe. The system includes two HyLIRGs separated by : a prototypical, highly dust obscured SMG, and a luminous optical quasar (QSO) in an extreme starburst galaxy. We will refer to the QSO host galaxy as the QSO in what follows. Two Ly- emitting galaxies (LAEs) are also seen in the system (Omont et al. 1996a; Hu et al. 1996). The 340 GHz emission of Carilli et al. (2013) and the HST/ACS F775W filter image of Decarli et al. (2014) are shown in an overview of the field (Fig. 1).
2.1.1 SMG & QSO
The first detected component of the system, the QSO, was originally discovered as the highest redshift source in a color-selected (UKST , R, and I plates) survey for high redshift QSOs (Irwin et al., 1991) using the Automated Plate Measuring (APM) machine. This discovery in the optical was followed with a detection of FIR emission from thermal dust (McMahon et al., 1994) with a beam. Optical spectra show that it features a central black hole with mass M⊙, as estimated from the MgII linewidth (Carniani et al., 2013).
The SMG companion was first discovered in the 1.25 mm observations of Omont et al. (1996b). These resolution images revealed mm continuum and CO() emission in the SMG and QSO, showing that they are a pair of distinct galaxies (Carilli et al., 2002). Spectral energy distribution (SED) fits of Iono et al. (2006) yield FIR luminosities of 1.2L⊙ and 3.8L⊙ for the SMG and QSO, respectively, indicating that both galaxies are HyLIRGS independently.
The field has been well studied in the submm (Isaak et al. 1994; Benford et al. 1999; Wagg et al. 2012; Carilli et al. 2013), mm (McMahon et al. 1994; Omont et al. 1996a), and radio continuum (Yun et al. 2000; Carilli et al. 2002; Momjian et al. 2005; Wagg et al. 2014). The SEDs of these observations are well fit by combined synchrotron, free-free, and dust emission models for star forming galaxies. The dust masses are MM⊙ (McMahon et al. 1994; Isaak et al. 1994; Hu et al. 1996; Benford et al. 1999) and the dust temperatures in each object are TK (Isaak et al. 1994; Leech et al. 2001; Wagg et al. 2014). Very Long Baseline Interferometry (VLBI) radio continuum observations yield a non-thermal brightness temperature consistent with a nuclear starburst in the QSO and the SMG (Momjian et al., 2005).
CO observations have successfully detected (Omont et al. 1996b; Salomé et al. 2012), (Omont et al. 1996b; Ohta et al. 1996; Yun et al. 1999; Salomé et al. 2012), (Omont et al., 1996a), (Kawabe et al. 1999; Carilli et al. 2002; Wagg et al. 2014), and (Riechers et al. 2006). The QSO CO emission has a smaller velocity width than the SMG. The different CO transitions show relative line strengths that imply high excitation, essentially thermal excitation, to (Riechers et al., 2008), (Wagg et al., 2014), or up to (Salomé et al., 2012).
Assuming a CO luminosity to gas mass conversion factor typical of ULIRGs (M⊙K-1 km-1 s pc-2; Bolatto et al. 2013), the molecular gas masses are MM⊙ (McMahon et al. 1994; Ohta et al. 1996; Kawabe et al. 1999; Carilli et al. 2002; Salomé et al. 2012; Carniani et al. 2013). In particular, Wagg et al. (2014) find gas masses of M⊙ for the SMG and M⊙ for the QSO. The SED fits of Wagg et al. (2014) give star formation rates (SFRs) of M⊙ year-1 for the SMG and for the QSO. These values give short gas depletion timescales of Myr for the SMG and Myr for the QSO and placing them at the low-timescale end, although within the scatter, of values seen in extreme starbursts in the early Universe (Hodge et al. 2015; Kennicutt & Evans 2012).
Imaging has been performed in the atomic fine structure lines, including [CI] (Salomé et al., 2012), [NII] (Decarli et al., 2014), and [CII] (Iono et al. 2006; Wagg et al. 2012; Carilli et al. 2013; Carniani et al. 2013). The [CII] imaging in particular shows an ordered velocity gradient across the SMG, suggesting rotation on scales of a few kpc (Carilli et al., 2013). If this is the case, the dynamical mass is MM⊙. The velocity field of the QSO is less ordered, but [CII] observations suggest a small-scale outflow (Wagg et al., 2012; Carilli et al., 2013; Carniani et al., 2013).
2.1.2 Ly- Emitters
The Ly- emission in the BRI1202–0725 field shows a broad line from the QSO, and two additional sources: a detected extension 2.3′′ to the north of the QSO (Petitjean et al., 1996; Hu et al., 1996; Williams et al., 2014), called Ly-1, and emission from a galaxy to the southwest of the QSO, called Ly-2 (Hu et al., 1997; Williams et al., 2014). Optical continuum emission from both Ly-1 (Fontana et al. 1996; Hu et al. 1996; Fontana et al. 1998) and Ly-2 (Williams et al. 2014) is also detected. Ly-1 shows a rest frame B magnitude comparable to a L* galaxy (Hu et al. 1996).
A study of the permitted UV atomic emission lines and the forbidden FIR fine structure lines from Ly-1 suggest that the QSO is unlikely to be the heating source for the ionized gas, and the line ratios are consistent with heating by local star formation (Williams et al., 2014). Ly-1 may then be shielded by an obscuring torus around the QSO. This face-on geometry relative to us is consistent with the fact that we observe the broad line region of the QSO in strong UV lines, even though the host galaxy has a large dust mass.
The [CII] emission shows Ly-1 may be in a complete bridge of atomic gas between the QSO and SMG (Carilli et al., 2013). Such a bridge would be the natural consequence of strong gravitational interaction during the merging of two gas rich galaxies, although the detection of the bridge remains tentative. Using a stellar population synthesis model, Fontana et al. (1996) found a stellar mass of MM⊙. The SFR of Ly-1 (M⊙ year-1) was originally estimated using a similar synthesis model (Fontana et al., 1998), while Carilli et al. (2013) found M⊙ year-1 using a conversion.
Evidence suggests that Ly-2 may be somehow associated with an outflow from the QSO. In particular, an extension from the QSO towards Ly-2 has been seen in CO() (Salomé et al., 2012), and emission between the QSO and Ly-2 appears in the [CII] channel maps of Carilli et al. (2013). The star formation rate, estimated from the dust continuum emission, is M⊙ year-1 (Carilli et al., 2013).
Ly- emission from Ly-1 and Ly-2 shows full width at half maximum (FWHM) 1400 and 1200 km s-1 (Williams et al., 2014), which are much broader than their [CII] emission (FWHM50 and 340 km s-1; Carilli et al. 2013).
While Ohta et al. (2000) detected [OII] in Ly-1 and Decarli et al. (2014) found [NII] in Ly-2, deep Very Large Telescope (VLT) observations did not detect UV lines in either source (no NV, SiIV, CIV, HeII; Williams et al. 2014). These non-detections suggest that the LAEs originate from star formation, not QSO photoionization, and trace a turbulent ISM/star formation environment affected by the QSO outflow.
2.2 BRI1335–0417 (=4.4)
Also discovered in the APM survey (Irwin et al., 1991), BRI1335–0417 (=4.4) is likely a late-stage, gas rich, “wet” merger, with one highly disturbed galaxy associated with an AGN (Riechers et al., 2008). The molecular gas shows a dominant southern core, associated with the QSO host galaxy, and a extension towards a weaker northern peak (Carilli et al., 2002; Riechers et al., 2008). It is also classified as a HyLIRG due to its FIR luminosity of 3.1L⊙ (Carilli et al., 2002). The relation of Å luminosity and H linewidth to black hole mass predicts MM⊙ (Shields et al., 2006). Similarly to BRI1202–0725, the rest frame radio through FIR SED of the system is consistent with a star forming galaxy (Wagg et al., 2014). SED modeling suggests a total dust mass of M (Omont et al. 1996a; Benford et al. 1999; Riechers et al. 2008) and a dust temperature TK (Benford et al. 1999; Carilli et al. 1999).
CO observations have revealed both (Carilli et al. 1999, 2002; Riechers et al. 2008; Wagg et al. 2014) and (Guilloteau et al., 1997). Again, the CO spectral line energy distribution (SLED) implies very high excitation and thermalized line strengths up to (Wagg et al. 2014; Guilloteau et al. 1997). The standard ULIRG L to molecular gas mass conversion factor gives a molecular gas mass of M⊙ (Guilloteau et al. 1997; Carilli et al. 1999, 2002; Riechers et al. 2008; Wagg et al. 2014).
[CII] emission was detected in this source with the Atacama Pathfinder EXperiment telescope (APEX) (Wagg et al., 2010).
The SED fits of Wagg et al. (2014) give an SFR of M⊙ year-1. When combined with their gas mass estimate of M⊙, they find a low gas depletion timescale of Myr, placing this source in the starbursting area of a Kennicutt-Schmidt diagram.
VLBI radio continuum observations did not detect any compact radio source, consistent with the idea that the radio continuum emission is due to star formation, not a compact AGN (Momjian et al., 2007).
3 Observations
Observations were carried out between September 2013 and February 2014 with the VLA of the NRAO in the B– and BnA–configurations, as well as during the move time between the two configurations. Each observing session was 2 hours, consisting of time on the target (BRI1202–0725/BRI1335–0417), complex gain calibrator (J1229+0203/J1338–0432), and 3C286, which was used for bandpass, delay, and flux calibration. Table 1 summarizes the observing sessions for each target.
| Source | Date | Configuration | Time [hr] |
|---|---|---|---|
| BRI1202–0725 | 2013 Oct 28 | B | 2 |
| BRI1202–0725 | 2014 Jan 23 | BBnA | 2 |
| BRI1202–0725 | 2014 Jan 30 | BnA | 2 |
| BRI1202–0725 | 2014 Feb 5 | BnA | 2 |
| BRI1202–0725 | 2014 Feb 9 | BnA | 2 |
| BRI1202–0725 | 2014 Feb 10 | BnA | 2 |
| BRI1335–0417 | 2013 Sep 29 | B | |
| BRI1335–0417 | 2014 Jan 18 | B | 2 |
| BRI1335–0417 | 2014 Jan 19 | B | |
| BRI1335–0417 | 2014 Jan 21 | B | |
| BRI1335–0417 | 2014 Jan 23 | BBnA | |
| BRI1335–0417 | 2014 Jan 24 | BBnA | 2 |
| BRI1335–0417 | 2014 Feb 5 | BnA | 2 |
| BRI1335–0417 | 2014 Feb 8 | BnA | |
| BRI1335–0417 | 2014 Feb 9 | BnA | 2 |
| BRI1335–0417 | 2014 Feb 10 | BnA | 2 |
In the following, we define zero velocity of the CO() line as its frequency at CO redshifts of Wagg et al. (2014) for the BRI1202–0725 SMG (), BRI1202–0725 QSO (), and BRI1335–0417 (). This shifts the CO() line ( GHz) to observed frequency of GHz, 40.4865 GHz, and 42.6409 GHz, respectively.
We used the Q-band receiver and the four pairs of the 3-bit samplers on each VLA antenna to deliver a total of 8 GHz (GHz; GHz to GHz), with each GHz being in right and left circular polarization. During correlation, each GHz was further split into 16 spectral windows (SPWs) of width MHz, and each SPW was split to 64 MHz wide channels. To correct for the poor sensitivity of the SPWs at their edges, two tunings were observed with a 16 MHz offset (39.960 to 48.008 GHz and 39.976 to 48.024 GHz) to mitigate the ranges of poor sensitivity in the instrument’s frequency response.
Data were calibrated using the Common Astronomy Software Applications (CASA) and altered versions of its version 4.1.0 calibration pipeline. First, the data were processed by a pipeline that was optimized for spectral line data. This optimization entailed the removal of Hanning smoothing and the flagging of only the one end channel of each SPW, rather than the end three channels. In addition, the two (BBnA) or three (BnA) northernmost antennas were flagged to create a circular beam. The data were then inspected for troublesome antennas or frequency ranges, which were manually flagged. The flagged measurement set was then passed through a final, calibration-only pipeline that did not flag any additional data. The six measurement sets of BRI1202–0725 and fifteen measurement sets of BRI1335–0417 were used to create naturally weighted images. Additionally, D–configuration VLA data of both objects from Wagg et al. (2014) was used. The absolute flux scale uncertainty was (Perley & Butler, 2013). Analysis was performed with both Astronomical Image Processing System (AIPS) and CASA.
Images were created with the CASA task clean, using natural weighting. Continuum images were made by combining the data of all observation sessions using multi-frequency synthesis (MFS), excluding channels that contained line emission. Spectral line cubes were made by applying radial uv-tapers to the B–configuration data, creating images with different synthesized beam sizes to investigate limits to the CO source sizes. We also explored combining the D– and B–configuration uv-data before imaging. However, the synthesized beam solid angles differed by two orders of magnitude, and the resulting combined synthesized beam had very broad wings. We explored extensively different visibility weighting schemes in order to restore jointly any large and small scale structure, while retaining adequate sensitivity. Unfortunately, for faint sources such as these, we found that it was difficult to differentiate conclusively between real extended structure and apparent structure caused by the broad wings of the combined synthesized beam. Hence, we have taken a conservative approach to determining source sizes by comparing D–configuration spectra with B–configuration spectra generated using gradual tapers of the visibilities.
4 Results
4.1 Continuum
We first consider the 44 GHz continuum emission. In both sources, the SED fitting of broad band continuum emission implies that the 44 GHz observed emission (250 GHz rest frame), is thermal emission from cold dust (Wagg et al., 2014).
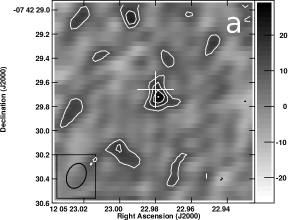
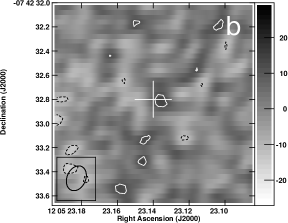
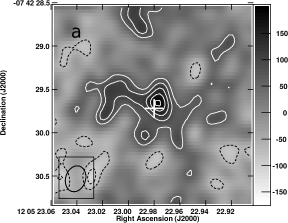
Fig. 2a shows the VLA B–configuration 44GHz continuum image of the SMG in BRI1202–0725, at a resolution of 0.21 at PA = -24∘. A two–dimensional Gaussian fit to the emission seen in this image yields a size of (0.18) at PA = 2∘, or kpc2. The peak and integrated flux densities of the SMG fit are Jy beam-1 and Jy, respectively. The D–configuration analysis at by Wagg et al. (2014) found Jy. These nearly equal integrated flux densities suggest that the majority of the continuum emission originates from the central kpc, not from diffuse structures.
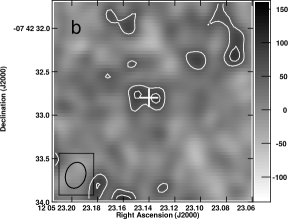
For the QSO host galaxy in 1202–0725, the continuum emission is weak (see Fig. 2b), and we can only determine an upper limit to the source size of kpc2. From Gaussian fitting, the peak and integrated flux densities of the QSO are Jy beam-1 and Jy. Wagg et al. (2014) D–configuration analysis found Jy.
Momjian et al. (2005) observed the synchrotron emission of BRI1202–0725 using VLBI at 1.4 GHz. The SMG was clearly resolved, and larger than, but comparable to the sizes observed in the 44GHz dust continuum (kpc2).
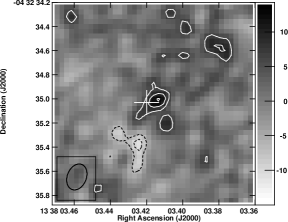
BRI1335–0417 is detected in continuum emission with a peak at the 4 level (Fig. 3). A two–dimensional Gaussian fit to the source yields a size of at PA = 15∘, or kpc2, a peak flux density of Jy beam-1, and an integrated flux density of Jy. Wagg et al. (2014) reported a D–configuration flux density of Jy, which is greater than our value. A VLBI observation of BRI1335–0417 at 1.4 GHz yielded a size of kpc2 (Momjian et al., 2007).
We do not detect BRI1202–0725 Ly-2 at 44 GHz, implying a lower size limit of , or kpc.
4.2 Peak Spectra Size Constraints
In order to get a firm handle on the CO source size limits, we compare B–configuration CO spectra obtained using different uv–tapers, corresponding to different spatial resolutions, to much lower spatial resolution D–configuration spectra (). In each case, the B–configuration spectrum was extracted at the peak of the velocity integrated emission (moment zero image) for the given resolution.
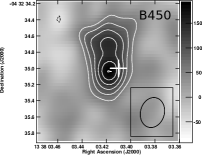
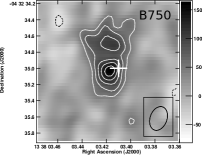
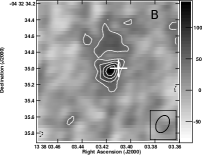
We applied circular Gaussian uv–tapers to our B–configuration data in units of kilo–wavelengths (mm for BRI1202–0725 & mm for BRI1335–0417). We included tapers of FWHM 750k (hereafter B750), 450k (B450), and 250k (B250). Note that while these tapers increased the effective beam size of the configuration, these are still much smaller than the resolution of the D–configuration whose maximum baseline corresponds to k. The beam sizes of the tapered and untapered data are listed in Table 2. Note that for tapers lower than 250k, the noise increases dramatically due to the lack of short spacings.
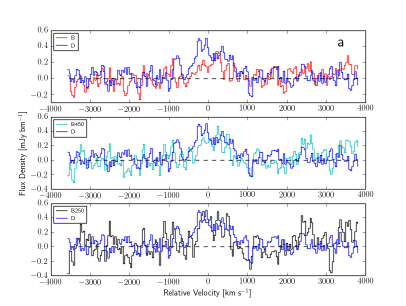
All spectral line image cubes were created with natural weighting (after tapering), and 1 GHz total bandwidth, approximately centered on the CO() line. Each channel was 5 MHz wide, or km s-1. Fig. 4 compares spectra taken at the emission peak of the untapered B–configuration, tapered B–configurations (B750, B450, and B250), and D–configuration data for the SMG and QSO of BRI1202–0725. The results of fitting single 1-D Gaussians to spectra of each dataset taken at the B750 emission peaks are also listed in Table 2.
| Amplitude | Center | vFWHM | Line Integral | Restoring Beam | |||
|---|---|---|---|---|---|---|---|
| Source | Image | ||||||
| [mJy beam-1] | [km s-1] | [km s-1] | [mJy beam-1 km s-1] | [] | [mJy beam-1] | ||
| BRI1202–0725 SMG | B | 0.220.16 | 0.17 | ||||
| BRI1202–0725 SMG | B750 | 0.290.21 | 0.18 | ||||
| BRI1202–0725 SMG | B450 | 0.380.29 | 0.20 | ||||
| BRI1202–0725 SMG | B250 | 0.580.44 | 0.26 | ||||
| BRI1202–0725 SMG | D | 2.571.73 | 0.18 | ||||
| BRI1202–0725 QSO | B | 0.220.16 | 0.17 | ||||
| BRI1202–0725 QSO | B750 | 0.290.21 | 0.18 | ||||
| BRI1202–0725 QSO | B450 | 0.380.29 | 0.20 | ||||
| BRI1202–0725 QSO | B250 | 0.580.44 | 0.26 | ||||
| BRI1202–0725 QSO | D | 2.571.73 | 0.18 | ||||
| BRI1335–0417 N | B | 0.23 0.15 | 0.13 | ||||
| BRI1335–0417 N | B750 | 0.300.21 | 0.13 | ||||
| BRI1335–0417 N | B450 | 0.360.29 | 0.15 | ||||
| BRI1335–0417 N | B250 | 0.540.46 | 0.19 | ||||
| BRI1335–0417 N | D | 2.541.95 | 0.29 | ||||
| BRI1335–0417 S | B | 0.23 0.15 | 0.13 | ||||
| BRI1335–0417 S | B750 | 0.300.21 | 0.13 | ||||
| BRI1335–0417 S | B450 | 0.360.29 | 0.15 | ||||
| BRI1335–0417 S | B250 | 0.540.46 | 0.19 | ||||
| BRI1335–0417 S | D | 2.541.95 | 0.29 |
The first set of plots in Fig. 4 (a) shows that, for the BRI1202–0725 SMG, the untapered B–configuration captures less that half of the D–configuration line flux, and falls particularly short at negative velocity. The 250k taper spectrum is comparable to that of the D–configuration, within the noise, indicating a source size approximately equal to the beam size. From Table 2, this places the scale of the BRI1202–0725 SMG at around that of the restoring beam of B250, namely (kpc).
The second set of plots (b) shows that the full B–configuration resolution spectrum of the QSO recovers very little of the CO emission, and essentially zero emission on the high positive velocity wing of the line. The B250 taper captures most of the negative velocity part of the emission, but still misses most of the D–configuration emission above zero velocity, implying an extent (kpc).
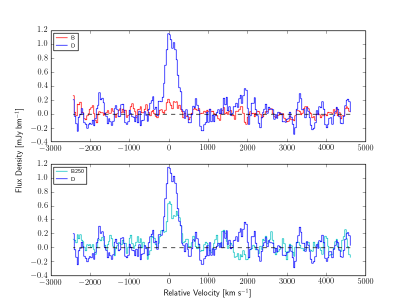
BRI1335–0417 is an extended CO source, as was already demonstrated in Riechers et al. (2008). This is seen clearly in the comparison of the full B–configuration resolution spectrum and the D–configuration (Fig. 5). Even for the B250 taper, we are only recovering about half of the integrated D–configuration emission. From this, we conclude that the extent of the emission is (kpc).
4.3 Moment Zero Images
Our spectral analysis has demonstrated clearly that the CO emission is spatially extended in all three sources. We now turn to the imaging analysis for further details, keeping in mind that the signal to noise ratio for some of the sources is low, and hence detailed imaging is difficult. We employ the B750 images, which retain some brightness sensitivity, but also provide reasonable resolution ().
Moment zero (velocity integrated CO flux) images were generated by applying the CASA task immoments to the tapered image cubes. The velocity ranges for integration were determined by examining the width (Full Width at Zero Intensity; FWZI) of the CO lines in each dataset. This extent was -357 to 606 km s-1 (40.43 to 40.56 GHz) for the BRI1202–0725 SMG, -277 to 241 km s-1 (40.46 to 40.53 GHz) for the BRI1202–0725 QSO, and -281 to 392 km s-1 (42.595 to 42.690 GHz) for BRI1335–0417.
For the SMG in BRI1202–0725, the moment zero map in Fig. 6a show an east-west extension at the level, with a maximum extent of . This extension is admittedly of marginal significance, but it is certainly consistent with the direction of the velocity gradient seen in [CII] images taken with ALMA (Wagg et al. 2012; Carilli et al. 2013; Carniani et al. 2013).
For the QSO in BRI1202–0725, the B750 moment zero image (Fig. 6b) shows a marginal (3) detection, with only a fraction of the integrated flux density seen in the D–configuration, implying that the B750 image resolves out most of the emission. It should be noted that fits to each of the two components of the B750 data show that the emission is equally shared between them (Jy km s-1 for the west peak and Jy km s -1 for the east peak). For completeness, a single Gaussian fit to the QSO emission yields kpc2 at PA = 81, with a peak of Jy beam-1 km s-1 and a total of Jy km s -1. This integrated flux density is that of the D–configuration data (Jy km s -1; Wagg et al. 2014).
Moment zero images of BRI1335–0417 (Fig. 7) show clearly the extended emission to the north and the ever present dominant southern source. We have generated moment zero images at three different resolutions, showing the emergence of diffuse structure to the north. Fitting Gaussians to the southern and northern sources separately in the B750 image yields sizes of kpc2 at PA = and kpc2 at PA = , respectively. A fit to the brighter southern source gives a larger integrated flux density of (Jy km s-1 versus (Jy km s-1 for the northern source. It also features a higher fit peak flux (Jy beam-1 km s-1 versus (Jy beam-1 km s-1 for the northern source. A fit to the D–configuration data returns an integrated flux density of Jy km s-1, which is comparable to the two above B750 fits combined (Jy km s-1). This suggests that the majority of the CO emission emanates from these two compact sources, not from diffuse gas.
5 Analysis
5.1 BRI1202–0725: Ly-2 CO Emission
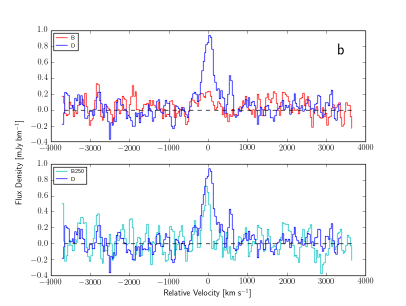
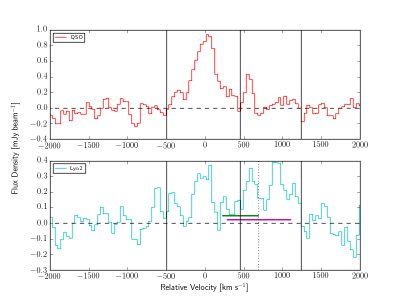
We next investigate CO emission from Ly-2 to the southwest of the QSO using the D–configuration observations (Fig. 8 and 9). Velocities are relative to the QSO redshift. Ly-2 is separated by from the QSO, corresponding to less than the 20% point of the synthesized beam. Note that no CO emission was detected from Ly-1 in any dataset.
Fig. 8 shows the CO() spectrum of the QSO, again, as well as one taken at the position of Ly-2. Two velocity ranges are indicated: one corresponding to the main QSO line (-500 to 450 km s-1), and a second at higher positive velocity (450 to 1240 km s-1). Note that the main QSO line has no emission over most of this high positive velocity range, hence sidelobes from the QSO emission are not an issue in terms of contaminating the Ly-2 spectrum. There appears to be emission over this high positive velocity range at the position of Ly-2. The low end of this velocity range also corresponds to the [CII] emission seen from Ly-2 (Wagg et al., 2012). Unfortunately, the ALMA [CII] observations covered only the lower velocities. The full width at tenth of maximum (FWTM) of the [NII] observation of Decarli et al. (2014) (magenta line) is comparable to our upper velocity bin.
Fig. 9 shows an image of the integrated emission in the high positive velocity range. A clear source appears at the position of Ly-2, with a 6 significance. The integrated line flux density over this velocity range is Jy km , which is significantly larger than the limit of Jy km from Wagg et al. (2014). Adopting bounding conversion factors of M⊙K-1 km-1 s pc-2 (for starbursting galaxies) and M⊙K-1 km-1 s pc-2 (for the Milky Way) yields a gas mass range of (M⊙.
Briefly, we consider why Ly-2 CO(J=) emission was not reported in the original paper of Wagg et al. (2014). First, Wagg et al. were focused principally on the BRI1202–0725 SMG and AGN host galaxies. And second, the velocity selection of Ly-2 was based on the truncated [CII] line of Carilli et al. (2013). Recent [NII] observations by Decarli et al. (2014) show that the full profile of the object is much broader. We have increased the signal-to-noise by opening up the search space in velocity to accommodate a broader line.
We have looked for the emission from Ly-2 CO in the B–configuration data over the broader velocity range. We do not detect emission at full resolution, of B750, implying a level of Jy beam-1 km s-1. These results give a rough lower limit to the source size of . Conversely, fitting to the D array image of the velocity integrated CO emission leads to an upper limit to the size of . We may then state a conservative CO extent of kpc.
5.2 Star Formation Surface Densities
We have SFRs for each object (Wagg et al., 2014), but require star formation areas to calculate surface densities. Current measurements are only limits or marginal measurements. Carniani et al. (2013) present unresolved ALMA 340 GHz size estimates of kpc2 for the BRI1202–0725 SMG and QSO. Our measured 44 GHz size for the BRI1202–0725 SMG was kpc2, which is an order of magnitude smaller. Another constraint is the 1.4 GHz size of the BRI1202–0725 SMG from Momjian et al. (2005), kpc2. Similarly, we found that BRI1335–0417 showed a 44 GHz size of kpc2, while Momjian et al. (2007) found a 1.4 GHz size of kpc2. These 1.4GHz synchrotron-emitting areas are smaller than, but within of our GHz regions. While our 44 GHz size estimates feature large uncertainties, they also show integrated flux densities that are greater than their peak surface brightnesses (Jy and Jy beam-1 for BRI1202–0725 SMG, Jy and Jy beam-1 for BRI1335–0417). The greater integrated flux density vs. peak surface brightness suggests that the sources are indeed resolved. However, in both cases, these integrated flux densities from the B array imaging are still (marginally) smaller than those seen in the D array data: Jy and Jy, respectively, suggesting additional diffuse emission. Given the low signal-to-noise of these observations, we adopt for the sake of calculation the 44GHz sizes as as a guide, keeping in mind that these are likely lower limits, with upper limits set by ALMA dust continuum imaging.
The BRI1202–0725 SMG shows a density of M⊙ yr-1 kpc-2, while BRI1335–0417 shows M⊙ yr-1 kpc-2. The continuum image of the BRI1202–0725 QSO has too low a signal to noise ratio to determine a size. The SFR surface density of Ly-2 may be estimated using a SFR=M⊙ yr-1 (Carilli et al., 2013) and a 44 GHz size limit of kpc, giving M⊙ year-1 kpc-2.
The fraction of the luminosity at which gravitational collapse is balanced by radiation pressure, or Eddington fraction, of these sources can be estimated using these surface densities. Thompson et al. (2005) develop the limit of SFR surface density M⊙ year-1 kpc-2 for super-Eddington luminosity, assuming a star formation efficiency and opacity. By this criterion, both the BRI1202–0725 SMG and BRI1335–0417 are super-Eddington. An alternate estimate may be found using a luminosity-to-mass limit of 500 L⊙/M⊙ (Scoville, 2012). Approximate values of L⊙ and M⊙ give Eddington fractions of . See Appendix A for an additional Eddington criterion which returns for both sources.
While the scatter is significant between these methods, the first suggests that both the SMG and BRI1335–0417 are radiating near their Eddington limit. It should be noted that the Eddington fraction is dependent on assumed geometry (disk/sphere), L’CO to M conversion factor, opacity, and total object mass, among other variables.
5.3 Gas Surface Densities
For the sources that we have both 44 GHz continuum and CO() size estimates (BRI1202–0725 SMG and BRI1335–0417), it is evident that the CO extent is greater. This continuum, which is GHz (rest frame), is a tracer of cold dust, and thus indirect star formation. The more compact size of the continuum emitting region compared to CO emission, which traces the molecular gas, suggests a central, excited region surrounded by a gaseous reservoir.
We estimate the molecular gas masses using three conversion factors from L to M. However, all three factors use the luminosity of the transition of CO, not the observed transition. The ratios of these luminosities are given by Carilli & Walter (2013) as r21=L’CO(2-1)/L’CO(1-0)=0.85, 0.99, 0.97, and 0.5 for SMGs, QSOs, color selected galaxies (CSGs), and the Milky Way, respectively. The application of the SMG ratio to the BRI1202–0725 SMG and the QSO ratio to the BRI1202–0725 QSO are obvious. Less so is the correct correction for BRI1335–0417, which shows evidence of an AGN but no compact radio emission. We will use the SMG correction factor, due to its extended starburst region. To account for the unknown nature of BRI1202–0725 Ly-2, we will use the range of factors from Milky Way-type objects to CSGs (0.5-0.97).
The first gas mass estimate uses the standard conversion for low ULIRGs, M⊙K-1 km-1 s pc-2. We also use the flexible factor of Narayanan et al. (2012):
| (1) |
where is the normalized metallicity and is the line intensity, which we will define as , where is the area of our CO() emission and is our . To explore the metallicity dependence of the gas mass, we used solar metallicity () and the extremely low metallicity of I Zw 18 (; Lequeux et al. 1979). Note that the latter value is unphysically low for areas showing this level of stellar development, and it is only included as an illustrative boundary.
| BRI1202–0725 SMG | BRI1202–0725 QSO | BRI1335–0417 | BRI1202–0725 Ly-2 | |
|---|---|---|---|---|
| L’CO(2-1) [K km s-1 pc2] | ||||
| [M⊙ K-1 km-1 s pc-2] | ||||
| [M⊙ K-1 km-1 s pc-2] | ||||
| Mα=0.8 [M⊙] | ||||
| M [M⊙] | ||||
| M [M⊙] | ||||
| ACO(2-1) [kpc2] | ||||
| [M⊙ pc-2] | ||||
| [M⊙ pc-2] | ||||
| [M⊙ pc-2] | ||||
| SFR [M⊙ year-1]aaWagg et al. (2014) | 0.17 | |||
| A [kpc2] | - | |||
| [M⊙ year-1 kpc-2] | - |
Our molecular gas masses and resulting surface densities are listed in Table 3. Using our CO emission extents (Section 4.3) and the molecular gas masses, we find gas surface densities M⊙ pc-2 for the three HyLIRGs. These are larger than the average gas surface density reported by Greve et al. (2005), who observed 11 SMGs in and found M⊙ pc-2. Our values are more comparable to the estimates of Daddi et al. (2009), who find M⊙ pc-2 for GN20 and GN20.2a.
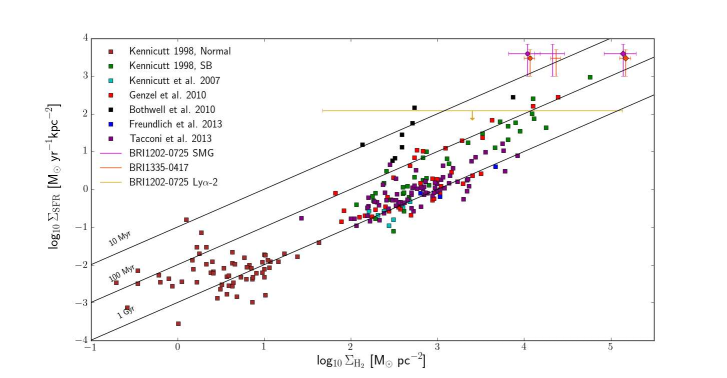
The placement of these objects on a Kennicutt-Schmidt plot (Fig. 10) shows that they are separate from the main sequence. If an unrealistic metallicity is assumed, they may have comparable gas depletion timescales to local starbursts or SMGs. A limit on source metallicity can be be found by assuming and inverting equation 1 to solve for Z’, yielding Z’ and Z’.
Finally, we may use our CO size limits and gas mass estimate for Ly-2 (Section 5.1) to find M⊙ pc-2. This range includes our uncertainties in the CO size, the conversion factor, and the ratio. Due to its unconstrained size, it may match well with either starbursts or normal galaxies in the Kennicutt-Schmidt diagram (Fig. 10).
STACEY
5.4 Diagnostic Plot
An additional method of deducing the physical conditions of these objects is to use the diagnostic plot of Stacey et al. (2010). This plot of L[CII]/LFIR versus LCO/LFIR allows us to estimate both the matter density (n[=]cm-3) and strength of the FUV radiation field (G0=FFUV/(erg cm-2 s-1)). The placement of our sources is compared to densities and radiation fields of simulated photodissociation regions (PDRs), resulting in limits in Table 4. The densities of the BRI1202–0725 SMG and Ly-2 were similar to that of BRI1335–0417, while the BRI1202–0725 QSO was less dense. The radiation field of BRI1202–0725 Ly-2 was markedly less than that of the three HyLIRGs. Overall, these objects are higher density and show lower intensity FUV fields than the other objects in the sample.
| Source | L[CII] | LCO(1-0) | LFIR | n | G0 |
|---|---|---|---|---|---|
| [10L⊙] | [L⊙] | [1013L⊙] | [cm-3] | ||
| BRI1202–0725 SMG | aafootnotemark: | ddfootnotemark: | |||
| BRI1202–0725 QSO | aafootnotemark: | ddfootnotemark: | |||
| BRI1335–0417 | bbfootnotemark: | eefootnotemark: | |||
| BRI1202–0725 Ly-2 | ccfootnotemark: | fffootnotemark: |
6 Discussion
We have imaged the archetypal HyLIRGs BRI1202–0725 and BRI1335–0417 with the VLA B–configuration in the rest-frame 250 GHz continuum and CO() at high resolution. These observations allow us to determine sizes for the 44GHz continuum and the CO emission on scales down to kpc.
The 44 GHz continuum emission in all three sources appears extended on a scale of 1 to 2 kpc, although only marginally so for the QSO host in BRI1202–0725. Based on radio through FIR SED fitting, the observed 44 GHz continuum emission is thermal emission from cold dust (Wagg et al., 2014). For the BRI1202–0725 SMG, the 44 GHz size roughly agrees with the nonthermal 1.4 GHz size from the VLBI observations of Momjian et al. (2005), while the 44 GHz size of BRI1335–0417 is about twice as large as the VLBI 1.4 GHz extent of Momjian et al. (2007). Assuming these 44 GHz continuum extents correspond to that of the starbursting regions, we derive SFR surface densities of M⊙ yr-1 kpc-2 for the BRI1202–0725 SMG and M⊙ yr-1 kpc-2 for BRI1335–0417. While estimates of the Eddington fractions of these sources vary, evidence from one test suggests that both of these objects are possibly radiating above their stable limit.
Using both the standard ULIRG conversion factor for CO luminosity to H2 mass and the more flexible factor of Narayanan et al. (2012), we derive surface densities for the gas mass for these systems, based on the CO() source sizes. Using metallicities of 1 Z⊙ and 0.02 Z⊙, the values range from M⊙ pc-2. When plotted in a Kennicutt-Schmidt diagram, the low metallicity assumption places the HyLIRGs closer to the trend at lower SFR, but all three assumptions mark the HyLIRGs as strong starbursts, i.e. well above main sequence galaxies. A possible limit on object metallicity was found by setting the flexible conversion factor to that of ULIRGs, yielding .
A tentative east-west linear structure is seen in the CO() image of the SMG in BRI1202–0725, possibly a disk of size . This molecular disk is consistent with the east-west velocity gradient seen in the [CII] ALMA observations (Carniani et al., 2013).
For the QSO host galaxy in BRI1202–0725, the CO() emission is clearly extended, although the signal-to-noise of the emission in the B–configuration provides only a lower limit to the size of kpc).
For BRI1335–0417, we confirm the very extended CO emission to the north of the QSO host galaxy, as seen in Riechers et al. (2008). This extended emission has a narrower velocity dispersion than for the main galaxy. The negligible velocity offset with respect to the main galaxy and the lower velocity dispersion of this extended gas suggests that it may be a remnant tidal feature from a previous major merger of gas rich galaxies. This is based on radio observations, as past optical and submm observations lacked the necessary resolution to distinguish the northern extension.
In all three sources, the extent of the 44 GHz continuum emission appears smaller than that of the CO() line emission, or the area of active star formation is smaller than its fuel supply. This suggests a varying level of excitation and star formation activity across each source. The variation can be seen in BRI1335–0417, which shows a southern core in 44 GHz emission, but no northern extension. Since both are seen in CO emission, this suggests that the northern area is not starbursting. This size discrepancy between low order CO and star formation has been noted for other high redshift SFGs (star forming galaxies; e.g., as compiled by Spilker et al. 2015). Alternatively, the different sizes could simply be a result of low signal-to-noise continuum observations not detecting the lower optical depth outer sections of the star forming regions. Higher resolution, more sensitive ALMA observations of the dust continuum emission are planned. These should answer this question of the relative distributions of gas and star formation.
We also detect CO() emission from Ly-2 in the BRI1202–0725 system. The total gas mass is M⊙, and the gas depletion timescale is yr, where has units of M⊙K-1 km-1 s pc-2. Even assuming a low value of (compared to for normal galaxies; Bolatto et al. 2013), this galaxy has a gas depletion timescale comparable to main sequence galaxies at low and high redshift (e.g., years for MS SFGs, Tacconi et al. 2013), and not the extremely short timescales applicable to starbursts.
Klamer et al. (2004) suggested that the extreme aspects of the BRI1202–0725 system might relate to star formation induced by a strong radio jet from the QSO. While no such radio jet has yet been seen, the presence of Ly-2 in the direction of the ouflow from the QSO seen in [CII] (Carilli et al., 2013), is circumstantially suggestive of a hydrodynamic interaction as well as gravitational.
We have used our CO() luminosities in conjunction with previous [CII] luminosities (Wagg et al. 2012, 2010; Carilli et al. 2013) and FIR luminosities (Carniani et al. 2013; Carilli et al. 2002; Williams et al. 2014) to constrain the density and FUV radiation field of photodissociation regions (PDRs) in each source with the diagnostic plot of Stacey et al. (2010). Assuming thermalized ratios (LCO(2-1)/LCO(1-0)=4), this showed that PDRs in the three HyLIRGs showed similar densities and radiation fields to local ULIRGs and objects. When comparing the density and FUV level of PDRs in BRI1202-0725Ly-2 to other objects, an ambiguity arises. They are either similar to normal galaxies in level of FUV emission but are more dense or are similar to ULIRGs in density but feature weaker radiation fields. Current size constraints do not allow for concrete conclusions here.
Our data confirm that these HyLIRGs are extreme starbursts with short depletion timescales, as shown in the Kennicutt-Schmidt Relation. They are consistent with models that show SMG formation in short time periods (Narayanan et al., 2015), although they are at slightly higher redshift than expected.
The data for these two HyLIRG systems suggest that they represent two different stages in the evolution of extreme starbursts driven by major gas rich mergers in the early Universe. BRI1202–0725 appears to be a relatively early stage merger, with a number of distinct galaxies still observed in stars and gas. There are clear indications of strong gravitational interaction between the galaxies likely driving the extreme starbursts, as well as possible evidence for a strong QSO driven outflow assisting in quenching the star formation in the QSO host. BRI1335–0417 appears to be a later stage merger, with just one galaxy seen (the QSO host), plus what may be tidal remnants of the merger seen in the extended cold gas.
The high luminosities, disrupted morphologies, evidence of gravitational interaction, and short gas depletion timescales of these objects suggest that they represent a transient, but highly star forming phase of early galaxy evolution.
G. C. J. is grateful for support from NRAO through the Grote Reber Doctoral Fellowship Program. R. G. M. acknowledges the UK Science and Technology Facilities Council (STFC). K. O. acknowledges the Kavli Institute Fellowship at the Kavli Institute for Cosmology in the University of Cambridge supported by the Kavli Foundation. The National Radio Astronomy Observatory is a facility of the National Science Foundation operated under cooperative agreement by Associated Universities, Inc. We thank all those involved in the VLA project for making these observations possible (project code 13A-012).
References
- Benford et al. (1999) Benford, D. J., Cox, P., Omont, A., Phillips, T. G., & McMahon, R. G. 1999, ApJ, 518, L65
- Blain et al. (2002) Blain, A. W., Smail, I., Ivison, R. J., Kneib, J.-P., & Frayer, D. T. 2002, Phys. Rep., 369, 111
- Bolatto et al. (2013) Bolatto, A. D., Wolfire, M., & Leroy, A. K. 2013, ARA&A, 51, 207
- Bothwell et al. (2010) Bothwell, M. S. et al. 2010, MNRAS, 405, 219
- Capak et al. (2011) Capak, P. L., Riechers, D., Scoville, N. Z., et al. 2011, Nature, 470, 233
- Carilli et al. (1999) Carilli, C. L., Menten, K. M., Yun, M. S. 1999, ApJ, 521, L25
- Carilli et al. (2002) Carilli, C. L., Kohno, K., Kawabe, R., Ohta, K., Henkel, C., et al. 2002, AJ, 123, 1838
- Carilli et al. (2013) Carilli, C. L., Riechers, D., Walter, F., Maiolino, R., Wagg, J., et al. 2013, ApJ, 763, 120
- Carilli & Walter (2013) Carilli, C. L. & Walter, F. 2013, ARA&A, 51, 105
- Carniani et al. (2013) Carniani, S., Marconi, A., Biggs, A., Cresci, G., Cupani, G., et al. 2013, A&A, 559, A29
- Casey et al. (2012) Casey, C. M., Berta, S., Béthermin, M., et al. 2012, ApJ, 761, 140
- Casey et al. (2014) Casey, C. M., Narayanan, D., & Cooray, A. 2014, Phys. Rep., 541, 45
- Chapman et al. (2009) Chapman, S. C., Blain, A., Ibata, R., et al. 2009, ApJ, 691, 560
- Daddi et al. (2009) Daddi, E., Dannerbauer, H., Stern, D., et al. 2009, ApJ, 694, 1517
- Decarli et al. (2014) Decarli, R., Walter, F., Carilli, C., et al. 2014, ApJ, 782, L17
- Engel et al. (2010) Engel, H., Tacconi, L. J., Davies, R. I., et al. 2010, ApJ, 724, 233
- Fontana et al. (1996) Fontana, A., Cristiani, S., D’Odorico, S., Giallongo, E., & Savaglio, S. 1996, MNRAS, 279, L27
- Fontana et al. (1998) Fontana, A., D’Odorico, S., Giallongo, E., et al. 1998, AJ, 115, 1225
- Freundlich et al. (2013) Freundlich et al. 2013, A&A, 553, A130
- Genzel et al. (2010) Genzel, R. et al. 2010, MNRAS, 407, 2091
- Greve et al. (2005) Greve, T. R., Bertoldi, F., Smail, I., et al. 2005, MNRAS, 359, 1165
- Guilloteau et al. (1997) Guilloteau, S., Omont, A., McMahon, R. G., Cox, P., Petitjean, P. 1997, A&A, 328, L1
- Hodge et al. (2012) Hodge, J. A., Carilli, C. L., Walter, F., et al. 2012, ApJ, 760, 11
- Hodge et al. (2015) Hodge, J. A., Riechers, D., Decarli, R., Walter, F., Carilli, C. L., et al. 2015, ApJ, 798, L18
- Hu et al. (1996) Hu, E. M., McMahon, R. G., & Egami, E. 1996, ApJ, 459, L53
- Hu et al. (1997) Hu, E. M., McMahon, R. G., & Egami, E. 1997, in The Hubble Space Telescope and the High-Redshift Universe, eds. N . R. Tanvir, A. Aragon-Salamanca, & J. V. Wall (Singapore: World Scientific), 91
- Iono et al. (2006) Iono, D., Yun, M. S., Elvis, M., et al. 2006, ApJ, 645, L97
- Irwin et al. (1991) Irwin, M., McMahon, R. G., & Hazard, C. 1991, The Space Distribution of QSOs, 21, 117
- Isaak et al. (1994) Isaak, K. G., McMahon, R. G., Hills, R. E., & Withington, S. 1994, MNRAS, 269, L28
- Ivison et al. (2012) Ivison, R. J., Smail, I., Amblard, A., et al. 2012, MNRAS, 425, 1320
- Karim et al. (2016, in preparation) Karim, A. et al. 2016 in prep
- Kawabe et al. (1999) Kawabe, R., Kohno, K., Ohta, K., & Carilli, C. 1999, Highly Redshifted Radio Lines, 156, 45
- Kennicutt (1998) Kennicutt, R. C. 1998, ApJ, 498, 541
- Kennicutt et al. (2007) Kennicutt, R. C. et al. 2007, ApJ, 671, 333
- Kennicutt & Evans (2012) Kennicutt, R. C. & Evans, N. J. 2012, ARA&A, 50, 531
- Kimball et al. (2015) Kimball, A. E., Lacy, M., Lonsdale, C. J., & Macquart, J.-P. 2015, MNRAS, 452, 88
- Klamer et al. (2004) Klamer, I. J., Ekers, R. D., Sadler, E. M., & Hunstead, R. W. 2004, ApJ, 612, L97
- Kormendy & Ho (2013) Kormendy, J., & Ho, L. C. 2013, ARA&A, 51, 511
- Leech et al. (2001) Leech, K. J., Metcalfe, L., & Altieri, B. 2001, MNRAS, 328, 1125
- Lequeux et al. (1979) Lequeux, J., Peimbert, M., Rayo, J. F., Serrano, A. & Torres-Peimbert, S. 1979, A&A, 80, 155
- McMahon et al. (1994) McMahon, R. G., Omont, A., Bergeron, J., Kreysa, E., & Haslam, C. G. T. 1994, MNRAS, 267, L9
- Miley & De Breuck (2008) Miley, G., & De Breuck, C. 2008, A&A Rev., 15, 67
- Momjian et al. (2005) Momjian, E., Carilli, C. L., Petric, A. 2005 AJ, 129, 1809
- Momjian et al. (2007) Momjian, E., Carilli, C. L., Riechers, D. A., Walter, F. 2007 ApJ, 134, 694
- Narayanan et al. (2012) Narayanan, D., Krumholz, M. R., Ostriker, E. C., & Hernquist, L. 2012, MNRAS, 421, 3127
- Narayanan et al. (2015) Narayanan, D., Turk, M., Feldmann, R., et al. 2015, Nature, 525, 496
- Ohta et al. (1996) Ohta, K., Yamada, T., Nakanishi, K., Kohno, K., Akiyama, M., Kawabe, R. 1996, ApJ, 382, 426
- Ohta et al. (2000) Ohta, K., Matsumoto, T., Maihara, T., et al. 2000, PASJ, 52, 557
- Omont et al. (1996a) Omont, A., McMahon, R. G., Cox, P., et al. 1996, A&A, 315, 1
- Omont et al. (1996b) Omont A., Petitjean P., Guilloteau S., McMahon, R. G., Solomon, P. M., Pécontal, E. 1996, Nat 382, 428
- Perley & Butler (2013) Perley, R. A., & Butler, B. J. 2013, ApJS, 204, 19
- Petitjean et al. (1996) Petitjean, P., Pécontal, E., Valls-Gabaud, D., & Chariot, S. 1996, Nature, 380, 411
- Planck Collaboration et al. (2015) Planck Collaboration, Ade, P. A. R., Aghanim, N., et al. 2015, arXiv:1502.01589
- Renzini (2006) Renzini, A. 2006, ARA&A, 44, 141
- Riechers et al. (2006) Riechers, D. A., Walter, F., Carilli, C. L., Knudsen, K. K., Lo, K. Y. 2006, ApJ, 650, 604
- Riechers et al. (2008) Riechers, D. A., Walter, F., Carilli, C. L., Bertoldi, F., Momjian, E. 2008, ApJ, 686, L9
- Riechers et al. (2011) Riechers, D. A., Hodge, J., Walter, F., Carilli, C. L., & Bertoldi, F. 2011a, ApJ, 739, L31
- Riechers et al. (2011) Riechers, D. A., Carilli, C. L., Maddalena, R. J., et al. 2011b, ApJ, 739, L32
- Salomé et al. (2012) Salomé, P., Guélin, M., Downes, D., et al. 2012, A&A, 545, A57
- Sanders & Mirabel (1996) Sanders, D. B., & Mirabel, I. F. 1996, ARA&A, 34, 749
- Scoville (2012) Scoville, N. 2012, arXiv:1210.6990
- Shapley (2011) Shapley, A. E. 2011, ARA&A, 49, 525
- Shields et al. (2006) Shields, G. A., Menezes, K. L., Massart, C. A., & Vanden Bout, P. 2006, ApJ, 641, 683
- Spilker et al. (2015) Spilker, J. S., Aravena, M., et al. 2015, ApJ, 811, 124
- Stacey et al. (2010) Stacey, G. J., Hailey-Dunsheath, S., et al. 2010, ApJ, 724, 957
- Tacconi et al. (2008) Tacconi, L. J., Genzel, R., Smail, I., et al. 2008, ApJ, 680, 246
- Tacconi et al. (2013) Tacconi, L. J., Neri, R., Genzel, R., et al. 2013, ApJ, 768, 74
- Thompson et al. (2005) Thompson, T. A., Quataert, E., & Murray, N. 2005, ApJ, 630, 167
- Thompson & Krumholz (2014) Thompson, T. A., & Krumholz, M. R. 2014, arXiv:1411.1769
- van den Bosch et al. (2012) van den Bosch, R. C. E., Gebhardt, K., Gültekin, K., et al. 2012, Nature, 491, 729
- Wagg et al. (2010) Wagg, J., Carilli, C. L., Wilner, D. J., Cox, P., De Breuck, C. et al. 2010, A&A, 519, L1
- Wagg et al. (2012) Wagg, J., Wiklind, T., Carilli, C., Espada, D., Peck, A., et al. 2012, ApJ, 752, L30
- Wagg et al. (2014) Wagg, J., Carilli, C. L., Aravena, M., et al. 2014, ApJ, 783, 71
- Walter et al. (2004) Walter, F., Carilli, C., Bertoldi, F., et al. 2004, ApJ, 615, L17
- Wang et al. (2013) Wang, R., Wagg, J., Carilli, C. L., et al. 2013, ApJ, 773, 44
- Williams et al. (2014) Williams, R. J., Wagg, J., Maiolino, R., et al. 2014, MNRAS, 439, 2096
- Willott et al. (2015) Willott, C. J., Carilli, C. L., Wagg, J., & Wang, R. 2015, ApJ, 807, 180
- Yun et al. (1999) Yun, M. S., Scoville, N. Z., & Evans, A. S. 1999, Highly Redshifted Radio Lines, 156, 58
- Yun et al. (2000) Yun, M. S., Carilli, C. L., Kawabe, R., et al. 2000, ApJ, 528, 171
Appendix A Additional Eddington Limits
As another route to investigate if these sources are Eddington-limited, consider the basic Eddington luminosity criterion:
| (A1) |
which can be reduced to , in SI units. Switching the units of M, LEdd, and to solar masses, solar luminosities, and solar masses per kpc2, respectively, gives:
| (A2) |
(also given by equation 2 of Thompson & Krumholz 2014). Using the approximate gas or dynamical mass of each HyLIRG (10M⊙) and our approximate gas densities (10M⊙ kpc-2) gives L⊙. Since these sources have LL⊙, they are radiating at Eddington luminosity. Equation 20 of Thompson & Krumholz (2014), which gives the fraction of Eddington luminosity as a function of SFR and gas surface densities, returns a similar percentage. The source Ly-2 is also sub-Eddington, using its size limits and estimate area densities.