1\Yearpublication2016\Yearsubmission2016\Month0\Volume999\Issue0\DOIasna.201400000
XXXX
Multiwavelength and parsec-scale properties of extragalactic Jets
Abstract
Extragalactic jets originating from the central supermassive black holes of active galaxies are powerful, highly relativistic plasma outflows, emitting light from the radio up to the -ray regime. The details of their formation, composition and emission mechanisms are still not completely clear. The combination of high-resolution observations using very long baseline interferometry (VLBI) and multiwavelength monitoring provides the best insight into these objects. Here, such a combined study of sources of the TANAMI sample is presented, investigating the parsec-scale and high-energy properties. The TANAMI program is a multiwavelength monitoring program of a sample of the radio and -ray brightest extragalactic jets in the Southern sky, below declination. We obtain the first-ever VLBI images for most of the sources, providing crucial information on the jet kinematics and brightness distribution at milliarcsecond resolution. Two particular sources are discussed in detail: PMN J16034904, which can be classified either as an atypical blazar or a -ray loud (young) radio galaxy, and Centaurus A, the nearest radio-loud active galaxy. The VLBI kinematics of the innermost parsec of Centaurus A’s jet result in a consistent picture of an accelerated jet flow with a spine-sheath like structure.
keywords:
galaxies: active – galaxies: jets – multiwavelength observations – very long baseline interferometry – individual: Centaurus A – individual: PMN J160349041 Introduction
Active galactic nuclei (AGN) emit light across the whole electromagnetic spectrum, often dominating the emission of their host galaxy. Due to accretion onto the central supermassive black hole (SMBH), they can produce so-called “jets”, highly relativistic plasma outflows. They belong to the most fascinating objects in the Universe, but the underlying physics is still not fully understood. The knowledge is crucial in context of AGN feedback and multimessenger astronomy. Multiwavelength observations are useful tools to address open questions concerning the formation, acceleration and the mechanism(s) behind the broadband emission up to the highest energies.
Blazars are a subset of radio-loud AGN, where the jet is observed at a small angle to the line of sight, such that the jet emission is strongly Doppler boosted. They belong to the most luminous and highly variable sources (Urry 1996), typically showing superluminal motion in the pc-scale radio jet (e.g., Lister et al. 2013). With the detection of -ray emission of AGN jets by EGRET (Hartman et al. 1999) various models were considered in order to explain the broadband emission (e.g., Marscher & Gear 1985; Mannheim 1993; Sikora et al. 1994; Dermer et al. 1997; Dermer & Lott 2012; Böttcher et al. 2013, and many more). A typical radio to -ray SED of a blazar shows a double-humped spectral shape from the radio up to the -ray regime (Fossati et al. 1998). While the low-energy peak can be well explained by synchrotron emission, it is still discussed which emission processes are responsible for the high-energy peak. It is contentious whether it is due to synchrotron self-Compton up-scattering and/or inverse Compton scattering with external photons. Furthermore, the composition of the ejected plasma, leptons or hadrons or the combination of both, plays an important role in modeling the broadband emission. Single-zone leptonic models have been very successful in describing the broadband spectrum, however they fail to explain observations revealing rapid flaring and multiple emission zones. In that case models need to take the jet geometry into account (like spine-sheath configuration, e.g., Tavecchio & Ghisellini 2008). Hadronic models, on the other hand, attempt to explain the high-energy hump due to accelerated hadrons inducing pion-photo production resulting in a electromagnetic cascade.
The combination of simultaneous broadband data allows us to study the spectral energy distribution (SED) and the variability across the bands. This provides information on the different radiating components, e.g., the disk, broad line region or the jet, all together making up the overall spectrum. Since these sources show strong variability across all wavelengths, simultaneity of the data is essential, i.e., contemporaneous monitoring at different wavelengths is required.
In addition to the broadband spectral data, we use high-resolution radio data from Very Long Baseline Interferometry (VLBI). It is a unique tool to address the innermost regions of extragalactic jets at milliarcsecond (mas) scales. It provides the highest angular resolution and insights into regions close to the jet base where the high-energy emission is thought to be produced. VLBI images reveal the morphology of the jets at (sub-)pc scales. Typical blazar jet morphologies are compact or one-sided, while for larger jet inclination angles, where relativistic beaming effects are small, the jet and the counterjet can be detected (see, e.g., Kadler et al. 2004).
Most objects detected with the Large Area Telescope (LAT) onboard of the Fermi Gamma-ray Space Telescope are classified as blazars (Nolan et al. 2012; Acero et al. 2015). Only few of the so-called “misaligned” objects (radio galaxies) with jets seen edge-on (Abdo et al. 2010c) are bright in the -rays. However, these objects are of particular interest and challenge theoretical jet emission models, which typically explain the high-energy spectral component with high beaming factors. Their study can help to determine the -ray emission region(s) and to constrain emission models, because the broadband emission is less dominated by the beamed jet emission (Abdo et al. 2010b). In the radio regime, these misaligned objects can be divided into evolved (e.g., as Centaurus A or M 87) and young radio galaxies. The jets of the former have sizes up to several hundred kiloparsecs, while the latter are typically more compact and smaller than 1 kpc. Therefore, these sources are also called Compact Symmetric Objects (CSO, O’Dea 1998; Readhead et al. 1996b, a). Because of their intrinsic power, theoretical models predicted -ray emission from CSOs (Stawarz et al. 2008; Kino et al. 2007, 2009), but no detection is confirmed yet.
Here, the multiwavelength and VLBI study of extragalactic jets on the Southern Hemisphere is presented. This work was performed in the framework of the multiwavelength monitoring program TANAMI (Sect. 2). After a short introduction to the project and the sample results (Sect. 3), the properties of two particular sources are discussed, PMN J16034904 (Sect. 4) and Centaurus A (Sect. 5).
2 TANAMI - The multiwavelength monitoring program of extragalactic jets in the Southern Hemisphere
In 2007, the TANAMI111Tracking Active Galactic Nuclei with Austral Milliarcsecond Interferometry http://pulsar.sternwarte.uni-erlangen.de/tanami/ program started monitoring the brighest extragalactic jets in the Southern sky (below declination) using the combination of high-resolution VLBI observations at 8.4 and 22.3 GHz (Ojha et al. 2010) and corresponding radio monitoring with the Australian Compact Array (ATCA, Stevens et al. 2012) and the Ceduna telescope (Blanchard et al. 2012), in the optical/UV with Swift/UVOT and Rapid Eye Mount (Nesci et al. 2013), in the X-rays with Swift/XRT and all-sky observations at -rays by Fermi/LAT.
In addition, pointed observations for particular sources are conducted with XMM-Newton, Suzaku (see Sect. 4 and e.g., Müller et al. 2015b; Kreikenbohm et al. 2016) and INTEGRAL in the X-rays.
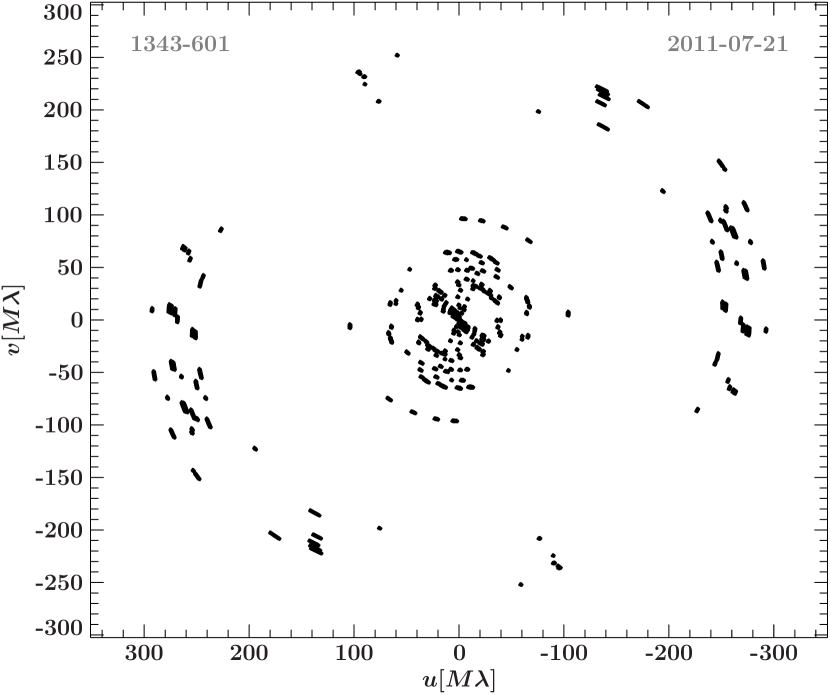
The TANAMI VLBI observations are performed with the Australian Long Baseline Array (LBA), including additional telescopes at NASA’s Deep Space Network (DSN) located at Tidbinbilla, the South-African Hartebeeshoeck antenna, the German Antarctic Receiving Station (GARS) in O’Higgins (Antarctica), and the Transportable Integrated Geodetic Observatory (TIGO) in Chile (Ojha et al. 2010). Since 2011, the -coverage (see as an example Fig. 1) at intermediate baselines is significantly improved by the Warkworth (New Zealand), Katherine and Yarragadee (Australia) antennas (Kadler et al. 2015). TANAMI observations typically have an angular resolution of about a few mas, down to less than 1 mas, with the largest baselines to the transoceanic antennas Hartebeeshoeck, TIGO and O’Higgins.
The VLBI data are recorded on the LBADRs (Long Baseline Array Disk Recorders) and correlated on the DiFX software correlator at Curtin University in Perth, Western Australia (Deller et al. 2007). The correlated data are inspected, edited and fringe fitted in AIPS (National Radio Astronomy Observatory’s Astronomical Image Processing System software; Greisen 2003). The amplitude calibration is performed using known flux values of prior observed sources. Hybrid imaging and subsequent model fitting is performed in the program DIFMAP (Shepherd 1997). For more details on the data reduction see Ojha et al. (2010), where we presented the first-epoch images of the intial sample.
The TANAMI sample of extragalactic jets was defined as a hybrid radio and -ray selected sample. Initially, it consisted of 43 objects, while to date 90 sources are regularly monitored. We aim to investigate the emission and formation mechanism of AGN jets. Our observational setup provides structural and spectral information at mas-scales, and, in addition, broadband spectral properties with time (Krauß et al. 2016). The long-term VLBI monitoring yields information on jet properties, such as apparent speed, inclination, opening angles, and structural changes with time. Furthermore, the dual-frequency approach provides spatial spectral index distributions of individual jet features. The simultaneous broadband observations address the jet activity and spectral changes across all wavelengths.
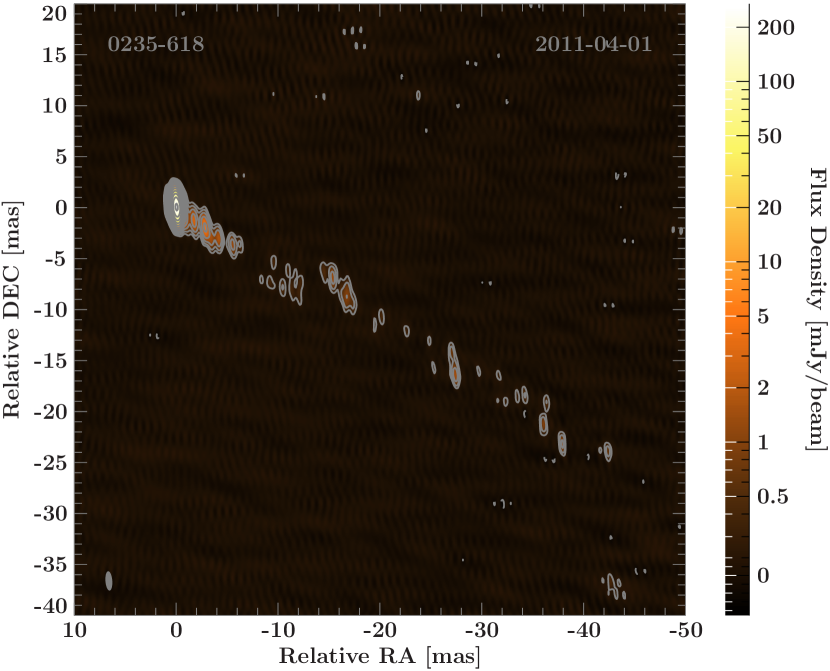
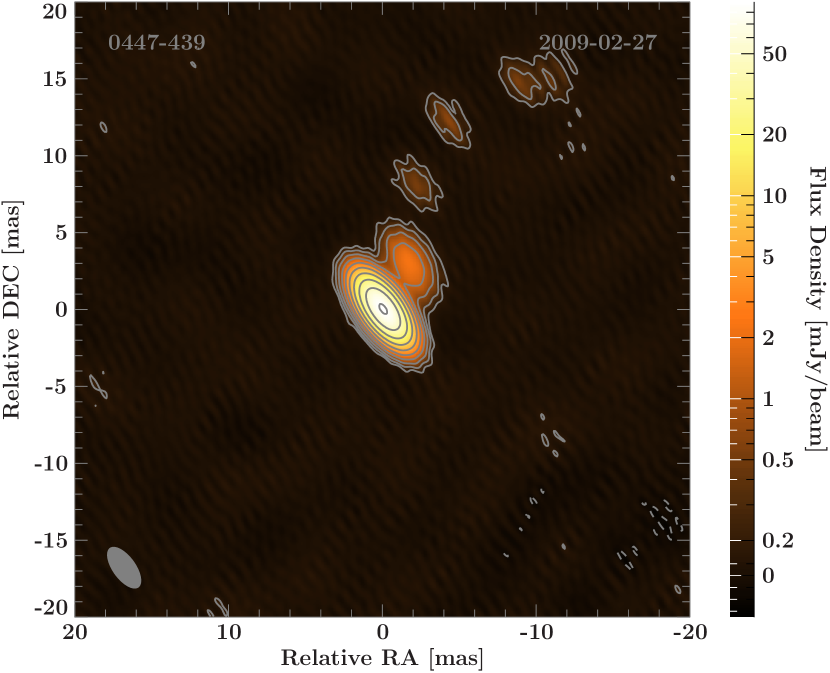
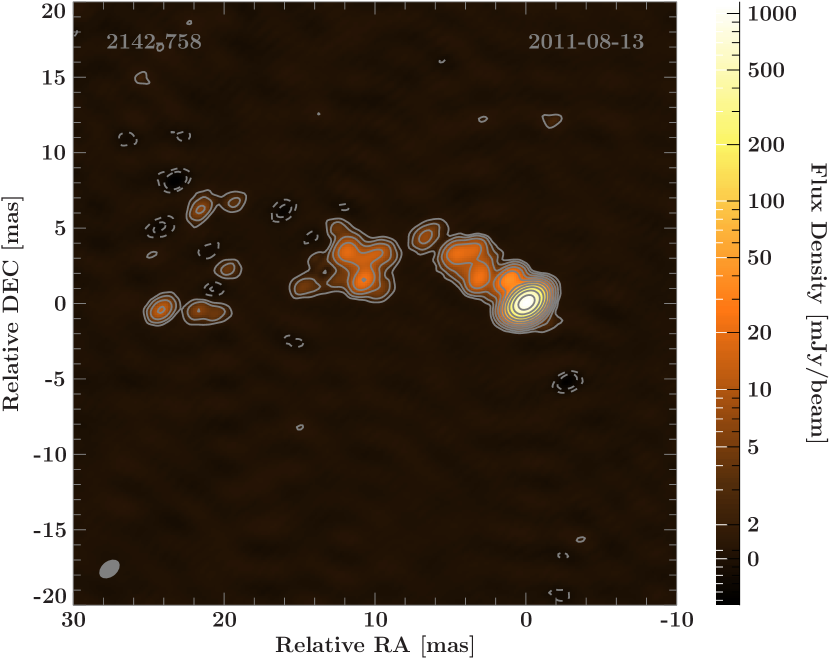
Since the start of TANAMI, new flat-spectrum radio sources have been added to the sample when associated with a -ray detection by Fermi/LAT. For most of these sources, TANAMI provides the first high-resolution VLBI images (Müller et al., in prep.). Figure 2 shows a selection of these mas-scale CLEAN images from 8 GHz VLBI observations.
We are particularly interested in the so called “radio-to-gamma-connection”, i.e., the correlation of high-energy emission with changes in pc-scale properties seen in jets. This is linked to the open question of the production sites and mechanisms of high-energy photons. Furthermore, the multiwavelength analysis enables us to study the broadband emission, to test different emission models, related to the composition of jets (e.g., Dutka et al. 2013).
Beyond that, TANAMI has a strong multimessenger component, trying to explain the high-energy neutrinos observed with IceCube and ANTARES with the broadband emission from -ray loud TANAMI blazars. The details can be found in Krauß et al. (2014), ANTARES Collaboration et al. (2015), and Kadler et al. (2016), as well as in Fritsch (2014), Fehn (2015) and Müller (2014), but it is beyond the scope of this paper.
3 Gamma-ray loudness and milliarcsecond-scale properties of TANAMI sources
Using one year of contemporaneous TANAMI VLBI and Fermi/LAT data, we addressed the high-energy properties and radio--correlation in our sample (Böck et al. 2016). We analyzed the radio and GeV -ray data obtained during the first 11 months of Fermi/LAT monitoring. More than 70% of the TANAMI sources are associated with -ray emitters detected by Fermi/LAT. Upper limits on the -ray flux were determined for the remaining sources, yielding three new significant detections, which were later confirmed by the Fermi/LAT team (Nolan et al. 2012).
We find increasing brightness temperatures of the radio cores, obtained from VLBI measurements, with 1 year average -ray luminosity. The -ray undetected sources have lower values and probably -ray luminosities close to the determined upper limits.
Comparing the morphologies of the -ray detected versus undetected TANAMI sources, we find that the -ray loud objects are generally more core dominated, i.e., are more compact and have a higher core-to-jet flux ratios (Müller et al., in prep.). These results are consistent with the general picture of strong Doppler boosting in -ray bright sources.
Most -ray sources in our sample show compact or one-sided jet morphologies. Two exceptional objects, PMN J16034904 and Centaurus A, are discussed in more detail in the following sections. Their double-sided222Note that, as in Ojha et al. (2010), we use the morphology classification scheme by Kellermann et al. (1998), classifying sources with the most compact component in the middle of the emission as double-sided, without taking spectral information into account. morphology and -ray loudness are in particular interesting and provide important insights into the jet physics.
4 The unusual jet source PMN J16034904
The radio source PMN J16034904 has been known as a calibrator source (PKS 160048) for Southern Hemisphere radio observations, but it attracted attention due to its association with one of the brightest, flat-spectrum -ray sources detected during the first few months of Fermi/LAT monitoring (Abdo et al. 2009; Kovalev 2009). Since then, it is is a bright, significantly detected -ray source (3FGL 1603.9–4903; Abdo et al. 2010a; Nolan et al. 2012; Acero et al. 2015; Ackermann et al. 2013, 2016). Based on sparse optical and broadband data, the source was classified as a low-synchrotron peaked BL Lac object without known redshift (Shaw et al. 2013).
Due to the high-confidence association of the known radio source with the -ray object 1FGL J1603.84903 (Abdo et al. 2010a), it was included in the TANAMI sample. The first VLBI observations were performed in 2009 and revealed unusual pc-scale properties (Müller et al. 2014a). This result triggered multiwavelength follow-up observations further questioning its classification as a blazar (Müller et al. 2015b; Goldoni et al. 2016). In the following these observations and their conclusions will be presented.
4.1 VLBI observations
The TANAMI 8 GHz VLBI observations of PMN J16034904 yielded the first image at mas-scale resolution of its radio morphology (Müller et al. 2014a). Since 2009 the source has been observed about twice a year at 8 GHz, with one (quasi-)simultaneous observation at 22 GHz in 2010 May. Figure 3 shows the mas-scale brightness distribution of the source at 8 GHz. It is almost symmetrical with a total correlated flux density of mJy. It is resolved and shows an East-West orientation (position angle of ) with three distinct emission features. The brightest, most compact component is located at the center, with a brightness temperature of K. Using spectral index information from combined 8 GHz and 22 GHz VLBI datasets, we concluded that this central component is the most plausible ‘core’ of PMN J16034904.
TANAMI monitoring reveals no significant proper motion of the Eastern and Western components. The source appearance as in Fig. 3 remains effectively constant. By modeling the source with three Gaussian emission regions, we find relative motions of (Müller et al. 2014a; Müller 2014), later confirmed by Hekalo (2015) using observations spanning four years.
4.2 Broadband spectrum and variability
The ATCA monitoring between 1 and 40 GHz reveals only very minor flux variability at higher frequencies. The ATCA spectral index of is consistent with the VLBI results for the Eastern and Western features. However, ATCA measures about 200 mJy more flux as detected with VLBI, possibly indicating a diffuse extended emission component which is resolved out by the TANAMI VLBI array.
Continuous monitoring by Fermi/LAT shows no major flaring activity as typically observed in blazar sources (Nolan et al. 2012; Acero et al. 2015). PMN J16034904 has been reported in both high-energy catalogs (1FHL, 2FHL Ackermann et al. 2013, 2016), being a potential candidate for detection in the TeV range by ground based Cherenkov telescopes.
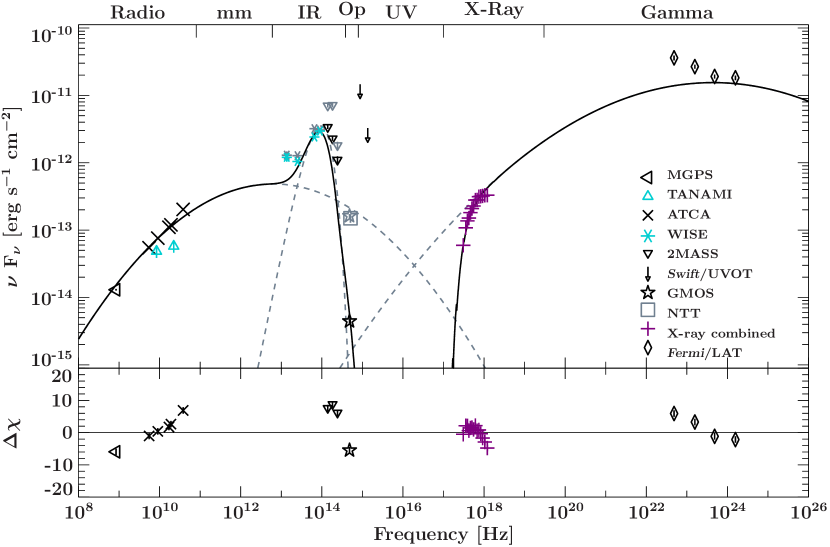
Using all available (including archival) multiwavelength data, we constructed a non-simultaneous broadband SED (see Fig. 5). It includes data from TANAMI VLBI and ATCA in the radio, 2MASS and WISE in the infrared, Swift/UVOT, GMOS and NTT in the optical, Swift/XRT, XMM-Newton, Suzaku in the X-rays and Fermi/LAT in the -rays. We parametrize the broadband spectrum with two logarithmic parabolas. In the infrared, we see a strong excess, which can be modeled with a black body spectrum.
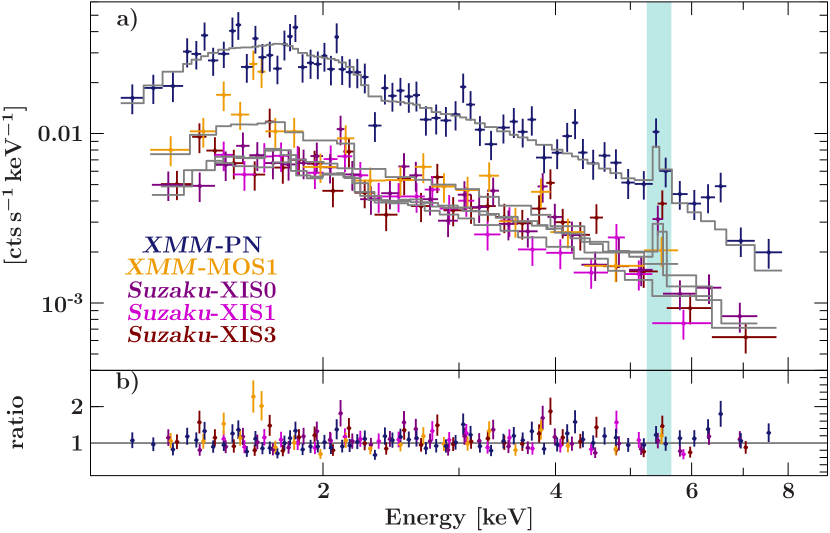
4.3 XMM and Suzaku results and follow-up VLT/X-shooter observations
In order to better constrain the X-ray spectrum than with Swift/XRT-only data, we performed XMM-Newton and Suzaku observations in 2013 (Müller et al. 2015b). The 2–10 keV spectrum (Fig. 4) was simultaneously modeled with an absorbed power-law component (, ), cross-calibration constants for the different detectors, and a Gaussian emission line at keV. We interpret this X-ray line as the most prominent emission line in AGN X-ray spectra, the Fe K fluorescence line with a restframe energy of 6.4 keV. Therefore, the redshift of PMN J16034904 can be determined to be . Adopting this redshift, the brightness distribution in the VLBI image (Fig. 3) has an extent of 46 pc.
Triggered by these intriguing results, Goldoni et al. (2016) observed PMN J16034904 with the UV-NIR VLT/X-shooter spectrograph in 2014. The optical continuum spectrum is mostly featureless, not compatible with a stellar origin, but likely non-thermal. Three emission lines are detected, allowing us to determine a redshift of . The spectral features do not follow the definition of a BL Lac object. The new redshift measurement implies that the X-ray emission line detected by XMM-Newton and Suzaku should be interpreted as a 6.7 keV line. This result is very peculiar, due to a missing 6.4 keV line and is possibly indicating that the 6.7 keV emission is due to collisionally ionised plasma, and merits further follow-up observations of PMN J16034904.
4.4 An unusual blazar or a -ray loud young radio galaxy?
PMN J16034904 has been classified as a BL Lac object, i.e., a jet source pointing towards the observer. The emission of these objects are dominated by relativistic beaming effects and spectral features like emission lines are usually outshined by the non-thermal jet emission. Furthermore, blazars are typically highly variable across the electromagnetic spectrum and VLBI measurements reveal compact, sometimes one-sided jet structures, showing high polarization and relativistic motion.
Compared to this, the VLBI and multiwavelength data of PMN J16034904 indicate very unsual properties for a blazar source. Our VLBI data show a symmetric brightness distribution on mas-scales, which is constant over 4 years of monitoring. The brightest component in the center has the flattest spectrum and highest brightness temperature values. We find no significant proper motion. Similarly, multiwavelength monitoring reveals no rapid flaring activity. Only long-term variability is reported at GeV energies (Ackermann et al. 2013; Acero et al. 2015) and ATCA monitoring over more than ten years shows some minor long timescale flux density variations at higher radio frequencies. ATCA data also give upper limits of % on the polarization (Murphy et al. 2010), though higher polarization fractions at VLBI scales cannot be excluded so far. The broadband SED shows an unexpected strong excess in the infrared and a significant X-ray spectral line and high intrinsic absorption. These are all features which are not observed in typical blazar spectra. Finally, the recent VLT/X-shooter data suggest a non-BL Lac nature.
This peculiar appearance of PMN J16034904 is questioning its blazar classification, hence, we consider alternative interpretations (Müller et al. 2014a), favouring a young radio galaxy seen at a larger angle to the line of sight. Its VLBI structure resembles a double-sided morphology as seen in FR I radio galaxies, but on smaller scales, i.e. a young version. These compact symmetric objects typically show low variability and polarization (Peck & Taylor 2000) and VLBI observations suggest that they are seen edge-on. Our multiwavelength data are in agreement with the young radio galaxy scenario. Adopting the measured redshift (Müller et al. 2015b; Goldoni et al. 2016) and assuming edge-on geometry, the source size probed by VLBI is well below the canonical limit for young radio sources of 1 kpc, while the ATCA data limits the total size to be less than 3 kpc.
Further multiwavelength data will help to substantiate this alternative classification. For example, VLBI monitoring can reveal opposed apparent motion, as expected for a jet-counterjet system. Low-frequency radio observations below 1 GHz can give important information about a potential spectral turnover, as expected for young radio sources.
If confirmed, PMN J16034904 will add to the class of misaligned -ray bright sources. Moreover, the confirmed detection of a -ray loud CSO would help to determine the location of the high-energy emission using broadband SED models.
5 Zooming into the closest radio-loud AGN: Centaurus A
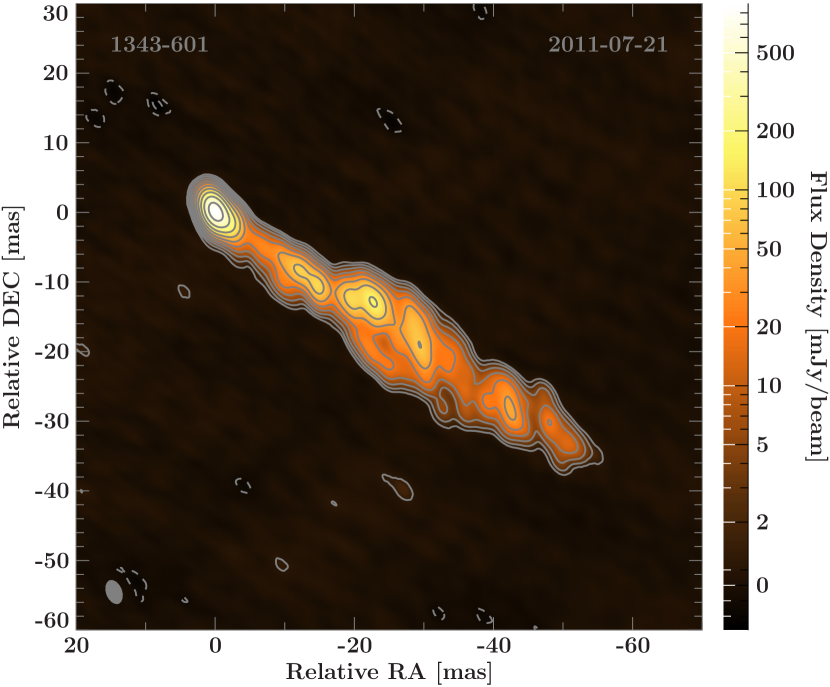
At a distance of only 3.8 Mpc (Harris et al. 2010), the radio galaxy Centaurus A (Cen A) is an ideal target to study the innermost region of an AGN and jet physics at highest linear resolutions (for a detailed review on this source see, e.g., Israel 1998). At this distance, an angular resolution of 1 milliarcsecond corrseponds to only 0.018 pc. Cen A is detected from the radio up to TeV energies (Aharonian et al. 2009) and considered as a source candidate of ultra-high energy cosmic rays (Clay et al. 2010) and extragalactic neutrinos (IceCube Collaboration et al. 2009).
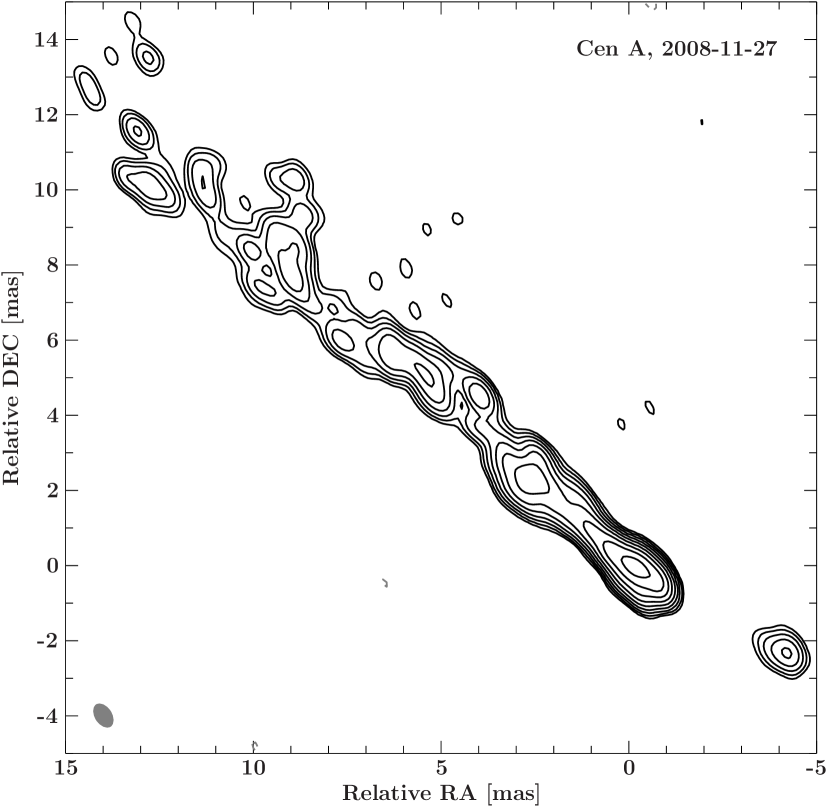
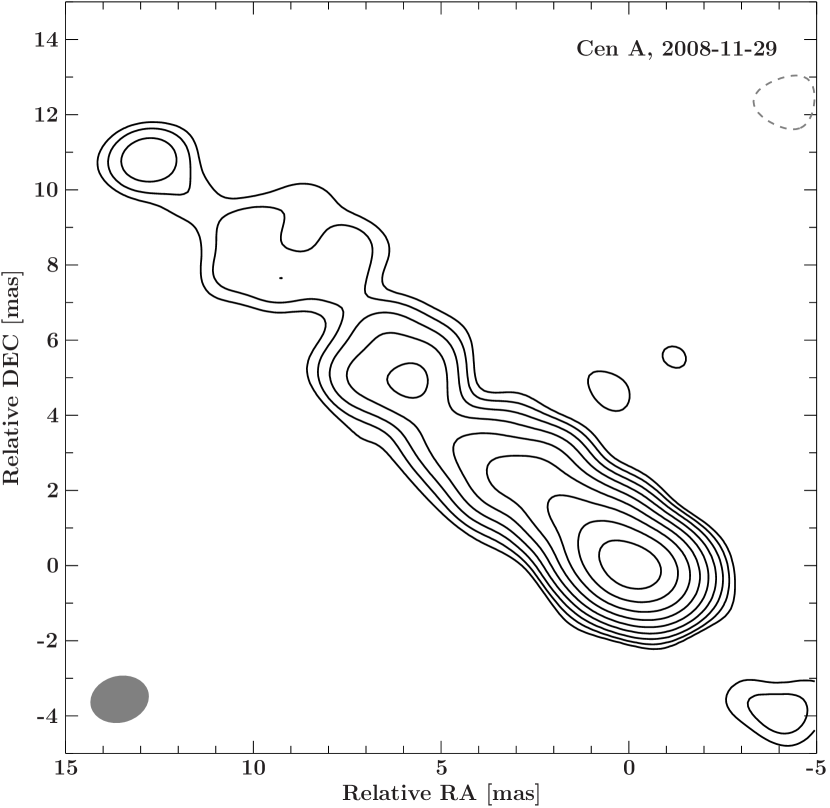
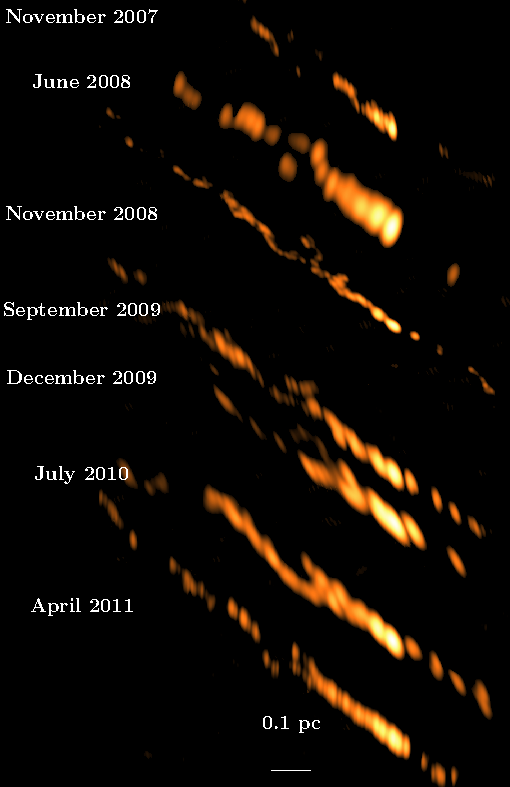
In the framework of the TANAMI program Cen A has been monitored about twice a year with VLBI at 8 GHz since 2007, including one simultaneous epoch at 22 GHz (Müller et al. 2014b, 2011). Our observations result in the highest resolved images of Cen A (down to 0.4 mas corresponding to 0.007 pc), allowing us to study the jet-counterjet system in unprecedented detail. Figure 6 shows the imaging results for the dual-frequency observation (Müller et al. 2011). Figure 7 shows the time evolution of the first seven 8 GHz images at natural weighting. Table 1 provides an overview of the observation logs for these observations and corresponding image parameters.
Here, a summary of the results from this VLBI monitoring is presented, based on the publications by Müller et al. (2011) and Müller et al. (2014b).
| Obs. Date & Frequency | Array Configurationa | b | RMSc | d | e | f | P.A.g |
| (yyyy-mm-dd) | (Jy beam-1) | (mJy beam-1) | (Jy) | (mas) | (mas) | (∘) | |
| natural weighting | |||||||
| 2007-11-10 (8.4 GHz) | PKS-HART-CD-HO-MP-AT | 0.60 | 2.61 | 1.64 | 0.41 | 8 | |
| 2008-06-09 (8.4 GHz) | PKS-HART-CD-HO-MP-AT | 1.06 | 3.11 | 2.86 | 1.18 | ||
| 2008-11-27 (8.4 GHz) | PKS-CD-HO-MP-AT-DSS43-TC-OH | 0.74 | 3.91 | 0.98 | 0.59 | 31 | |
| 2009-09-05 (8.4 GHz) | PKS-CD-HO-MP-AT-DSS43-TC-OH | 0.76 | 3.97 | 2.29 | 0.58 | 16 | |
| 2009-12-13 (8.4 GHz) | PKS-CD-HO-MP-AT-TC | 1.03 | 3.82 | 3.33 | 0.78 | 26 | |
| 2010-07-24 (8.4 GHz) | PKS-CD-HO-MP-AT-TC | 1.21 | 4.20 | 2.60 | 0.87 | 21 | |
| 2011-04-01 (8.4 GHz) | HART-CD-HO-MP-AT-DSS43-WW | 0.63 | 5.10 | 2.31 | 0.51 | ||
| uniform weighting | |||||||
| 2008-11-27 (8.4 GHz) | PKS-CD-HO-MP-AT-DSS43-TC-OH | 0.48 | 3.2 | 0.68 | 0.43 | 33 | |
| 2008-11-29 (22.3 GHz) | PKS-CD-HO-MP-AT-DSS43 | 1.46 | 3.3 | 1.55 | 1.21 |
a AT: Australia Telescope Compact Array, CD: Ceduna, HART: Hartebeesthoek, HO: Hobart, MP: Mopra, OH: GARS/O’Higgins, PKS: Parkes, TC: TIGO, TI: DSS43 - NASA’s Deep Space Network Tidbinbilla (70 m), WW: Warkworth; b-g image parameters: peak flux density, RMS noise, total flux density, major and minor axis and position angle of the restoring beam. We estimate a flux density uncertainty of 15%.
5.1 High-resolution imaging
The high-resolution images show a well collimated, straight jet with a small opening angle of (compared to the rapid broadening observed in M 87, Junor et al. 1999). The counterjet is significantly detected in all images. The jet is resolved in unprecedented detail and into distinct features. The emission is detected up to a maximum extent of 70 mas from the image phase center, i.e., TANAMI observations probe the inner parsec of Cen A with an angular resolution of less than 0.01 pc. The VLBI core of the jet is identified as the brightest feature. Next to the core, the second brightest, isolated jet component (at a distance of 3.5 mas) is found to be not moving and stable in flux. It can be identified with the stationary component discussed in Tingay et al. (2001). Extragalactic jets often show stationary components which can be explained as locally beamed emission or standing shocks (Lister et al. 2009). A possible interpretation of this feature is a local pressure enhancement (like a jet nozzle) or a cross-shock in the jet flow as observed in theoretical simulations of over-pressured jets (Mimica et al. 2009). Further (dual-frequency) VLBI monitoring is required to investigate this in detail.
5.2 The “tuning fork”
At a projected distance of 0.4 pc from the jet core, the VLBI images show a “tuning-fork” like structure, where the jet flow is interrupted and widens up, but remains collimated downstream. The brightness profile along the jet (see Fig. 3 in Müller et al. 2014b) shows a sharp gap. The surface brightness locally decreases and no positional change is observed, i.e., the feature remains stationary over the monitoring period. In Müller et al. (2014b), we discuss this feature and possible interpretations in detail. We conclude that while it resembles a recollimation shock, decelerating and separating the jet flow as seen in simulations by Perucho & Martí (2007), the overall structure is difficult to reconcile with this scenario. As a different explanation we consider a standing disturbance, causing an interaction with the jet. In particular, we discuss the penetration of a gas cloud or massive star. Simulations by Bosch-Ramon et al. (2012), describing jet-star interactions in AGN, show similar resulting bow-shock structures. Note that such interactions in Cen A’s jet have already been considered by Hardcastle et al. (2003) to explain the observed X-ray knots in the kpc-scale jet. We find that a red giant with a stellar wind of and a mass loss rate of could create an equilibrium condition, such that it can penetrate the jet flow without disruption. Detailed estimations and calculations can be found in Müller et al. (2014b).
In Müller et al. (2015a), we discuss the consequences of such an interaction event. Theoretical simulations expect -rays from the collision of a red giant or a massive object with the jet plasma (Araudo et al. 2013; Khangulyan et al. 2013; Bosch-Ramon et al. 2012; Barkov et al. 2010), producing variability on short time scales of hours to days. Cen A is a bright -ray source, but it shows no significant variability (Abdo et al. 2010b; Acero et al. 2015). We estimate that this persistent emission could be partly produced by multiple jet-star-interaction events.
5.3 Sub-parsec scale jet kinematics
The time evolution of the pc-scale jet of Cen A had been well studied over a period of about twelve years by Tingay et al. (1998, 2001). Tracking two moving components, they determined an apparent speed of (corresponding to ). The 3.5 years of TANAMI monitoring allow us to study Cen A’s jet in more detail. With about ten times better angular resolution we can resolve the innermost parsec of the jet into multiple individual components. The time evolution of the jet is presented in Fig. 7.
To parametrize and track the individual jet features, we use the modelfit task in DIFMAP (Shepherd 1997) to fit Gaussian emission model components to the self-calibrated visibility data. Figure 6 in Müller et al. (2014b) shows the kinematics, i.e., the time dependent seperation of each component from the core. A linear regression fit gives the proper motion for each component in mas/yr. As an illustration of the plasma motion in the jet, we produced a movie using the individual VLBI images interpolated in time (Fig. 7), as reported in Kadler et al. (2015). It can be accessed at http://www.aip.de/AN/movies.
Besides the core and the stationary component next to it, we can identify eight moving components showing a range of speeds from to , with a mean apparent speed of . Using the tapered visibility data we can show (Müller et al. 2014b) that this result is consistent with the previous measurements by Tingay et al. (1998, 2001). Furthermore the comparison of the naturally weighted and tapered images show that we can interpret this as an underlying jet flow with faster substructure.
We further find that the outer components have higher apparent speeds than the ones closer to the core, i.e., showing apparent acceleration downstream. This result connects to the speed of measured at 100 pc from the core by Hardcastle et al. (2003), already suggesting intrinsic acceleration from pc to kpc scales. Furthermore, this region coincides with the optically thin part of the jet (Müller et al. 2011). This correlation can naturally be explained in the context of a spine-sheath structure of the jet: a faster, inner spine, surrounded by a slower sheath. The larger speeds measured in optically thin regions would correspond to the faster spine.
With the derived apparent speeds and the flux density jet-to-counterjet ratios from the individual and stacked images, we can set constraints on the intrinsic jet speed and jet inclination angle (see also Fig. 9 in Müller et al. 2014b), following:
| (1) |
and
| (2) |
with the apparent speed , the brightness ratio of the approaching jet to the counterjet, the inclination angle , the intrinsic speed , and the spectral index .
TANAMI observations limit the intrinsic jet speed to and the angle to the line of sight to . The upper limits for the inclination angle are consistent within the uncertainties with the results for the pc-scale jet from Jones et al. (1996) and Tingay et al. (1998), but our limits better match the results by Hardcastle et al. (2003) at larger scales. We find that a change of the angle to the line of sight cannot explain the difference in speed. Therefore, the larger speed at kpc scales can consistently be explained by intrinsic acceleration.
5.4 On the high-energy emission origin
Cen A is bright across the electromagnetic spectrum with a blazar-like broadband SED of its core emission. The high-energy emission has been extensively studied, but the origin and mechanism(s) are still debated. The radio to -ray emission can be well described by a single-zone synchrotron self-compton model (Abdo et al. 2010b), but it fails to model the (non-simultaneous) TeV emission. In order to better constrain theoretical models, we need to disentangle the individual emission components and study them in detail.
In Müller et al. (2011), we presented the first dual-frequency observation resulting in the first sub-pc scale spectral index map for this source. The spectral index changes along the jet from flat/inverted in the core, to steep further downstream. The central part of the jet-counterjet region indicates free-free absorption as previously discussed by Tingay & Murphy (2001). The spectral index distribution along the jet shows multiple bright, compact, and optically thick regions, which can be interpreted as possible production sites of highly energetic photons. As the origin of the -ray emission in extragalactic jets is still debated, this result suggests that multi-zone emission models need to be considered.
Furthermore the origin of the hard X-ray emission is still not clear. Several results indicate the jet as the possible origin (Tingay et al. 1998; Fukazawa et al. 2011; Beckmann et al. 2011). In Tingay et al. (1998) the coincidence of two ejection events with X-ray high-flux states are discussed, suggesting a relation of jet and X-ray activity. Following this study, we use archival X-ray monitoring data by Swift/BAT, RXTE/ASM, RXTE/PCA, CGRO/BATSE, and the 90-350 GHz lightcurve from SEST (Israel et al. 2008) to compare to the VLBI flux density variability at 8 GHz from Tingay et al. (2001) and TANAMI monitoring (see Fig. 10 in Müller et al. 2014b). The analysis of the jet kinematics using TANAMI data revealed two new components ejected into the jet during the 3.5 year monitoring period. Their ejection time can be estimated to be between 2007 and 2009. We find a partial overlap of higher X-ray activity and these jet ejections, although we cannot claim a common origin based on this result; more correlated events need to be found.
Recently, Fürst et al. (2016) performed a detailed study of the 3–78 keV emission using simultaneous observations by NuSTAR and XMM-Newton. The sub-arcmin imaging with NuSTAR results in no evidence for a jet detection above 10 keV . The combined spectrum can be fitted either with an absorbed power-law component () or a single-temperature Comptonization spectrum, and an additional flourescent Fe K emission line. The physical origin of the observed hard X-ray spectrum is discussed in detail, concluding that the emission can be explained by synchrotron self-Compton emission from the inner jet or by an advection-dominated accretion flow or a combination of both. Further multi-epoch, multiwavelength observations will help us to disentangle these scenarios.
6 Conclusion and Outlook
It has been discussed how combined multiwavelength and VLBI studies of extragalactic jets can shed light on the physics of these powerful objects. These observations provide both, monitoring of source activity and changes in the spectrum as well as highly resolved images of the innermost regions, where the power is thought to be released.
The monitoring of the TANAMI program is set up to address open questions in jet physics. Two TANAMI sources have been studied in great detail, namely PMN J16034904 and Cen A. Both sources present ideal objects to study the high-energy emission and formation of jets.
PMN J16034904 is one of the brightest sources in the -ray sky, but shows no major flaring activity. Its unusual broadband properties question its classification as a blazar and open room for an alternative interpretation. Future observations can confirm the CSO classification. Only recently Migliori et al. (2016) presented the first -ray detection of a confirmed CSO (PKS 1718-649). Since PMN 1603-4904 has a hard -ray spectrum, it is a likely candidate source for TeV instruments like H.E.S.S. or in future CTA, and therefore it could play an important role in investigating the high-energy properties in misaligned sources.
The sub-pc scale imaging of Cen A provides unprecedented insights into the properties of the inner region of an AGN jet. We observe complex jet dynamics, which, together with long-term light curves can help to constrain SED model parameters. The overall jet structure can be well explained by a spine-sheath configuration. Connecting our results for the pc-scale jet and the observations at hundreds of parsecs requires intrinsic acceleration between these scales. Individual jet features can be studied in detail. The jet widening at a distance of 0.4 pc from the core could arise from a jet-star interaction.
Thanks to the recent developments in VLBI at millimeter wavelengths (mm-VLBI), we will be able to further study southern extragalactic jets at even higher angular resolution. Future mm-VLBI observations will include the Atacama Large Millimeter Array (ALMA) in Chile, providing for the first time enough sensitivity and suitable -coverage to image sources below declination at millimeter wavelengths. In particular Cen A presents an ideal target due to its proximity, such that we can obtain insights into regions that are self-absorbed at longer wavelengths and are located even closer to the jet base.
Acknowledgements.
I thank the committee of the German Astronomical Society for awarding me with the Doctoral Thesis Prize 2015. I thank Matthias Kadler, Jörn Wilms, and Roopesh Ojha for their support, and all collaborators of the TANAMI, Fermi/LAT and ANTARES teams for the fruitful discussions and cooperation. Special thanks to Robert Schulz and Felicia Kraußfor proofreading the manusscript, and to all colleagues of the Remeis Observatory in Bamberg, at ECAP in Erlangen, and at the Chair of Astronomy in Würzburg for the inspiring working environment. I acknowledge the funding through a PhD fellowship from the Studienstiftung des Deutschen Volkes and the support of the Bundesministerium für Wirtschaft und Technologie (BMWi) through the Deutsches Zentrum für Luft- und Raumfahrt (DLR) grant 50OR1404. This research has made use of a collection of ISIS scripts provided by the Dr. Karl Remeis observatory, Bamberg, Germany, at http://www.sternwarte.uni-erlangen.de/isis/. The Long Baseline Array and Australia Telescope Compact Array are part of the Australia Telescope National Facility, which is funded by the Commonwealth of Australia for operation as a National Facility managed by CSIRO.References
- Abdo et al. (2010a) Abdo, A. A., Ackermann, M., Ajello, M., et al. 2010a, ApJS, 188, 405
- Abdo et al. (2009) Abdo, A. A., Ackermann, M., Ajello, M., et al. 2009, ApJ, 700, 597
- Abdo et al. (2010b) Abdo, A. A., Ackermann, M., Ajello, M., et al. 2010b, ApJ, 719, 1433
- Abdo et al. (2010c) Abdo, A. A., Ackermann, M., Ajello, M., et al. 2010c, ApJ, 720, 912
- Acero et al. (2015) Acero, F., Ackermann, M., Ajello, M., et al. 2015, ApJS, 218, 23
- Ackermann et al. (2013) Ackermann, M., Ajello, M., Allafort, A., et al. 2013, ApJS, 209, 34
- Ackermann et al. (2016) Ackermann, M., Ajello, M., Atwood, W. B., et al. 2016, ApJS, 222, 5
- Aharonian et al. (2009) Aharonian, F., Akhperjanian, A. G., Anton, G., et al. 2009, ApJL, 695, L40
- ANTARES Collaboration et al. (2015) ANTARES Collaboration, Adrián-Martínez, S., Albert, A., et al. 2015, A&A, 576, L8
- Araudo et al. (2013) Araudo, A. T., Bosch-Ramon, V., & Romero, G. E. 2013, MNRAS, 436, 3626
- Barkov et al. (2010) Barkov, M. V., Aharonian, F. A., & Bosch-Ramon, V. 2010, ApJ, 724, 1517
- Beckmann et al. (2011) Beckmann, V., Jean, P., Lubiński, P., Soldi, S., & Terrier, R. 2011, A&A, 531, A70+
- Blanchard et al. (2012) Blanchard, J. M., Lovell, J. E. J., Ojha, R., et al. 2012, A&A, 538, A150
- Böck et al. (2016) Böck, M., Kadler, M., Müller, C., et al. 2016, A&A, 590, A40
- Bosch-Ramon et al. (2012) Bosch-Ramon, V., Perucho, M., & Barkov, M. V. 2012, A&A, 539, A69
- Böttcher et al. (2013) Böttcher, M., Reimer, A., Sweeney, K., & Prakash, A. 2013, ApJ, 768, 54
- Clay et al. (2010) Clay, R. W., Whelan, B. J., & Edwards, P. G. 2010, PASA, in press
- Deller et al. (2007) Deller, A. T., Tingay, S. J., Bailes, M., & West, C. 2007, PASP, 119, 318
- Dermer & Lott (2012) Dermer, C. & Lott, B. 2012, Journal of Physics Conference Series, 355, 012010
- Dermer et al. (1997) Dermer, C. D., Sturner, S. J., & Schlickeiser, R. 1997, ApJS, 109, 103
- Dutka et al. (2013) Dutka, M. S., Ojha, R., Pottschmidt, K., et al. 2013, ApJ, 779, 174
- Fehn (2015) Fehn, K. 2015, PhD thesis, Friedrich-Alexander-Universität, Erlangen-Nürnberg, Germany, 2015
- Fossati et al. (1998) Fossati, G., Maraschi, L., Celotti, A., Comastri, A., & Ghisellini, G. 1998, MNRAS, 299, 433
- Fritsch (2014) Fritsch, U. 2014, PhD thesis, Friedrich-Alexander-Universität, Erlangen-Nürnberg, Germany, in prep.
- Fukazawa et al. (2011) Fukazawa, Y., Hiragi, K., Yamazaki, S., et al. 2011, ApJ, 743, 124
- Fürst et al. (2016) Fürst, F., Müller, C., Madsen, K. K., et al. 2016, ApJ, 819, 150
- Goldoni et al. (2016) Goldoni, P., Pita, S., Boisson, C., et al. 2016, A&A, 586, L2
- Greisen (2003) Greisen, E. W. 2003, Information Handling in Astronomy - Historical Vistas, 285, 109
- Hardcastle et al. (2003) Hardcastle, M. J., Worrall, D. M., Kraft, R. P., et al. 2003, ApJ, 593, 169
- Harris et al. (2010) Harris, G. L. H., Rejkuba, M., & Harris, W. E. 2010, PASA, 27, 457
- Hartman et al. (1999) Hartman, R. C., Bertsch, D. L., Bloom, S. D., et al. 1999, ApJS, 123, 79
- Hekalo (2015) Hekalo, A. 2015, Bachelor’s thesis, Univ. Wuerzburg, Germany
- IceCube Collaboration et al. (2009) IceCube Collaboration, Abbasi, R., Abdou, Y., Abu-Zayyad, T., et al. 2009, Physical Review Letters, 103, 221102
- Israel (1998) Israel, F. P. 1998, A&ARv, 8, 237
- Israel et al. (2008) Israel, F. P., Raban, D., Booth, R. S., & Rantakyrö, F. T. 2008, A&A, 483, 741
- Jones et al. (1996) Jones, D. L., Tingay, S. J., Murphy, D. W., et al. 1996, ApJL, 466, L63
- Junor et al. (1999) Junor, W., Biretta, J. A., & Livio, M. 1999, Nat, 401, 891
- Kadler et al. (2016) Kadler, M., Krauß, F., Mannheim, K., et al. 2016, Nature Physics
- Kadler et al. (2015) Kadler, M., Ojha, R., & TANAMI Collaboration. 2015, Astronomische Nachrichten, 336, 499
- Kadler et al. (2004) Kadler, M., Ros, E., Lobanov, A. P., Falcke, H., & Zensus, J. A. 2004, A&A, 426, 481
- Katsuta et al. (2013) Katsuta, J., Tanaka, Y. T., Stawarz, Ł., et al. 2013, A&A, 550, A66
- Kellermann et al. (1998) Kellermann, K. I., Vermeulen, R. C., Zensus, J. A., & Cohen, M. H. 1998, AJ, 115, 1295
- Khangulyan et al. (2013) Khangulyan, D. V., Barkov, M. V., Bosch-Ramon, V., Aharonian, F. A., & Dorodnitsyn, A. V. 2013, ApJ, 774, 113
- Kino et al. (2009) Kino, M., Ito, H., Kawakatu, N., & Nagai, H. 2009, MNRAS, 395, L43
- Kino et al. (2007) Kino, M., Kawakatu, N., & Ito, H. 2007, MNRAS, 376, 1630
- Kovalev (2009) Kovalev, Y. Y. 2009, ApJL, 707, L56
- Krauß et al. (2014) Krauß, F., Kadler, M., Mannheim, K., et al. 2014, A&A, 566, L7
- Krauß et al. (2016) Krauß, F., Wilms, J., Kadler, M., et al. 2016, A&A, 591, A130
- Kreikenbohm et al. (2016) Kreikenbohm, A., Schulz, R., Kadler, M., et al. 2016, A&A, 585, A91
- Lister et al. (2009) Lister, M. L., Aller, H. D., Aller, M. F., et al. 2009, AJ, 137, 3718
- Lister et al. (2013) Lister, M. L., Aller, M. F., Aller, H. D., et al. 2013, AJ, 146, 120
- Mannheim (1993) Mannheim, K. 1993, A&A, 269, 67
- Marscher & Gear (1985) Marscher, A. P. & Gear, W. K. 1985, ApJ, 298, 114
- Migliori et al. (2016) Migliori, G., Siemiginowska, A., Sobolewska, M., et al. 2016, ApJL, 821, L31
- Mimica et al. (2009) Mimica, P., Aloy, M.-A., Agudo, I., et al. 2009, ApJ, 696, 1142
- Müller (2014) Müller, C. 2014, PhD thesis, Friedrich-Alexander-Universität, Erlangen-Nürnberg, Germany
- Müller et al. (2015a) Müller, C., Kadler, M., Mannheim, K., et al. 2015a, EVN 2014 Proceedings, arXiv:1502.02879
- Müller et al. (2014a) Müller, C., Kadler, M., Ojha, R., et al. 2014a, A&A, 562, A4
- Müller et al. (2014b) Müller, C., Kadler, M., Ojha, R., et al. 2014b, A&A, 569, A115
- Müller et al. (2011) Müller, C., Kadler, M., Ojha, R., et al. 2011, A&A, 530, L11
- Müller et al. (2015b) Müller, C., Krauß, F., Dauser, T., et al. 2015b, A&A, 574, A117
- Murphy et al. (2007) Murphy, T., Mauch, T., Green, A., et al. 2007, MNRAS, 382, 382
- Murphy et al. (2010) Murphy, T., Sadler, E. M., Ekers, R. D., et al. 2010, MNRAS, 402, 2403
- Nesci et al. (2013) Nesci, R., Tosti, G., Pursimo, T., Ojha, R., & Kadler, M. 2013, A&A, 555, A2
- Nolan et al. (2012) Nolan, P. L., Abdo, A. A., Ackermann, M., et al. 2012, ApJS, 199, 31
- O’Dea (1998) O’Dea, C. P. 1998, PASP, 110, 493
- Ojha et al. (2010) Ojha, R., Kadler, M., Böck, M., et al. 2010, A&A, 519, A45
- Peck & Taylor (2000) Peck, A. B. & Taylor, G. B. 2000, ApJ, 534, 90
- Perucho & Martí (2007) Perucho, M. & Martí, J. M. 2007, MNRAS, 382, 526
- Readhead et al. (1996a) Readhead, A. C. S., Taylor, G. B., Pearson, T. J., & Wilkinson, P. N. 1996a, ApJ, 460, 634
- Readhead et al. (1996b) Readhead, A. C. S., Taylor, G. B., Xu, W., et al. 1996b, ApJ, 460, 612
- Shaw et al. (2013) Shaw, M. S., Romani, R. W., Cotter, G., et al. 2013, ApJ, 764, 135
- Shepherd (1997) Shepherd, M. C. 1997, in Astronomical Data Analysis Software and Systems VI, ed. G. Hunt & H. Payne, ASP Conf. Proc. 125, 77
- Sikora et al. (1994) Sikora, M., Begelman, M. C., & Rees, M. J. 1994, ApJ, 421, 153
- Stawarz et al. (2008) Stawarz, L., Ostorero, L., Begelman, M. C., et al. 2008, ApJ, 680, 911
- Stevens et al. (2012) Stevens, J., Edwards, P. G., Ojha, R., et al. 2012, in Proceedings of Fermi & Jansky: Our Evolving Understanding of AGN, St. Michaels, MD, 2011, ed. R. Ojha, D. Thompson & C. Dermer, eConf Proceedings C1111101
- Tavecchio & Ghisellini (2008) Tavecchio, F. & Ghisellini, G. 2008, MNRAS, 385, L98
- Tingay et al. (1998) Tingay, S. J., Jauncey, D. L., Reynolds, J. E., et al. 1998, AJ, 115, 960
- Tingay & Murphy (2001) Tingay, S. J. & Murphy, D. W. 2001, ApJ, 546, 210
- Tingay et al. (2001) Tingay, S. J., Preston, R. A., & Jauncey, D. L. 2001, AJ, 122, 1697
- Urry (1996) Urry, C. M. 1996, in Astronomical Society of the Pacific Conference Series, Vol. 110, Blazar Continuum Variability, ed. H. R. Miller, J. R. Webb, & J. C. Noble, 391