ALMACAL II: Extreme star-formation-rate densities in a pair of dusty starbursts at revealed by ALMA 20-milliarcsec resolution imaging
Abstract
We present ALMA ultra–high–spatial resolution ( or ) observations of dust continuum at and in a pair of submm galaxies (SMGs) at , ALMACAL–1 (A–1: ) and ALMACAL–2 (A–2: ). These are the brightest and most luminous SMGs discovered so far in ALMACAL, a wide and deep (sub)mm survey, which is being carried out in ALMA calibrator fields and currently contains observations at sub-arcsec resolution down to an of in more than 250 calibrators fields. The spectroscopic redshifts of A–1 and A–2 have been confirmed via serendipitous detection of up to nine emission lines, in three different ALMA bands. Our ultra-high-spatial resolution data reveal that about half of the star formation in each of these starbursts is dominated by a single compact clump (FWHM size of ). This structure is confirmed by independent datasets at and . In A–1, two additional, fainter clumps are found. The star-formation rate (SFR) surface densities of all these clumps are extremely high, to , the highest found in high-redshift galaxies. There is a small probability that A–1 and A–2 are the lensed components of a background source gravitationally amplified by the blazar host. If this was the case, the effective radius of the dusty galaxy in the source plane would be , and the de-magnified SFR surface density would be , comparable with the eastern nucleus of Arp 220. Despite being unable to rule out an AGN contribution, our results suggest that a significant percentage of the enormous far-IR luminosity in some dusty starbursts is concentrated in very small star-forming regions. The high in our pair of SMGs could only be measured thanks to the ultra–high–resolution ALMA observations used in this work, demonstrating that long-baseline observations are essential to study and interpret the properties of dusty starbursts in the early Universe.
Subject headings:
galaxy evolution; sub–mm galaxies; dust emission; ALMACAL1. Introduction
Two decades ago, the first large format bolometer cameras on single-dish submm telescopes discovered a population of galaxies that were forming stars at tremendous rates, the so-called submm galaxies (SMGs, Smail et al., 1997; Barger et al., 1998; Hughes et al., 1998; Blain et al., 2002). Later, it was reported that these starbursts were predominantly at high redshift, (Chapman et al., 2005; Simpson et al., 2014). One of the main problems of these single-dish submm observations is their large beams, typically . This complicates the multi-wavelength counterpart identification in the absence of higher-resolution (sub)mm follow-up and prevents us from studying the morphology of dust emission, needed to help interpret the properties of the ISM in dusty starbursts.
Interferometric observations at arcsec and sub-arcsec resolution revealed that most SMGs are major mergers, both from morphological and kinematics arguments (e.g. Tacconi et al., 2008; Engel et al., 2010). Building on early indications from radio imaging (Ivison et al., 2007), ALMA revealed that single-dish submm sources are normally resolved into several distinct components (Karim et al., 2013; Hodge et al., 2013), although it is not clear that all of them are at the same redshift and, therefore, physically associated. Based on limited ALMA data, Ikarashi et al. (2015) reported that the dust in SMGs at is confined to a relatively compact region, with a FWHM size of or . This average value is compatible with the size of SMGs at slightly lower redshifts reported in Simpson et al. (2015). Due to the still modest spatial resolution in those works, it was not possible to explore any sub-galactic structure within the SMGs. Using observations at higher spatial resolution (), Oteo et al. (2016a) studied the morphology of two interacting starbursts at . The small beam size resolved the internal structure of the two sources, and revealed that the dust emission is smoothly distributed on scales, in contrast with the more irregular [CII] emission.
Analysing strongly lensed sources offers an alternative to high-spatial-resolution observations (Swinbank et al., 2010; Negrello et al., 2010; Bussmann et al., 2013, 2015). Arguably, the best example is the ALMA study for SDP.81 (ALMA Partnership et al., 2015), a strongly lensed starburst at (Negrello et al., 2014; Dye et al., 2014; Frayer et al., 2011) selected from the Herschel-ATLAS (Eales et al., 2010). Dye et al. (2015) modelled the lensed dust and CO emission of SDP.81 (see also Rybak et al., 2015a, b) and the dynamical analysis presented in Swinbank et al. (2015) revealed that SDP.81 comprises at least five star-forming clumps, which are rotating with a disk-like velocity field. However, with lensed galaxies the results (specially those lensed by galaxy-scale potential wells) must rely on accurate lens modeling ensuring that all the recovered source-plane emission is real and not an artifact of the modeling itself. Furthermore, and importantly, even relatively bright intrinsic emission can lie below the detection threshold if the geometry is not favourable, giving a misleading picture.
Thanks to the unique sensitivity and long-baseline capabilities of ALMA, ultra-high-spatial resolution observations can be carried out, for the first time, in unlensed FIR-bright sources. In this work we present ultra-high-spatial resolution observations () in a pair of submm galaxies (SMGs) at selected from ALMACAL (Oteo et al., 2016b). The main difference between our and previous work (Simpson et al., 2015; Ikarashi et al., 2015) is the use of a significant number of very long baselines, providing better spatial resolution. Furthermore, our in-field calibrator and subsequent self-calibration ensures near-perfect phase stability on the longest baselines. Additionally, we have two independent datasets in ALMA band 6 (B6) and band 7 (B7), which prove the reliability of the structure we see.
The paper is structured as follows: §2 presents the data set used in this work. §3 presents the redshift confirmation of our two sources and their FIR SED. In §4 we discuss the morphology of the dust emission in our sources at or resolution. Finally, §5 summarizes the main conclusions of the paper. A Salpeter (1955) IMF is assumed to derive star-formation rates (SFRs). assume a flat universe with . For this cosmology, the angular scale is per arcsec at , the redshift of the sources under study.


2. Data set: ALMACAL
Using ALMA calibration data we are carrying out a wide and deep (sub)mm survey, ALMACAL. The strategy of the survey and the details of data calibration and source extraction can be found in Oteo et al. (2016b). Briefly, our survey takes advantages of the huge amount of ALMA calibration data, which are routinely acquired during the execution of ALMA science projects. Combining compatible data for different calibrators it is possible to cover areas large enough and r.m.s. levels low enough to enable the detection of faint SMGs.
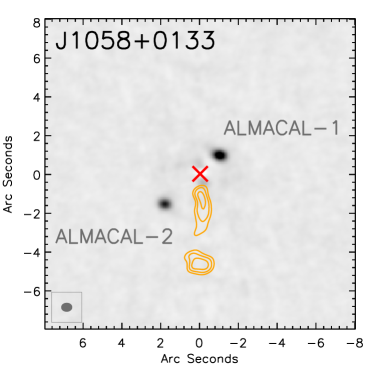
At the present stage of the survey we are reaching noise levels down to at sub-arc resolution in more than 250 calibrator fields, representing an area of more than 20 sq arcmin (Oteo et al. in prep). We focus this paper on the two SMGs found around the calibrator J1058+0133: ALMACAL–1 (A–1) and ALMACAL–2 (A–2), see Figure 1), which are the brightest SMGs found so far in ALMACAL.
The ALMACAL data used in this work can be classified in two different groups according to the spatial resolution they provide. On one hand we use mid–spatial–resolution data (beam sizes typically larger than ) which are part of the automated ALMACAL data extraction and calibration and are used to measure the unresolved dust continuum emission in our two SMGs and to look for emission lines to confirm their redshift (see §3). Due to their compact nature, A–1 and A–2 remain unresolved in the mid-resolution data.
In addition, and with the aim of studying the morphology of the dust emission in our two SMGs (§4), we also use ultra–high–spatial–resolution data especially extracted from the ALMA archive for the analysis presented in this work. Since no bright emission lines are covered by the spectral setup of the ultra–high–spatial–resolution observations, we focus on the continuum dust emission. There are ultra–high–spatial–resolution observations in B3, B6 and B7. No continuum emission is detected in B3 due to the lack of depth. We thus focus our analysis on B6 and B7.
The extraction and calibration of the ultra-high resolution data is done in exactly the same way as for the mid-resolution data, including self-calibration to improve image quality. Using Briggs weighting with a robust parameter equal to 0.5 we obtain a beam size of at (B7), meaning a spatial resolution of at the redshift of the two sources. The continuum sensitivity is . The spatial resolution of the B6 observations is , with a r.m.s. level of . The spatial resolution provided by these observations is about 10 times better than those reported so far in any previous unlensed, high-redshift starburst, and close to the typical size of giant molecular clouds ().
3. A pair of SMGs at
As pointed out in Oteo et al. (2016b), one of the key advantages of using ALMA calibrators to study the submm galaxy population is that they are typically observed in multiple ALMA bands. This allows us to: (1) have a good sampling of the FIR SED of the detected galaxies; (2) find redshifts by carrying out blind searches of (sub)mm emission lines (including CO, , [CI], [CII], etc). The two SMGs found around calibrator J1058+0133 perfectly exemplify these two points. They were initially discovered in B6 and B7 as two bright sources near J1058+0133, a bright blazar at used routinely as an ALMA calibrator (Oteo et al., 2016b). We thought initially that they were part of a jet emanating from the calibrator. However, ALMA B3 data revealed that J1058+0133 does have a strong jet, but not in the direction from the calibrator to either of the two SMGs (see Figure 1). The flux density ratio between and of each source (in addition to the lack of continuum detection in B3 and B4) was compatible with them being high-redshift SMGs, although it could still be compatible with the two sources being companions of the bright calibrator, located at its redshift.
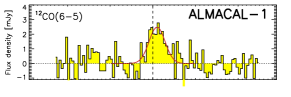
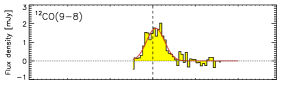
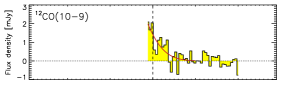
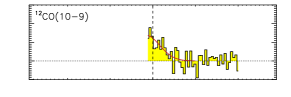
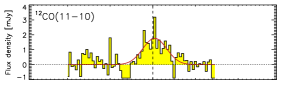
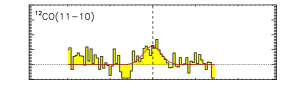
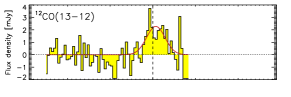
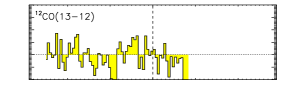
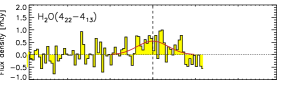
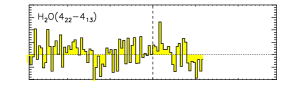
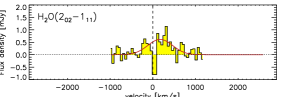
We then searched for emission lines from the two SMGs assuming that they were at the same redshift of the calibrator. Nothing was found. However, a blind search for emission lines in their (sub)mm spectrum revealed two emission lines in each component, unambiguously confirming a redshift of . Further data for this calibrator was then extracted from the ALMA archive, and up to nine potential emission lines were identified in each component, as shown in Figure 2. We have detected 12CO(14–13), 12CO(13–12), 12CO(11–10), 12CO(10–9), 12CO(9–8), 12CO(6–5), H2O(312–3 and weak H2O(422–4 and H2O(202–1 transitions in one or both sources. The median line width of the lines in A–1 and A–2 are and , respectively, and there is evidence that our measured water lines are slightly wider than the CO transitions; this will be reassessed as more data for J1058+0133 become available. For a given source, the velocity shifts can be as large as . These are lower than those found in other bright starbursts such as SGP38326 (Oteo et al., 2016a) or HATLAS J084933 (Ivison et al., 2013).
The CO SLED of A–1 and A–2, including data for lower- transitions from other facilities where J1058+0133 has also been used as a calibrator (for example the JVLA), will be presented in a subsequent paper. However, it is important to point out here that A–1 is warmer (see §3.1 and Table 1), has relatively bright 12CO(13–12), 12CO(14–13) and lines, and its CO SLED seems to plateau at , suggesting an influential AGN in A–1 and less so in A–2, for which the upper limits in the high- CO lines suggest a less excited CO SLED. Despite the possible influence of an AGN on the molecular line properties, with the data in hand it is not possible to estimate the contribution of the possible AGN to the total IR luminosity of the source.
The redshift of A–1 and A–2 (see Table 1) clearly indicates that they are not related to the calibrator (at ). It might be argued that the two SMGs are lensed components of the same background galaxy, as is suggested by the apparent symmetry of the two SMGs with respect to the calibrator. However, despite the high signal to noise of the multi-band continuum detections, there is no sign of an Einstein ring or extended emission connecting the two sources, sometimes seen in the lensed dust emission of high-redshift SMGs (see for example ALMA Partnership et al., 2015; Dye et al., 2015; Bussmann et al., 2013, 2015). Also, 12CO(13–12) and 12CO(14-13) are not detected in A–2 despite the low r.m.s. of the spectra would have allowed detections if the CO SLEDs of A–1 and A–2 were the same, as expected if they A–1 and A–2 were lensed components of the same background source. Furthermore, the FIR SED of the two sources are different (see §3.1), and this is not compatible with them being lensed by the blazar host galaxy. Despite the arguments supporting the idea that A–1 and A–2 are not lensed, we will explore the consequences of possible lensing in the conclusions of this paper in §4.1.
A–1 and A–2 are separated by 28 kpc in projection, suggesting tidal interaction may have triggered star formation in both systems. If observed with a single-dish submm telescope, our two SMGs would have appeared in the image as a single unresolved blob. The separation between A–1 and A–2 is about 2 times the projected separation between the two interacting components of SGP38326 at (Oteo et al., 2016a) and comparable to the separation between merging the HyLIRGs at in Ivison et al. (2013). The separation is compatible with the distance between the multiple components that SMGs are normally resolved into, as revealed by high-resolution radio or ALMA observations (Ivison et al., 2007; Karim et al., 2013; Hodge et al., 2013; Simpson et al., 2015).
3.1. The far-IR SEDs
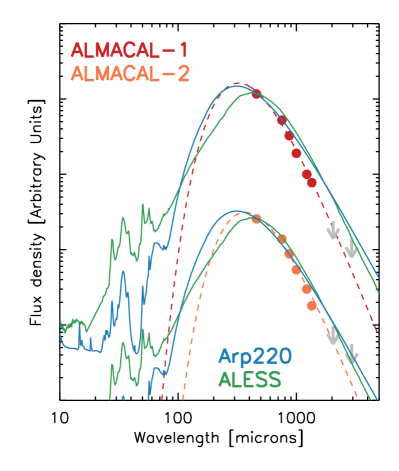
In order to determine the dust temperature of A–1 and A–2 we have fitted their FIR SED (using all available photometry in B6, B7, B8 and B9) with optically thin models (see Figure 3). Uniquely, we have performed FIR SED fits with sub-arcsec resolution photometry, unlike all previous work on high-redshift SMGs where the large beams of the single-dish observations prevents accurate deblending of the multiple components which SMGs are typically resolved into (Karim et al., 2013; Hodge et al., 2013; Simpson et al., 2015). It should be noted that we assume here that the total IR luminosity is due to star formation rather than AGN activity.
Since observations are available in almost all frequencies covering B6 and B7, we have split the observations in each band into two sub-bands corresponding to the two halves of each band. In this way, we have six photometric points in total (see values in Table 1), and a finer coverage of the FIR SED. Table 1 quotes the dust temperature derived for A–1 and A–2 by assuming a dust emissivity of . It should be noted that lower values would give higher dust temperatures (for example, A–1 would have for ). However, the of the fits would not be significantly different and additional photometric information is required to distinguish between different values of . The observed FIR SEDs suggests that A–1 is warmer than A–2.
In order to derive the total IR luminosity of each source (see Table 1) we have fitted their FIR SEDs using optically thin models (with a dust emissivity of ), including a mid-IR power law with a slope of . This provides a mid-IR SED similar to the one found for the average SMG population. The SFR of A–1 and A–2 has been then derived from the total IR luminosity assuming the classical Kennicutt (1998) calibration and a Salpeter IMF (see Table 1). As expected from their brightness, the SFR of our two SMGs is very high, revealing extreme star formation and placing A–1 and A–2 among the most luminous starbursts at . The and (see Table 1) of A–1 and A–2 are compatible to those found for the classical population of single-dish-submm-detected SMGs (Swinbank et al., 2014; Simpson et al., 2014), and they would have been selected individually as SMGs is they had been located in cosmological fields where FIR/(sub)mm surveys have been carried out.
Figure 3 compares the FIR SED of A–1 and A–2 with the ones for the average population of SMGs in the ALESS survey (Swinbank et al., 2014) and Arp 220. These two templates have been shifted to and scaled to the flux density of A–1 and A–2. It can be seen that the observed FIR SED of A–1 and A–2 are fainter at mm wavelengths for the same FIR flux density than Arp 220 and ALESS, suggesting that A–1 and A–2 are warmer than the average SMG (but still comparable with the spread of the relation).
| A–1 | A–2 | |
| RA | 10:58:29.7 | 10:58:29.5 |
| Dec | +1:33:57.2 | +1:33:59.7 |
| [mJy] | ||
| [mJy] | ||
| [mJy] | ||
| [mJy] | ||
| [mJy] | ||
| [mJy] | ||
| [K] () | ||
4. Dust morphology on 150 pc scales
| Clump | aafootnotemark: | SFR | |||||
| [mJy] | [] | [] | [] | [] | [] | ||
| A–1A | |||||||
| A–1B | |||||||
| A–2A | |||||||
| 11footnotetext: The total IR luminosities have been calculated from the observed flux density at assuming the best-fit FIR SEDs obtained from the mid-resolution data (see Figure 3). Furthermore, we assume that all IR luminosity is due to star formation rather than AGN activity. 22footnotetext: The sizes reported in the table correspond to the beam–deconvolved FWHM of a 2D elliptical Gaussian fit. We only report the size of the clumps detected at . 33footnotetext: The surface densities have been calculated assuming that the size of the sources is , where and are the semi-axis of the best-fit elliptical Gaussian of each component. |
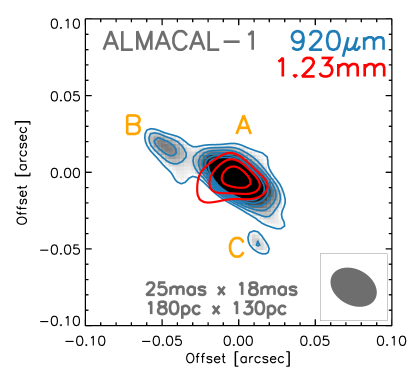
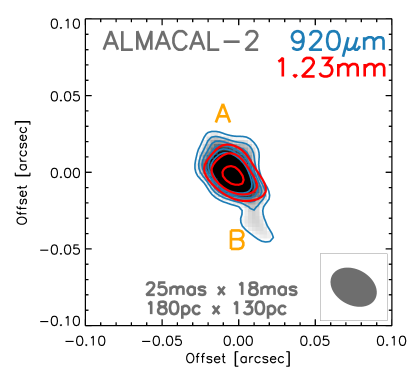
We focus in this section on the analysis of the dust continuum emission detected in B7 () and B6 () in our two dusty starbursts. A–1, the most luminous component of the pair (Figure 4 – left), is resolved into three star-forming clumps, A–1A, A–1B, and A–1C, with A–1A being more than 2 times brighter than the other two components. Only one star-forming clump (A–2A) is detected in A–2 with the r.m.s. of our data. We have measured the primary-beam corrected flux density at and beam–deconvolved size of each component with the task imfit within casa. The derived values are quoted in Table 2, where we only include the three clumps which are detected at , since sizes cannot be reliably measured at lower signal to noise. We see that components A–1A and A–2A dominate the dust emission in A–1 and A–2, respectively, and appear very compact, with FWHM sizes of .
Figure 4 also shows the ultra–high–spatial–resolution emission in our pair of SMGs. At , this wavelength probes the emission at rest-frame . The spatial resolution of the B6 observations () is slightly worse than the resolution of the observations, but still comparable. The maximum of the emission (detected in components A–1A and A–2A only due to the sensitivity of the observations) is coincident with the maximum of the emission. However, there seems to be an elongation of the emission in A–1A which is not seen in the map. The origin of this extended emission is currently unknown, although further data on this source providing higher signal to noise detections or better coverage will help to explore this issue further. In any case, the similarity between the B6 and B7 emission in A–1A and A–2A confirm that the dust emission in those two components is truly compact. Using the best-fit FIR SEDs of A–1 and A–2 (see Figure 3) we estimate that their flux densities at are and , respectively. Considering the observed flux densities in our ultra-high-resolution data (see Table 2), we estimate that we resolve out about 40% of the observed flux in both A–1 and A–2. This suggests that a significant fraction of the dust emission in our two dusty starbursts is relatively diffuse and/or extended, but that of the dust emission in A–1 and A–2 is extremely compact.
The total IR luminosity of each clump has been obtained by re-scaling the best-fit mid-IR power law plus the optically thin dust emission to A–1 and A–2 to their observed flux density. The uncertainties of the total IR luminosities are the same for all clumps and reflect the errors in the extrapolation from a single–band photometry to the total IR luminosity (changes in dust temperature, dust emissivity, power law of the mid-IR SED, etc). The associated SFRs have been derived using the classical Kennicutt (1998) calibration and assuming a Salpeter IMF. The SFR of our star-forming clumps range from to . It is notable that the high SFR in A–1 and A–2 (especially in A–1A and A–2A) is taking place in extremely small star-forming clumps, with average FWHM sizes of about . This means that the SFR surface density, , of the clumps is as high as (see Table 2). Such high values of the SFR surface densities have not been reported so far in any high-redshift dust starburst, and exceed the maximum value predicted by Andrews & Thompson (2011), .
Simpson et al. (2015) reported a median value of for their SMGs, with only two galaxies above . In SGP38326, the most luminous, unlensed starburst found at , the star formation is taking place in two interacting disks, with the SFR rate density of the most luminous component of the merger being (Oteo et al., 2016a). For the Eyelash, a strongly lensed starburst at whose star formation is occurring in four distinct clumps (), Thomson et al. (2015) derived values as high as . Other extreme dusty starbursts at high redshift have high SFR surface densities, such as HFLS3 () or AzTEC-3 () but none of them comparable to the values found in A–1 and A–2. Relatively low values of the SFR surface density are also found in extreme high-redshift galaxies, such as HDF 850.1, with . It is clear that there is a significant variety of values in high-redshift galaxies, or more likely that most data do not resolve the small star-forming clumps.
The reason for all previous at high-redshift being significantly lower than in the star-forming clumps of A–1 and A–2 is likely a combination of their brightness and the availability of ultra–high–spatial–resolution observations revealing that the strong star formation is occurring in very small scales. Most previous work on unlensed SMGs employ observations with a linear resolution around 10 times worse than the resolution of our ALMA data. To highlight the importance of ultra–high–spatial–resolution observations in the analysis of the ISM of dusty starbursts we have determined the size of the dust emission and the derived value of in A–1 and A–2 by using our mid-resolution observations (see Figure 1 and §2). The smaller beam is provided by the B9 observations, . With this, A–1 has a beam-deconvolved size of , or . This would imply , compatible with the values found by Simpson et al. (2015) but more than one order of magnitude lower than the of any of the three components A–1 is resolved into when observed at ultra–high–spatial resolution.
Wilson et al. (2014) reported high-resolution observations of the two nuclei of Arp 220 at . In physical scale, their spatial resolution () is matching our ultra–high–spatial resolution. Wilson et al. (2014) obtained IR surface density of and for the western and eastern nuclei, respectively. These values are similarly high to the values we find for A–1 and A–2 and were obtained at similar physical spatial resolution, highlighting again that ultra-high-spatial resolution plays a key role in the understanding the properties and nature of dusty starbursts.
It is possible that some of the observed in our two SMGs might be due to dust heated by an AGN in the center of the galaxies instead of star formation. In fact, (Wilson et al., 2014) discussed that the extremely high luminosity surface densities found in the western nucleus of Arp 220 could be, in part, due to the presence of an AGN. If there is AGN contribution to the luminosity of the brightest clumps in A–1 and A–2, their SFRs would be overestimated, and so the associated SFR surface densities. It could be expected that, if there is AGN contribution in our two SMGs, the AGN is located in the two brightest clumps, but not in the fainter ones. Therefore, even if the SFR surface density of the brightest clumps might be overestimated, this is less likely to happen in the fainter clumps, and these still have high SFR surface densities. This assumes that the possible AGN heat the dust locally over a scale of less than , not reaching the other star-forming clumps.
4.1. Exploring possible lensing
As commented in §3, the fact that the flux ratio (both line and continuum) between A–1 and A–2 depends on wavelength indicates that these sources are not two gravitationally amplified components of a galaxy at close to the line of sight of the blazar host. Despite this, and in order to investigate what the consequences of lensing would be, we consider in this section the possibility that A–1/A–2 is actually a lensed system. If this is the case, we need to calculate the flux and size of the source in the source plane. To do this we have used the code uvmcmcfit, which models the lensed emission of galaxies observed with interferometers in the plane (Bussmann et al., 2013, 2015). In uvmcmcfit the background source is assumed to have an elliptical Gaussian profile, whereas the lens mass profile is represented by a singular isothermal ellipsoid.
We have first modeled the possible lensed emission in the mid-resolution maps (see Figure 1) with the aim to explore whether the spatial configuration of A–1 and A–2 with respect to the lens can be successfully modeled. We have modeled the lensed emission in all bands where A–1 and A–2 are detected (see Table 1). The result is that the positions and flux ratios of the two sources are well recovered in all bands. It should be noted that we have not modeled the multi-band emission simultaneously since this is not possible to do with publicly available codes working in the plane. The magnification factor is derived from the ratio between the total flux density in the lensed image of the model to the total flux density in the unlensed, intrinsic source model. We have derived at , and similar values are obtained in the other bands (expected due to the similar spatial configuration of the system in the different bands). The effective radius of the source in the source plane is . We then used the best-fit model obtained from the mid-resolution data as an initial condition to model the possible lensed emission in the ultra-high-resolution observations. If they were lensed, the observed emission in A–1 and A–2 (see Figure 4) is compatible with a single, extremely compact background source, whose effective radius is only .
The total observed SFR of A–1 and A–2 in the ultra-high-resolution observations is , which means a source-plane, de-magnified SFR of . Together with the effective radius in the source plane, the de-magnified SFR surface density is . This value is considerably higher than the values obtained considering that A–1 and A–2 are not lensed, and therefore, much higher than in any previous high-redshift source and very close to the value found in the eastern nucleus of Arp 220.
5. Conclusions
In this paper we have presented ultra-high spatial resolution () dust continuum ( and ) observations of two dusty starbursts, the brightest SMGs detected so far in our survey of serendipitous sources in the fields of ALMA calibrators: A–1 () and A–2 (). The main conclusions of our work are the following:
-
1.
We have determined the spectroscopic redshift of our two dusty starbursts to be via detection of up to nine 12CO and emission lines in ALMA bands 4, 6, and 7. The maximum velocity shift found between the emission lines of A–1 and A–2 (which are separated on the sky by ) is less than , significantly lower than in other high-redshift interacting starbursts.
-
2.
Using flux densities measured in ALMA band 6, 7, 8, and 9 we have determined the dust temperature and total IR luminosity of each of the two dusty starbursts. These values are compatible with those found for the classical population of SMGs (with A–1 being warmer than A–2), and they would have been selected as SMGs in single-dish submm surveys. Uniquely, the FIR SEDs of our two dusty starbursts have been constrained with sub-arcsec resolution observations, unlike in previous work based on single-dish FIR/submm observations, which suffer from large beam sizes and source confusion problems.
-
3.
Our ALMA ultra-high-resolution imaging reveals that about half of the dust emission in A–1 and A–2 is arising in compact components (with FWHM sizes of ). Two additional, fainter star-forming clumps are found in A–1. We recall that our in-field calibrator and subsequent self-calibration ensures near-perfect phase stability on the longest baselines, ensuring great image quality. Actually, we have two independent datasets in ALMA B6 and B7 at similar spatial resolution which prove the reliability of the reported structures.
-
4.
The high SFR and the compact size of all the star-forming clumps in A–1 and A–2 indicate extremely high SFR surface densities of up to . These values are significantly higher than those previously obtained in high-redshift dusty starbursts, and only comparable to the values found in the nuclei of Arp 220 with observations at similar (physical) spatial resolution. It should be noted that the SFR is obtained assuming that the IR luminosity is due to star formation, since with the current data we cannot study what the contribution of a possible AGN to the SFR could be.
-
5.
We argue that the extremely high SFR surface densities of the star-forming clumps in A–1 and A–2 might be common in high redshift dusty starbursts but are only visible thanks to the availability of ultra-high spatial resolution data. This highlights the importance of long-baseline observations for the study of the ISM of dusty-starburst in the early Universe.
-
6.
There is a small probability that this system is lensed, in the sense that the two SMGs around J1058+0133 are actually the lensed emission of a source gravitationally amplified by the blazar host. If this is actually the case, the resolution of the observations would increase to and we would be resolving sizes comparable to individual giant molecular clouds. The galaxy in the source plane would have an effective radius of , implying a de-magnified SFR surface density of , only comparable with the value found in the eastern nucleus of Arp 220.
References
- ALMA Partnership et al. (2015) ALMA Partnership et al., 2015, ApJ, 808, L4
- Andrews & Thompson (2011) Andrews B. H., Thompson T. A., 2011, ApJ, 727, 97
- Asboth et al. (2016) Asboth V. et al., 2016, ArXiv e-prints
- Barger et al. (1998) Barger A. J., Cowie L. L., Sanders D. B., Fulton E., Taniguchi Y., Sato Y., Kawara K., Okuda H., 1998, Nature, 394, 248
- Blain et al. (2002) Blain A. W., Smail I., Ivison R. J., Kneib J.-P., Frayer D. T., 2002, Phys. Rep., 369, 111
- Bussmann et al. (2013) Bussmann R. S. et al., 2013, ApJ, 779, 25
- Bussmann et al. (2015) Bussmann R. S. et al., 2015, ApJ, 812, 43
- Chapman et al. (2005) Chapman S. C., Blain A. W., Smail I., Ivison R. J., 2005, ApJ, 622, 772
- Dye et al. (2015) Dye S. et al., 2015, MNRAS, 452, 2258
- Dye et al. (2014) Dye S. et al., 2014, MNRAS, 440, 2013
- Eales et al. (2010) Eales S. et al., 2010, PASP, 122, 499
- Engel et al. (2010) Engel H. et al., 2010, ApJ, 724, 233
- Frayer et al. (2011) Frayer D. T. et al., 2011, ApJ, 726, L22
- Hodge et al. (2013) Hodge J. A. et al., 2013, ApJ, 768, 91
- Hughes et al. (1998) Hughes D. H. et al., 1998, Nature, 394, 241
- Ikarashi et al. (2015) Ikarashi S. et al., 2015, ApJ, 810, 133
- Ivison et al. (2007) Ivison R. J. et al., 2007, MNRAS, 380, 199
- Ivison et al. (2013) Ivison R. J. et al., 2013, ApJ, 772, 137
- Karim et al. (2013) Karim A. et al., 2013, MNRAS, 432, 2
- Kennicutt (1998) Kennicutt, Jr. R. C., 1998, ARA&A, 36, 189
- Negrello et al. (2010) Negrello M. et al., 2010, Science, 330, 800
- Negrello et al. (2014) Negrello M. et al., 2014, MNRAS, 440, 1999
- Oteo et al. (2016a) Oteo I. et al., 2016a, ArXiv e-prints
- Oteo et al. (2016b) Oteo I., Zwaan M. A., Ivison R. J., Smail I., Biggs A. D., 2016b, ApJ, 822, 36
- Rybak et al. (2015a) Rybak M., McKean J. P., Vegetti S., Andreani P., White S. D. M., 2015a, MNRAS, 451, L40
- Rybak et al. (2015b) Rybak M., Vegetti S., McKean J. P., Andreani P., White S. D. M., 2015b, MNRAS, 453, L26
- Salpeter (1955) Salpeter E. E., 1955, ApJ, 121, 161
- Simpson et al. (2015) Simpson J. M. et al., 2015, ApJ, 799, 81
- Simpson et al. (2014) Simpson J. M. et al., 2014, ApJ, 788, 125
- Smail et al. (1997) Smail I., Ivison R. J., Blain A. W., 1997, ApJ, 490, L5
- Strandet et al. (2016) Strandet M. L. et al., 2016, ArXiv e-prints
- Swinbank et al. (2015) Swinbank A. M. et al., 2015, ApJ, 806, L17
- Swinbank et al. (2014) Swinbank A. M. et al., 2014, MNRAS, 438, 1267
- Swinbank et al. (2010) Swinbank A. M. et al., 2010, Nature, 464, 733
- Tacconi et al. (2008) Tacconi L. J. et al., 2008, ApJ, 680, 246
- Thomson et al. (2015) Thomson A. P., Ivison R. J., Owen F. N., Danielson A. L. R., Swinbank A. M., Smail I., 2015, MNRAS, 448, 1874
- Weiß et al. (2013) Weiß A. et al., 2013, ApJ, 767, 88
- Weiß et al. (2009) Weiß A., Ivison R. J., Downes D., Walter F., Cirasuolo M., Menten K. M., 2009, ApJ, 705, L45
- Wilson et al. (2014) Wilson C. D., Rangwala N., Glenn J., Maloney P. R., Spinoglio L., Pereira-Santaella M., 2014, ApJ, 789, L36