The first CO+ image
The CO+ reactive ion is thought to be a tracer of the boundary between a HII region and the hot molecular gas. In this study, we present the spatial distribution of the CO+ rotational emission toward the Mon R2 star-forming region. The CO+ emission presents a clumpy ring-like morphology, arising from a narrow dense layer around the HII region. We compare the CO+ distribution with other species present in photon-dominated regions (PDR), such as [CII] 158 m, H2 S(3) rotational line at 9.3 m, polycyclic aromatic hydrocarbons (PAHs) and HCO+. We find that the CO+ emission is spatially coincident with the PAHs and [CII] emission. This confirms that the CO+ emission arises from a narrow dense layer of the HI/H2 interface. We have determined the CO+ fractional abundance, relative to C+ toward three positions. The abundances range from 0.1 to 1.9 and are in good agreement with previous chemical model, which predicts that the production of CO+ in PDRs only occurs in dense regions with high UV fields. The CO+ linewidth is larger than those found in molecular gas tracers, and their central velocity are blue-shifted with respect to the molecular gas velocity. We interpret this as a hint that the CO+ is probing photo-evaporating clump surfaces.
Key Words.:
Astrochemistry – (ISM): Photo-dominated regions (PDRs) – Hii region – Radio lines: ISM – Individual: Monoceros R21 Introduction
Reactive ions are destroyed in almost every collision with H and H2 and recombine rapidly with e-. These compounds present enhanced abundances toward the hot layers of the photon-dominated regions (PDRs), where the far ultraviolet (FUV) field is only partially attenuated and maintains high abundances of the parent species C+ and S+ (Sternberg & Dalgarno, 1995). In particular, Sternberg & Dalgarno (1995) predict a high CO+ abundance at the HI/H2 interface ( mag) of dense PDRs, where it is mainly produced by the C+ + OH CO+ + H reaction. So far, the CO+ ion has been detected in several PDRs; such as the M17SW, Orion Bar, NGC7027, NGC7023 (Latter et al. 1993; Stoerzer et al. 1995; Fuente & Martín-Pintado 1997; Fuente et al. 2003), G29.96, MonR2 (Rizzo et al., 2003) and S140 (Savage & Ziurys, 2004). However, all the detections have been obtained after long integrations toward a single position and they lack the information on the spatial distribution.
The Mon R2 star-forming region, located at 830 pc (Herbst & Racine 1976), contains an ultracompact (UC) HII region surrounded by a series of PDRs with different physical conditions (Pilleri et al., 2013; Treviño-Morales et al., 2014). The main PDR, corresponding to IRS 1 (hereafter IF), is irradiated by a high UV field of (in units of the Habing flux; Habing 1968), and presents high densities ( cm-3) and kinetic temperatures ( K; Berné et al. 2009). A second PDR, associated with the molecular peak MP2, is detected north from IF, and shows chemical properties similar to those found in low- to mid-UV irradiated PDRs (Ginard et al. 2012). Due to its proximity and physical conditions, Mon R2 turns to be an excellent candidate to study the HI/H2 interface. CO+ is thought to be a good PDR tracer, and its distribution is potentially an excellent diagnostic tool to learn about the physical structure of these regions.
In this paper, we present a study of the CO+ (–1) transition line toward Mon R2 and compare its spatial distribution with Spitzer data reported by Berné et al. (2009), Herschel data from Pilleri et al. (2012) and Ossenkopf et al. (2013) and the HCO+ and H13CO+ molecules from Treviño-Morales et al. (2014).
2 Observations and data reduction
We observed maps of CO+ transition lines (–1 at 235.380 GHz, 235.789 GHz and 236.062 GHz) using the IRAM-30m telescope (Pico Veleta, Spain). The observations were performed using the EMIR receiver with the Fast Fourier Transform Spectrometer (FTS) at 200 kHz of resolution. Throughout this paper, we use the main-beam brightness temperature () as intensity scale. The data were reduced using standard procedures with the CLASS/GILDAS package (Pety et al., 2005). The three lines were detected, but only the 236.0625 GHz has sufficient signal-to-noise ratio (S/N) for good imaging. In order to improve the S/N, we smoothed the native observation to an angular resolution of 16″ (see Fig. 1) and to a spectral resolution of 1 km s-1. In the final datacube, CO+ has linewidths of – km s-1 and intensity peaks of 60–200 mK (with rms mK). The main CO+ line is located close to a bright 13CH3OH line (at 236.0628 GHz). However, we dismiss the idea of a possible blending in the CO+ line, as in the spectral line survey conducted toward Mon R2 (Treviño-Morales, 2016) we do not find 13CH3OH emission at any frequency. Moreover, the main compound CH3OH is not detected at the positions where CO+ is bright.
3 Results
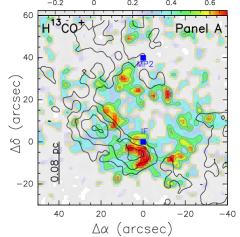
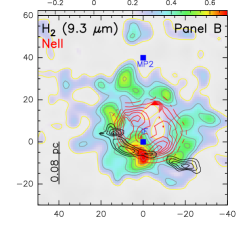
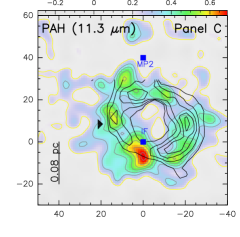
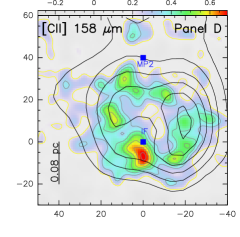
In Fig. 1 we compare the CO+ spatial distribution with other species. Panel A shows the H13CO+ (3–2) line emission (black contours) tracing the molecular gas (Treviño-Morales et al., 2014), that is distributed around the CO+ emission. CO+ presents a clumpy structure, where the main CO+ clumps seem to have a counterpart in the H13CO+ (3–2) emission. However, the peaks of CO+ are located –″ closer to the HII region, likely tracing an inner layer of the region. We find that CO+ emission appears surrounding the HII region with its intensity peak at the offset [0″, ″], very close the IF position (see Panel B of Fig. 1). Moreover, the two most intense CO+ clumps are correlated with the H2 emission, in an area where the density is presumably larger. Panels C and D show the PAHs and the [CII] emission, respectively (black contours). The CO+ emission present a clumpy ring-like distribution, spatially coincident with the PAHs emission. The CO+ secondary clumps are associated with the PAHs emission peaks, but not the most intense one. Panel D shows a comparison of the CO+ spatial distribution with the emission of its chemical precursor [CII]. These species are spatially associated, with the main difference being the location of the peaks: CO+ has its intensity peak to the south of the IF position, while the [CII] peak is located to the west. Therefore, we interpret that the CO+ is found toward the densest area of the region (where all the molecular gas piles up, e. g., the H13CO+ spatial distribution) as expected since the critical densities of H13CO+ ( cm-3) and CO+ ( a few cm-3; Stäuber & Bruderer 2009) are larger than that of [CII] ( a few cm-3; Goldsmith et al. 2012). It is worth noting that the CH+ molecule is also related to the CO+ and [CII] chemistry. When comparing their spatial distribution, we find that the CO+ emission also coexist with CH+ but, as [CII], its intensity peak is located to the west of the IF position (Pilleri et al., 2014).
In order to better understand the spatial distribution, we did intensity cuts with a position angle of 45° throughout the IF position and cutting the ring-like structure seen in the CO+ emission at the south-east and north-west (pink dashed line in left panel of Fig. 2). The intensity cuts for the species CO+, H13CO+, [CII], H2 and PAHs are shown in Panels A to F of Fig. 2. The molecular gas as traced by H13CO+ shows emission between the offset ″and ″(corresponding to the area between [″,″] and [″,″] in the map) with no emission associated with the HII region. The most intense emission of CO+ comes from this region, but there is also 3-level emission associated with the HII region (gray-shaded area in the map). Note, however, that the CO+ peak is closer to the HII region than the H13CO+ peak. The [CII] emission is very intense and extended in the whole area, and its intensity cut shows two emission peaks: one coincident with the CO+ peak, and a second one (the brightest one) on the opposite edge of the ring-like structure (to the north-west). The PAHs emission is weaker than [CII] but their intensity cuts are quite similar. Finally, the H2 S(3) line only shows emission over between the offset ″ and 0″. Summarizing we can see a trend of spatial segregation, with the H13CO+ tracing the outer layers (far from the HII region), then CO+ and [CII] and PAHs peaking closer to the ionized gas, and finally the H2 emission tracing a hotter layer close to the HII region (Panel F of Fig. 2).
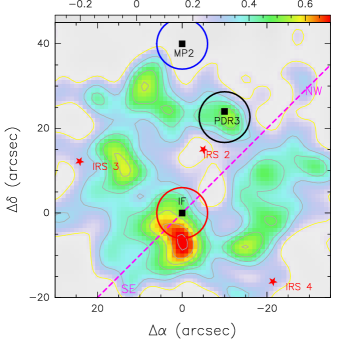
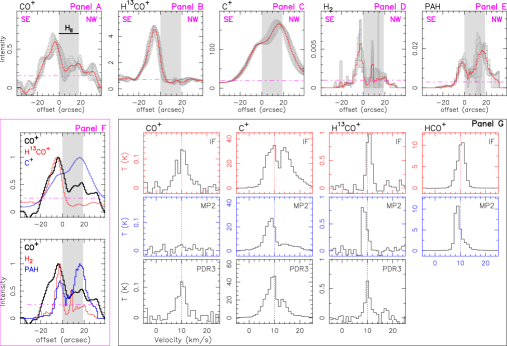
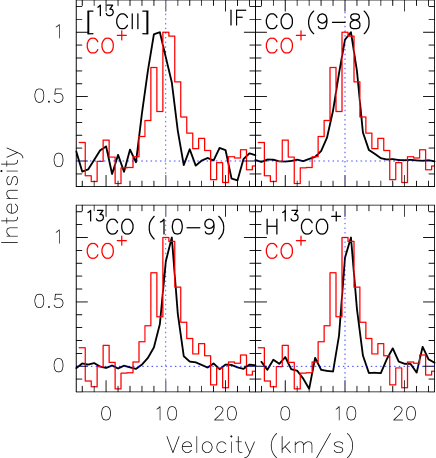
The circles in the left panel of Fig. 2 mark the positions where we compare the spectral profiles of CO+, [CII], H13CO+ and HCO+ (Panel G). The positions correspond to (i) the ionization front (IF at offset [0″, 0″], red), (ii) the offset [″, 24″] (close to the PDR3 in Berné et al. 2009, black), and (iii) the MP2 position (offset [0″, 40″], blue) that is known to be a PDR with a low UV field and high density (Ginard et al., 2012). In Fig. 3, we present a comparison of the CO+ line profile (in red) with the [13CII] (Ossenkopf et al., 2013), 13CO (10–9) and CO (9–8) lines at IF (Pilleri et al., 2012). We find that CO+ presents larger linewidth than 13CO, H13CO+ and HCO+ ( km s-1 vs 3–5 km s-1). The CO+ linewidth, however, is comparable to that of carbon recombination lines (6 km s-1; Treviño-Morales 2016). Similarly, the CO+ line has a similar profile to that of the [13CII] and the high excitation CO (9–8) line. The CO+ and [13CII] spectra are closely similar in the line shape and line widths; this similarity may be well explained if CO+ lies in the dissociation front, between the ionized gas and the molecular gas. We find weak CO+ emission toward the HII region that might come from the back and front walls of the PDR.
On the basis of reactive ions (CH+, OH+, and H2O+) observations, Pilleri et al. (2014) constructed a schematic view of the Mon R2 geometry. They find that the emission of the high density molecular gas seems to come from the back side (relative to the observer) of the HII region. This is confirmed by the detection of the cluster at infrared wavelengths (i. e., not obscured by in-front molecular gas). In this scenario, one expects that an expansion of the HII region is indicated by an excess of red-shifted emission in the observed lines. However, while we find hints of the molecular tracers (H13CO+, CO) to be skewed toward red-shifted velocities, the PDR tracers (CO+, [13CII]) seem to have a spectral profile skewed toward blue-shifted velocities (Figs. 2 and 3). In order to quantify this, we have measured the amount of emission in each spectral line that is blue-shifted and red-shifted with respect to the systemic velocity (10 km s-1 for IF and PDR3, and 8 km s-1 for MP2; Treviño-Morales et al. 2014). For the IF position, we find % of the emission of PDR tracers to be blue-shifted, and only % for the molecular tracers. Similarly, for MP2 and PDR3 we find % and % of blue-shifted emission for the PDR tracers and % and % for the molecular tracers. In general, we have % of the PDR-tracer emission to be blue-shifted, and only % for the molecular tracers. Considering that the molecular gas is located behind the UC HII region, the difference between the PDR and molecular tracers can be explained if the PDR is formed by dense condensations that are being photo-evaporated. In this case, the photo-evaporated gas (PDR tracers) would be ejected toward us, and therefore, blue-shifted with respect to the molecular gas. This effect is also visible in Fig. 3, where [13CII] presents its velocity peak at 9 km s-1 (blue-shifted) and the emission associated with the molecular gas is red-shifted. Finally, we do not find significant velocity gradients ( km s-1) between the CO+ clumps, suggesting low levels of turbulence between them, and consistent with the low expansion velocity found by Fuente et al. (2010) and Pilleri et al. (2012).
4 CO+ and HCO+ fractional abundances
On the basis of the spectra presented in Figs. 2 and 3, we calculated the CO+, HCO+ and C+ column density () in ranges of 1 km s-1 at the three selected positions (see Appendix B). We assume optically thin emission and a beam filling factor of 1 for all the species. The [CO+] values have been calculated assuming a Boltzmann distribution of rotational levels with K. This value of the excitation temperature is based on calculations by Stäuber & Bruderer (2009) and the detection of several CO+ lines towards the Orion Bar (Cuadrado et al. 2015, S. Cuadrado, priv. communication). We used the MADEX large velocity gradient (LVG; Cernicharo 2012) and RADEX code (van der Tak et al., 2007), to derive [H13CO+] and [C+]. According to the physical conditions derived by Berné et al. (2009) from the H2 ground state rotational lines, we assume K, cm-3 for the IF and K, cm-3 for PDR3. Unfortunately, the MP2 position is out of the Spitzer map; for this position, we make a reasonable guess of K and cm-3. The assumption of optically thin emission is not valid for the HCO+ (3–2) line at velocities close to cloud systemic velocity. Thus, between 8–11 km s-1, we derived the [HCO+] using the rarer isotopologue line H13CO+ (3–2) and assuming 12C/13C (Treviño-Morales et al., 2014). The derived H13CO+ excitation temperatures (10 16 K) toward the IF and MP2 are in agreement with those measured by Treviño-Morales et al. (2014). The collisional rate coefficients for HCO+ and H13CO+ are taken from Flower (1999). To derived the [C+] at the IF position, between 6–12 km s-1, we used the rarer isotopologue line [13CII]. A significant fraction of the [CII] emission is expected to come from the atomic layer. The calculated C+H collisional rates are similar to those with H2 within a factor 1.3 (Wiesenfeld & Goldsmith 2014, Barinovs et al. 2005). Hence, the relevant parameter regarding collisional excitation is the number of particles, either H or H2. In our calculations we assume that the hydrogen is in molecular form which implies an uncertainty of a factor of 2 in the assumed density. Taking into account that we are well over the critical density of the [CII] 158 m line, this translates into an uncertainty of 30% in the [C+]. The obtained [C+] are in good agreement with those obtained by Ossenkopf et al. (2013).
We have computed the [CO+]/[HCO+] ratio. We find values between 0.01–0.1 toward IF, with the highest values in the velocity wings. Note that we have not detected CO+ toward the PDR with lower UV field (MP2) with a significant upper limit of [CO+]/[HCO+]0.008. Toward PDR3, we obtain values of [CO+]/[HCO+], i. e., a factor of 2 lower than IF. C+ is known to be a good probe of the skin ( mag) of PDRs. Because of the similar spatial distribution and velocity profiles between the CO+ and C+, we used C+ to estimate the absolute fractional abundance of CO+. We can safely assume that almost all the carbon is in C+ in the region from which CO+ is coming. Assuming a carbon elemental abundance of 10-4 (Ossenkopf et al. 2013, Wakelam & Herbst 2008), we derive [CO+] between a few to toward both, IF and PDR3. It is worth noting that the beam of CO+, HCO+, H13CO+, [13CII] and [CII] are quite similar, thus the calculated [CO+]/[HCO+] and [CO+] values are not affected by beam filling factors. Our results are in good agreement with the model predictions presented by Sternberg & Dalgarno (1995), for and cm-3. More recently, the models of Spaans & Meijerink (2007) predict the [CO+] in PDRs, for cm-3 and . However, the high cosmic ray ionization rate (about 100 times larger than the Galactic value) prevents us from a direct comparison with Mon R2. In general, the production of CO+ seems to depend on the temperature of the gas. Stäuber & Bruderer (2009) suggest that [CO+] of about 10-11 are only reached in gas with K. As depends on and , it is expected that the production of CO+ only occurs in regions with cm-3 and . The densities and measured in IF and PDR 3 are in good agreement with these values, as IF presents and cm-3 (Rizzo et al. 2003; Fuente et al. 2010) and PDR3 presents and cm-3 (Berné et al. 2009).
5 Discussion and summary
We present a CO+ map toward Mon R2 star-forming region. This is the first map ever reported of this reactive ion. The spatial distribution of CO+ consists of a ring-like structure (similar to PAHs), tracing the layer between the HII region and the molecular gas. The maps reveal a clumpy structure in the hot layer of the mainly atomic gas. Previous works (Young et al. 2000; Goicoechea et al. 2016) suggest that there exist fragmentation in the photodissociation front. This is, there are not uniform layers between the HII region and the molecular cloud, but they present clumps that allow the radiation to penetrate deeper into the cloud. In this scenario where the PDR is conformed by a series of clumps, the emission of PDR tracers would be related to the external layers of dense clumps being photo-evaporated by the UV radiation. Despite the moderate angular resolution of our observations, we find hints that favor this scenario: (a) the spatial distribution of the CO+ as observed in the higher-angular resolution (11′′) map (Panel A of Fig. 1) suggests that the CO+ emission is coming from the illuminated surface of the H13CO+ clumps, and b) the excess of blue-shifted emission seen for the PDR tracers in comparison with the molecular tracers. Considering that the molecular gas is located behind the UC HII region (Pilleri et al., 2014) and the chemical segregation, the difference in velocity between tracers can be explained if the PDR is formed by dense condensations that are being photo-evaporated. In this case, the photo-evaporated gas (PDR tracers) would be ejected toward us, and therefore, blue-shifted with respect to the molecular gas. Future higher angular resolution observations will help to confirm or discard this scenario.
Finally, we have determined [CO+] in three positions. Toward IF we derive an abundance of a few , in agreement with chemical model predictions (Sternberg & Dalgarno, 1995) for cm-3 and G. Toward MP2 we do not detect CO+ emission with an upper limit to the CO+ abundance of . Abundances of – had been previously observed in PDRs with Habing field (M17SW: Latter et al. 1993, Stoerzer et al. 1995; Orion Bar: Fuente & Martín-Pintado 1997; NGC 7023: Fuente et al. 2003; G29.960.02: Rizzo et al. 2003). The non-detection of CO+ in MP2, together with the abundances found in the other PDRs, suggest that the production of CO+ only occurs in dense regions with high radiation fields. High UV fields () and ( cm-3) are required to achieve gas temperatures K that are necessary to produce high abundances of OH in the external layer of the PDR ( mag; Stäuber & Bruderer 2009). This is also consistent with the non-detection of CO+ in the Horsehead PDR (Goicoechea et al., 2009), where the UV field is and presents chemical properties similar to MP2 (Ginard et al., 2012). A counter-example that challenge this interpretation could be the detection of CO+ toward S140 where the incident UV field is estimated to be –300 (Savage & Ziurys, 2004). However, the number of CO+ detections is scarce and the statistics is not enough to draw firm conclusions between the relation of the CO+ and the physical properties ( and ) of PDRs. A larger sample of objects need to be studied, including maps to characterize and understand the spatial distribution of the CO+ in different environments.
Acknowledgements.
SPTM, AF, JRG and JC thank the Spanish MINECO for funding support from grants AYA2012-32032, CSD2009-00038, FIS2012-32096, and ERC under ERC-2013-SyG, G. A. 610256 NANOCOSMOS. ASM and VO thank the Deutsche Forschungsgemeinschaft (DFG) for funding support via the collaborative research grant SFB 956, projects A6 and C1. PP acknowledges financial support from the Center National d’Etudes Spatiales (CNES).References
- Berné et al. (2009) Berné, O., Fuente, A., Goicoechea, J. R., et al. 2009, ApJ, 706, L160
- Barinovs et al. (2005) Barinovs, Ğ., et al. 2005, ApJ, 620, 537
- Cernicharo (2012) Cernicharo, J. 2012, in EAS Publ. Ser., 58, 251
- Cuadrado et al. (2015) Cuadrado, S., Goicoechea, J. R., Pilleri, P., et al. 2015, A&A, 575, A82
- Flower (1999) Flower D. R. 1999, MNRAS, 305, 651
- Fuente & Martín-Pintado (1997) Fuente, A., & Martín-Pintado, J. 1997, ApJ, 477, L107
- Fuente et al. (2003) Fuente, A., Rodrıguez-Franco, A., et al. 2003, A&A, 406, 899
- Fuente et al. (2010) Fuente, A., Berné, O., Cernicharo, J., et al. 2010, A&A, 521, L23
- Ginard et al. (2012) Ginard, D., González-García, M., Fuente, A., et al. 2012, A&A, 543, A27
- Goicoechea et al. (2009) Goicoechea, J. R., Pety, J., Gerin, M., et al. 2009, A&A, 498, 771
- Goicoechea et al. (2016) Goicoechea, J.R. , Pety. J. Cuadrado et al. 2016 submitted.
- Goldsmith et al. (2012) Goldsmith, P. F., Langer, W. D., et al. 2012, ApJS, 203, 13
- Habing (1968) Habing, H. J. 1968, Bull. Astron. Inst. Netherlands, 20, 120
- Herbst & Racine (1976) Herbst, W., & Racine, R. 1976, AJ, 81, 840
- Latter et al. (1993) Latter, W. B., Walker, C. K., & Maloney, P. R. 1993, ApJ, 419, L97
- Ossenkopf et al. (2013) Ossenkopf, V., Röllig, M., Neufeld, D. A., et al. 2013, A&A, 550, A57
- Pety et al. (2005) Pety, J., Teyssier, D., Fossé, D., et al. 2005, A&A, 435, 885
- Pilleri et al. (2012) Pilleri, P., Fuente, A., Cernicharo, J., et al. 2012, A&A, 544, A110
- Pilleri et al. (2013) Pilleri, P., Treviño-Morales, S., Fuente, A., et al. 2013, A&A, 554, A87
- Pilleri et al. (2014) Pilleri, P., Fuente, A., Gerin, M., et al. 2014, A&A, 561, A69
- Rizzo et al. (2003) Rizzo, J. R., Fuente, A., et al. 2003, ApJ, 597, L153
- Spaans & Meijerink (2007) Spaans, M., & Meijerink, R. 2007, ApJ, 664, L23
- Savage & Ziurys (2004) Savage, C., & Ziurys, L. M. 2004, ApJ, 616, 966
- Stäuber & Bruderer (2009) Stäuber, P., & Bruderer, S. 2009, A&A, 505, 195
- Sternberg & Dalgarno (1995) Sternberg, A., & Dalgarno, A. 1995, ApJS, 99, 565
- Stoerzer et al. (1995) Stoerzer, H., Stutzki, J., & Sternberg, A. 1995, A&A, 296, L9
- Treviño-Morales et al. (2014) Treviño-Morales, S. P., Pilleri, P., Fuente, A., et al. 2014, A&A, 569, A19
- Treviño-Morales (2016) Treviño-Morales, S. P., 2016, PhD Thesis
- van der Tak et al. (2007) van der Tak, F. F. S., Black, J. H., Schöier, F. L. et al. 2007, A&A, 468, 627
- Wakelam & Herbst (2008) Wakelam, V., & Herbst, E. 2008, ApJ, 680, 371-383
- Wiesenfeld & Goldsmith (2014) Wiesenfeld, L., & Goldsmith, P. F. 2014, ApJ, 780, 183
- Young et al. (2000) Young Owl, R. C., et al. 2000, ApJ, 540, 886
Appendix A Comparison with other lines
In this section we present the comparison of the CO+, [13CII], 13CO (10–9) and CO (9–8) line profile. Figure 3 shows the CO+ (in red), [13CII] (Ossenkopf et al., 2013), 13CO (10–9) and CO (9–8) lines (in black) at the IF position (Pilleri et al., 2012), with the intensity is scaled to unity. We find that CO+ present larger linewidth than 13CO and H13CO+ ( km s-1vs 3–5 km s-1). Moreover, CO+ line has a similar profile to that of the [13CII] and CO line. The [13CII] line presents its velocity peak at 9 km s-1and the emission associated with the molecular gas (CO, 13CO) is red-shifted, while the systemic velocity is 10 km s-1.
Appendix B Column densities and fractional abundances
In this section we present the calculated CO+, HCO+ and C+ column densities (), as well as the fractional abundance of the IF, MP2 and PDR3 positions. The column densities were calculated in ranges of 1 km s-1, from 5 km s-1 to 14 km s-1. The CO+ column densities have been calculated assuming a Boltzmann distribution of rotational levels with K. While for HCO+ and C+, we used RADEX and MADEX LVG codes (van der Tak et al. 2007 and Cernicharo 2012), considering the physical conditions derived by Berné et al. (2009). It is worth noting that for the IF position the HCO+ emission is optically thick, thus we used the rarer isotopologue H13CO+ to correct the opacity effects and derive [HCO+] in each position, assuming 12C/13C (Treviño-Morales et al., 2014). Regarding the [C+] estimation, we note that [CII] is optically thick towards the IF position (as seen by comparing the [CII] and [13CII] lines): under the assumption of optically thin emission, [13CII] results in a column density a factor 3–5 larger than that derived from the main isotopologue [CII]. From this, and considering that the other two positions are associated with less dense gas, we can infer that the assumption of optically thin emission applied to the [CII] in MP2 and PDR3, may underestimate the column density by a factor . Because of the similar spatial distribution and velocity profiles between the CO+ and C+ we used [C+] to estimate the absolute fractional abundance . For the calculations, we consider a beam filling factor of 1. This assumption is consistent with the fact that the beams of [CII] at 158m, H13CO+ (3–2), HCO+ (3–2) and CO+ (2–1) are quite similar. Thus the calculated [CO+]/[HCO+] and [CO+] values are not affected by the beam filling factor. Table 1 lists the calculated values of [CO+], [CO+], [HCO+], [C+] and [CO+]/[HCO+] in every velocity range.
| Velocity range | (km s-1) | 5 – 6 | 6 – 7 | 7 – 8 | 8 – 9 | 9 – 10 | 10 – 11 | 11 – 12 | 12 – 13 | 13 – 14 | Total∗ |
| For the CO+ line | |||||||||||
| IF position — offset [, ] | |||||||||||
| [CO+] | (in cm-2) | 0.14 | 0.50 | 1.34 | 1.34 | 1.20 | 1.90 | 1.60 | 0.82 | 0.57 | 9.75a |
| [HCO+] | (in cm-2) | 0.06 | 0.15 | 0.34 | 1.44 | 2.42 | 1.92 | 0.70 | 0.05 | 6.79a | |
| [C+] | (in cm-2) | 0.63 | 4.00 | 5.10 | 6.00 | 5.60 | 4.70 | 3.30 | 1.24 | 1.67 | 48.00b |
| [CO+]/[HCO+] | 0.08 | 0.09 | 0.04 | 0.08 | 0.08 | 0.01 | 0.01 | 0.11 | 0.02 | ||
| [CO+] | (in ) | 2.22 | 1.47 | 2.16 | 2.23 | 2.14 | 4.04 | 4.90 | 6.61 | 3.41 | 2.03 |
| MP2 position — offset [, ] | |||||||||||
| [CO+] | (in cm-2) | d | |||||||||
| [HCO+] | (in cm-2) | 0.06 | 0.29 | 2.21 | 1.46 | 0.71 | 0.29 | 0.06 | 0.06 | 5.84a | |
| [C+] | (in cm-2) | 0.63 | 0.97 | 1.31 | 1.52 | 1.38 | 0.78 | 0.34 | 0.29 | 0.33 | 10.15c |
| [CO+]/[HCO+] | |||||||||||
| [CO+] | (in ) | ||||||||||
| PDR3 position — offset [, ] | |||||||||||
| [CO+] | (in cm-2) | 0.58 | 1.19 | 1.77 | 2.45 | 2.68 | 1.66 | 0.72 | 13.02a | ||
| [HCO+] | (in cm-2) | 1.70 | 5.17 | 6.10 | 3.04 | 20.22a | |||||
| [C+] | (in cm-2) | 0.99 | 1.37 | 1.68 | 2.26 | 2.70 | 1.93 | 0.95 | 1.00 | 1.14 | 18.04c |
| [CO+]/[HCO+] | 0.010 | 0.005 | 0.004 | 0.005 | 0.006 | ||||||
| [CO+] | (in ) | 1.36 | 0.42 | 0.71 | 0.78 | 0.91 | 1.92 | 1.75 | 0.72 | 1.18 | 0.72 |
-
∗ Total velocity range of each line. a In a velocity range of 5 – 14 km s-1. b In a velocity range of 4 – 25 km s-1. c In a velocity range of 0 – 30 km s-1. d considering the rms in a velocity range of 7 km s-1.