PRIIME: A Generic Framework for Interactive Personalized Interesting Pattern Discovery
Abstract
The traditional frequent pattern mining algorithms generate an exponentially large number of patterns of which a substantial proportion are not much significant for many data analysis endeavors. Discovery of a small number of personalized interesting patterns from the large output set according to a particular user’s interest is an important as well as challenging task. Existing works on pattern summarization do not solve this problem from the personalization viewpoint. In this work, we propose an interactive pattern discovery framework named PRIIME which identifies a set of interesting patterns for a specific user without requiring any prior input on the interestingness measure of patterns from the user. The proposed framework is generic to support discovery of the interesting set, sequence and graph type patterns. We develop a softmax classification based iterative learning algorithm that uses a limited number of interactive feedback from the user to learn her interestingness profile, and use this profile for pattern recommendation. To handle sequence and graph type patterns PRIIME adopts a neural net (NN) based unsupervised feature construction approach. We also develop a strategy that combines exploration and exploitation to select patterns for feedback. We show experimental results on several real-life datasets to validate the performance of the proposed method. We also compare with the existing methods of interactive pattern discovery to show that our method is substantially superior in performance. To portray the applicability of the framework, we present a case study from the real-estate domain.
1 Introduction
Frequent pattern (itemsets, sequences, or graphs) mining [35] has been a core research task in data mining domain for over two decades, yet its deployment in real-life data analysis has been moderate due to the following two challenges: (1) the pattern space is combinatorial, so the number of patterns that a mining task produces is generally too large to process by an end-user; (2) for various data analysis tasks, frequency threshold is not a sufficient filter criterion for selecting patterns. To overcome (1), many works have been proposed for pattern summarization and compression [19, 32], and to overcome (2), several alternative interestingness metrics, such as, Jaccard index, odds ratio, and lift [35] have been proposed which can be used together with frequency. Nevertheless, interesting pattern discovery still remains an unsolved problem due to the subjectivity in the definition of interestingness. In many cases, for a specific user, off-the-shelf interestingness metrics does not represent her true interestingness over patterns. Pattern summarization does not help either, as such an approach solves interesting pattern discovery from a global perspective which is far from personalization what is needed to meet the pattern discovery demand of a specific user.
There exist a few works which target personalized pattern discovery by using users feedback [33, 6, 4]. The overall methodologies of these works are to build an interactive pattern discovery system, that works as the following—a user provides ratings on a small collection of patterns, then the system uses these rating to train a personalization model, which is later used to isolates user’s preferred patterns from the remaining patterns. Major design choices of an interactive pattern discovery system are: (1) genericness, i.e. the kinds of patterns that the system supports; (2) pattern selection process for feedback—whether it is active [26] or non-active; (3) learning model that the system uses; and (4) feature representation of patterns for facilitating learning. Existing solutions for interactive pattern discovery are poor on multiple among the above design choices. We elaborate more on this in the following paragraphs.
The majority of the existing platforms for interactive pattern discovery only support itemset patterns because they do not have an effective metric embedding for more complex patterns, say, sequences, or graphs. Metric embedding of patterns is needed for facilitating the training of a model which discriminates between interesting and not-so-interesting patterns. For itemset patterns, existing works leverage bag of items for instrumenting a metric representation. However, no such natural instrumentation is available for complex patterns, such as a sequence, or a graph. Sometimes, n-grams are used for metric embedding of sequences [2], and topological measures, such as centralities, eccentricity, egonet degree, egonet size, and diameter are used for feature representation of graphs [17]. While the above feature representation may work well for the task of traditional sequence or graph classification, they do not work well for frequent patterns which are numerous and small in size. So, a generic yet principled approach is needed for metric embedding of complex patterns, such as sequences and graphs.
For any interactive learning platform, designing a method for selecting a small set of patterns for which a user’s feedback is sought is critical. Given that the number of frequent patterns is typically enormous, the performance of interactive learning depends critically on the module that selects the patterns for collecting user’s feedback. Most of the existing interactive pattern discovery works [33, 4] heavily entangle model learning with the feedback set selection; i.e. the influence of a model which is trained on the prior sets of feedback is high when they select patterns for a user’s feedback. So, the initial sets of feedback play a significant role to the model’s configuration hence, the model may risks suffering from the positive reinforcement phenomenon. In other words, high influence of the current model to select patterns for obtaining the user’s feedback in the next iteration is similar to exploitation in active learning [7]. It sometimes makes the predictive model represents some areas of the pattern space, making it sub-optimal over the entire pattern space.
In this work, we propose a generic framework for interactive personalized interesting pattern discovery (IPIPD) called PRIIME111PRIIME is an anagram of the bold letters in geneRic fraMwork for Interactive pErsonalized Interesting Pattern discovery by incorporating a user in the discovery pipeline. The proposed method uses preference rating of a small set of frequent patterns from the user to learn her interestingness criteria and recommend a set of patterns which incline the most towards her choice. To address the challenges discussed above, we develop a neural net based unsupervised feature vector representation scheme for sequence and graph patterns. We propose a pattern selection approach for feedback to combat the positive reinforcement phenomenon. We also assume that feedback is given using positive real discrete values, where a higher value stands for more empathy towards the given pattern. For example, a user can have a three-class rating system, where 1, 2 and 3 means dislike, not sure and likes the pattern.
In recent years, unsupervised feature learning using traditional and deep neural networks has become popular. These methods help an analyst discover features automatically, thus obviating feature engineering using domain knowledge. Researchers achieve excellent performance with these unsupervised learning techniques for extraction of features from text [20], speech [29] and images [30]. Recently in [23], authors have shown the potential of building unsupervised feature representation of the vertices of an input graph for vertex classification [23]. PRIIME’s metric representation method for graphs and sequences is motivated from these works. Specifically, for a set of sequence or graph patterns, PRIIME maps each pattern into a sentence and pattern elements (items in a sequence or edges in a graph) as words. Afterwards, it leverages a language model similar to [16] for finding -dimensional feature vector representation of the patterns. We experimentally show that such technique performs better than the existing ad-hoc metric embedding.
PRIIME also provides a robust pattern selection strategy for rating solicitation. Unlike earlier interactive pattern discovery works [33, 4], for the case of PRIIME, the coupling between the existing state of the learning model and the training set selection is significantly reduced which yields a much-improved learning model. In fact, PRIIME’s strategy is a combination of exploration and exploitation which enables it to reduce the bias that existing state of the learning model imposes on pattern selection. Exploitation aspect of the proposed strategy prefers patterns (for feedback solicitation) that are likely to influence the learning model the most, i.e. have the largest impact on model’s parameters. On the other hand, the exploration aspect ensures that a broader span of the pattern space is covered. PRIIME maximizes expected gradient length (EGL) [27] (an active learning strategy) for exploitation and it chooses a diverse set of patterns using -center [1] search for exploration. We empirically show that a combination of above two triggers better learning performance than the existing interactive pattern discovery frameworks.
We claim the following contributions:
We propose a generic interactive personalized interesting pattern discovery framework called PRIIME that is based on iterative learning of a user’s interestingness function using the supervised classification model. The system does not require any prior knowledge of the user’s interestingness criteria and needs a limited degree of user engagement.
We develop an efficient unsupervised feature construction scheme for sequence and graph patterns and propose a pattern selection strategy combining exploitation and exploitation for feedback collection.
We perform exhaustive empirical validations of the proposed framework using real-world set, sequence, and graph datasets. We show that the proposed feature construction and pattern selection performs better than the existing ones. To show the applicability of the interactive solution of personalized interesting pattern discovery, we present a case study from the real-estate domain using a real-life housing data.
The reminder of this paper is organized as follows. In Section 2, we discuss in detail of the proposed framework. In Section 3, we talk about the learning algorithm of the framework including pattern representation (Subsection 3.1), classification model (Subsection 3.2) and feedback mechanism (Subsection 3.3). In Section 4, we present an extensive empirical evaluation including the performance of the learning algorithm (Subsection 4.4), neural net based unsupervised feature construction (Subsection 4.6) and comparisons with the existing methods (Subsection 4.5). In Section 5, we present a case study to establish the real life application of the proposed framework in a real-estate domain problem. We conclude the paper with related works (Section 6) and a conclusion (Section 7).
2 Problem Definition and System Architecture
Consider, a transactional dataset ; each transaction in is a combinatorial object, such as an itemset, a sequence, or a graph. Depending on the kind of objects in , it can be an itemset dataset, a sequence dataset or a graph dataset. A user is interested in mining interesting patterns from , where the patterns (denoted by set ) are sub-objects, say subsets, subsequences, or subgraphs, over the objects in . Traditional approaches consider frequency as the interestingness metric and design frequent pattern mining algorithms which return patterns that exceed minimum support thresholds over the transactions in . However, due to the fact that the frequent pattern space is combinatorial, existing frequent pattern mining algorithms generally return a large number of patterns causing information overload. Interactive pattern mining is a framework for negotiating information overload so that a succinct set of interesting patterns (a small subset of frequent patterns, ) can be delivered to , which are personalized by utilizing ’s feedback on a small number of patterns. We call this framework IPIPD, which stands for interactive personalized interesting pattern discovery. PRIIME, our proposed method in this paper follows this framework.
We assume, possesses an interestingness function (say, ) over the frequent patterns, ). maps each pattern in to a positive integer number indicating interestingness criteria of the user i.e., . PRIIME learns through an active learning process over multiple learning iterations. During an iteration (say ), the system returns a set of patterns to , which is selected from a partition of (which constitutes the ’th batch of pattern-set); sends feedback using an interactive console; ’s are positive integer numbers reflecting the user’s empathy towards the selected patterns; using the feedback the system updates its current model of the user’s interestingness function, . An alternative to our batch learning framework can be to mine all the frequent patterns and select a relatively smaller subset of patterns for getting a user’s feedback and use these for learning in one iteration. This approach is not scalable as the number of frequent patterns in is typically very large even for a moderate-size dataset. Besides, if the learning entity receives the frequent patterns as a data stream the one-iteration learning becomes infeasible, but a batch learning framework still works.
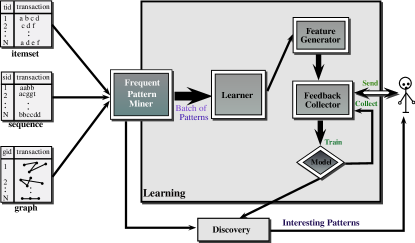
The IPIPD framework of PRIIME is partitioned into two main blocks: Learning and Discovery (Figure 1). Learning learns a model for a user; it contains following five modules: Frequent Pattern Miner (FPM), Learner, Feature Generator (FG) and Feedback-Collector (FC), and Model. The FPM works as a bridge between the Learner and the data. FPM module can be any off-the-shelf pattern mining algorithm that mines frequent patterns given a normalized minimum support threshold. Any of the existing off the shelf pattern mining algorithms ranging from sequential [3] to randomized [15], can be used. The Learner learns ’s interestingness function () over the pattern-set in multiple stages while utilizing user’s feedback on a small number of patterns selected from a partition of in each stage. The Feature Generator (FG) module is responsible for generating efficient and appropriate feature vector representation of the incoming patterns for the Feedback Controller and the Model to use. FG uses the bag of words method for set patterns and NN-based unsupervised language model for sequence and graph patterns. The Feedback-Collector (FC)’s responsibility is to identify the patterns using a exploitation-exploitation based strategy (explained in Section 3.3), that are sent to the user for feedback. Note that, patterns are sent to the user for feedback in its original form, not in the feature vector representation. Discovery delivers personalized interesting patterns to the user using the learned model.
We like to highlight one relevant fact about the learning task of the proposed framework. In the learning phase, the interaction between the FPM and the Learner is one-way, from the FPM to the Learner, and the Learner has no influence over FPM’s mining process. This setup works well for large datasets for which the mining task may take longer time, yet the learning task can start as soon as the first batch of patterns is available. Moreover, if a user wants to end the learning session before FPM finishes, the learner can still recommend patterns to the user based on the current learning model.
PRIIME_Learning:
comment: is the transaction dataset,
1. = Train feature generation model()
2. Initialize model parameters
3. while 1:
4. = Incoming batch of patterns from
5. = Get feature representation(,)
6. = Collect feedback()
7. = Train learning model(,)
8. if -|| < :
9. break
10. =
11. return
3 Learning Method
In PRIIME , the learning of interestingness function and pattern mining by FPM proceeds in parallel over a few iterations. In the ’th iteration, PM generates a partition () of frequent pattern set , and Learner selects patterns from and send them to for rating. Meanwhile, FG obtains , the feature representation of the patterns . Partitioning of frequent pattern enables model learning to proceed even if all the frequent patterns are not available, which is better than earlier works [33] where model learning is performed after the entire is available. Learner collects ’s rating using an interactive console. Then the Learner updates its current model using .
In Figure 2, we present the pseudo code of PRIIME’s learning phase. PRIIME starts by training the unsupervised feature generation model using the transaction data and initializes the learning model . Afterward in each iteration, it uses to infer the feature representation of each pattern in the incoming batch . Then the algorithm selects patterns for feedback and sends them to the user. Once it receives the feedback, it updates the current learning model. The algorithm continues until the improvement of the learning model falls below a user-defined threshold. In the following, we discuss each of the tasks.
3.1 Pattern Representation
Say is a transaction dataset. is the set of all single length frequent patterns. is a set of item, a set of events, or a set of edges depending on whether is an itemset, a sequence or a graph dataset, respectively. For a given support threshold, is the set of all frequent patterns. For using a machine learning method for finding interesting patterns, PRIIME first finds a feature vector representation of these patterns.
3.1.1 Set Patterns
For a set data, each transaction is a collection of non-repetitive items. Considering the dataset as a text corpus and each transaction in the corpus as a document, the set can be represented as the dictionary of frequent words i.e. items. Following the bag of words model, we represent each pattern as a binary vector of size , constructed as below:
Such a representation maps each pattern to a data point space. For example, consider a dataset in which , , , and are frequent items. Thus ; A frequent pattern will be represented by the vector ; a pattern will be represented by the vector and so on.
3.1.2 Sequence Pattern
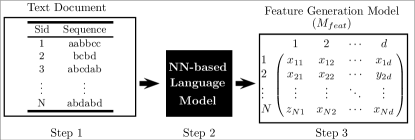
In sequence dataset , each transaction is an ordered list of events. For example, is sequence and , and are events. Similar to set, One can view the dataset as a text corpus and sequence of events in a transaction as a sentence in a language, where the events are the words. Given a set of sentences, our objective is to find a language model in which a sequence has a metric embedding in an appropriately chosen vector space. To obtain the language model, we apply Paragraph Vector [16]. It finds the -dimensional ( is user defined) feature representation of all sequences in .
In Figure 3, we illustrate how we compute feature representation of the sequences in . As we can see, we treat sequences as sentences in a text corpus (step 1 in Figure 3). In the 2nd step, we pass the corpus in the language model (shown as a black box in Figure 3). As an output (step 3 in Figure 3), language model produces feature representation of a given length (dimension) for all transactions, i.e. sequences (). Note that, training of such language model is computationally expensive and perform training in each iteration of PRIIME with the incoming batch of patterns is inefficient. As an alternative, PRIIME trains the model say, using the dataset as training data (Line 1 in Figure 2). Afterward in each iteration, it populates -dimensional feature vector of incoming patterns by using .
3.1.3 Graph Pattern
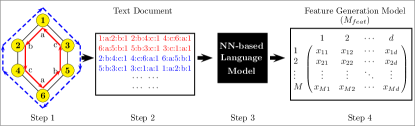
In graph dataset , each transaction is a labeled, undirected and connected graph. In order to use neural network based unsupervised language model, we have to map the dataset to a text corpus and the graphs in to sentences, on which we apply Paragraph Vector [16]. For converting a graph into sentence(s) we break the graph into a collection of simple paths, such that edge ordering is maintained in each path. Each path can then be viewed as a sentence and the edges in the path as words. To construct these paths from a graph , for each node in , we perform a dfs-walk originated from that traverse all the edges in . The motivation of using dfs-walk is that it preserves topological information of a graph around the originated vertex; multiple dfs-walks originated from different vertices capture topological information of the entire graph. Besides, it provides an ordering of edges in the paths which serves as sentences. The number of paths that we generate from each graph is exactly equal to the number of vertices in the graph because each dfs-path is originated from a distinct vertex in the graph.
Note that, for a set or a sequence dataset, we maintain a one-to-one mapping between the transactions and the sentences, but for graph, it is a one-to-many mapping. The primary reason for this is that a complex object like graphs cannot be represented by only one sequence of vertices. More importantly, the number of transactions for graph data is usually small (Table 1) compared to a dataset of sets and sequences. So populating one sentence per graph is not an optimal choice. In many of the existing works on machine learning, specifically in deep learning, artificial random noises are inserted to create distorted samples [28, 9] which greatly increases the training set size. In [28], authors proposed a technique called “elastic distortion” to increase the number of image training data by applying simple distortions such as translations, rotations, and skewing. However in the existing works, no such mechanism is available for training data inflation for a graph data. The one-to-many mapping that we use is such a mechanism which enables us to create many samples for a graph instance, thus increasing the learning ability of the model for graph patterns.
In Figure 4, we illustrate the entire process. In Step 1, we have a graph (transaction) with nodes and edges, where each of the nodes has a label. We assume all the edges share the same label (not shown in the figure). Step 2 obtains six dfs-walk edge sequences, on which two are shown in the figure—one dfs-walk originated from vertex (red ink) and the other originated from vertex (blue ink and dashed). Note that, it is possible to have dfs-walk with different ordering from a vertex but in this work, we allow one walk per vertex. Once we have such representation of the entire data , we feed the text corpus to the language model (Step 3) and finally for a given feature length , it trains the model () and produces feature vectors of all dfs-walks in the text corpus. During the classification stage for a pattern graph, we create only one dfs-walk from a randomly selected vertex and generate feature vector representation by using .
We give some perspective of adapting neural network based unsupervised language modeler [16] to model and find feature representation of a graph. Assume a sequence of words , where ( is the vocabulary) and a paragraph containing the sequence of words, a language model maximizes over all the training corpus. can be thought of as another word, which behaves as a memory that recalls what is missing from the current context (). When we map dfs-walks as sentences, estimated likelihood can be written as , which is the likelihood of observing a vertex in a walk given all the previously visited vertices and the walk . Note that, in the likelihood function does not necessary have to be at the end of the context (), rather a context of a vertex consists of vertices appearing to the left and right of the given vertex in the dfs-walk. The training of word vectors and paragraph vectors is done using stochastic gradient descent and the gradient is obtained via back-propagation. Please see [16] for more detail of the method.
3.2 Classification Model
The PRIIME models the user’s interestingness profile over the patterns as a classification problem and learns the model parameters through an interactive feedback mechanism. In each iteration, PRIIME executes a supervised training session of the classification model using the corresponding data points of the released patterns to the user. We use multinomial logistic regression as the classification model , which is known as softmax regression in the literature. In multinomial logistic regression, the probability that a data point belongs to class can be written as,
| (1) |
where, is the set of class labels and is the weight vector corresponding to class . The prediction of the model can be computed as, . Given a set of labeled training data , the weight matrix ( is the number of class and is the size of a feature vector) is computed by solving the convex optimization problem as shown in Equation 2 using gradient descent. Note that, each data points in the training set corresponds to a pattern.
| (2) |
Here is the notation to represent the cost function in Equation 2, is the indicator function indicating that only the output of the classifier corresponding to the correct class label is included in the cost. is the regularization term to avoid over-fitting. In each iteration, PRIIME applies L-BFGS-B optimization function implemented in python’s scipy package to train the model.
3.3 Selection of Representative Data-points for Feedback
As discussed in Section 1, one of the reasons of the superior performance of our proposed method over the existing ones is due to the exploitation-exploration based feedback collection. In each iteration, for an incoming batch, PRIIME exploits the currently learned model () to identify the patterns that will have the largest impact on the parameters of the learning model. We can identify those patterns by checking whether these patterns make the maximum change in the objective function. Since we train softmax classifier using gradient descent, we include the patterns to the training set if it creates the greatest change in the gradient of the objective function,
| (3) |
However, gradient change computation requires the knowledge of the label, which we don’t have. So, we compute the expected gradient length [27] of as shown in Equation 4,
| (4) |
After exploitation step, PRIIME retains the top of patterns () according to the expected gradient length (EGL) as candidates for feedback. However, Expected gradient length based approach enables PRIIME to identify patterns that can make greatest changes in the learning model, but it does not ensure diversity among the patterns in terms of its composition, i.e. two patterns can be made of similar items, events or edges. To ensures that a broader span of the pattern space is covered, PRIIME uses -center search (exploration) to identify patterns for feedback from the candidates set.
-Center. -center method finds data points as centers so that the maximum distance from each data point to its nearest center is minimized. This -center problem is NP-complete, but there exists a fast 2-approximation greedy algorithm that solves this problem in time [1]. We set to 10 in all our experiments. For choosing representative patterns, we use the greedy -center algorithm considering the Jaccard distance for set patterns and euclidean distance for sequence and graph patterns.
3.4 Stopping Criteria
The stopping criterion is an important element of our proposed system. The execution of PRIIME can be halted from the system side as well as the user side. PRIIME sets a minimum default iteration counts to and after 10th iteration, it keeps track whether getting additional feedback impact significantly on the learning model or not. If the improvement falls below to a threshold (), the execution of the feedback session halts.
4 Experiments & Results
4.1 Data
We use four set datasets, two sequence datasets, and two graph datasets to validate the performance of PRIIME. Two of the set datasets, Chess and Mushroom, are real-life datasets collected from FIMI repository222http://fimi.ua.ac.be/data/. The third one is an artificially generated electronic health record (EHR) dataset created by Uri Kartoun from Harvard University333http://bit.ly/1Db1yHo, which has health record of patients. To generate a class label for each patient, we identify whether the patient is diagnosed with arthritis, type-I/II diabetics or not 444Generally class label is not needed for pattern mining. We use the class labels to simulate user’s interestingness over the patterns.. The last set dataset is a drug side effects dataset collected from CIDER repository555http://sideeffects.embl.de/download/. This data contains drugs and associated side effects. We consider each drug as a transaction and side effects as the items. Each drug also has a class label based on the primary disease which it cures: cancer, heart diseases, brain diseases, pain, and others.
The two sequence dataset Reuters1 and Reuters2 is collected according to the procedure mention in a sequence classification work [36]. These datasets are prepared by extracting specific keywords from the entries in the Reuters-21578 corpus 666http://web.ist.utl.pt/~acardoso/datasets/r8-train-stemmed.txt. Reuters1 consists of word sequences labeled by either “earn” or “acq”. Reuters2 consists of sequences labeled by “interest”, “money-fx”, “crude” and “trade”. For more information see [36]. Out of the two graph datasets, one is called pdb, which is collected from predictive toxicology challenge777http://www.predictive-toxicology.org/ptc/. The other graph dataset, Mutagenicity-II is obtained from the authors of [8]. In Table 1, we present some basic statistics about these four datasets; is the minimum support threshold, and is the set of all closed frequent patterns. For each dataset, we choose in a way so that we can have a large number of closed frequent patterns for the validation of the system.
| # of | Avg. | ||||
| Type | Dataset | trans- | transac- | ||
| actions | tion size | ||||
| Chess | 3196 | 37 | 2100 | 99262 | |
| Set | Mushroom | 8124 | 22 | 1100 | 53628 |
| EHR | 10000 | 43 | 3000 | 104297 | |
| Drug-Side-effects | 996 | 99 | 220 | 117544 | |
| Sequence | Reuters1 | 4335 | 56 | 86 | 54193 |
| Reuters2 | 900 | 108 | 36 | 48209 | |
| Graph | PDB | 416 | 15 | 8 | 9246 |
| Mutagenicity-II | 684 | 24 | 8 | 20771 | |
4.2 Experimental Setup
An essential part of PRIIME is a pattern mining algorithm that mines frequent patterns and send them to the Learner in batches. We use LCM [31], spmf [11] and CloSpan [34] for mining closed set, sequence and graph patterns, receptively. A closed frequent pattern is defined as a pattern that does not have a super-pattern (super-set) that is frequent with the same support count [35]. The set of closed pattern, , is a subset of the set of frequent patterns, . Redundancy among the patterns in is substantially reduced in the patterns in , so learning a function over the patterns in is better than learning a function over the patterns in .
For performance evaluation, we make 5-folds of the data of which 4 folds are used for interactive training and 1 fold for testing. We use a grid search to tune regularization parameter and set it to . We run Gensim’s [24] implementation of Paragraph Vector model with the default parameter settings, except for the parameter (the dimension of feature vector), which we set it to for both sequence and graph after tuning it using grid search. We report the performance result using average weighted F-score (calculate F-Score for each label, and compute their average, weighted by the number of true instances for each label) over the folds. In each iteration, we approximately use of the training data to construct the batch and select patterns from the batch for feedback. Note that in the first iteration, PRIIME uses the -center search to find patterns for feedback. We implement PRIIME in python and run all experiments in 3 GHz Intel machine with 8GB memory.
4.3 Interestingness Criteria
Following earlier works [33, 4], for validating the proposed system we simulate the interestingness function of a user. The interestingness criteria of a pattern is derived from the class label of its predominating transactions. For example, if a pattern belongs to number of transactions among which and are the numbers of transactions with label and respectively; then . The corresponding label/feedback of is measured as if else .
4.4 Experiment on the Learner’s Performance
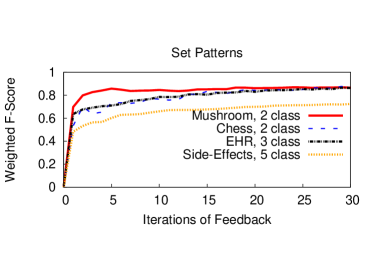
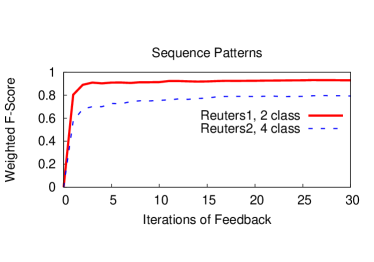
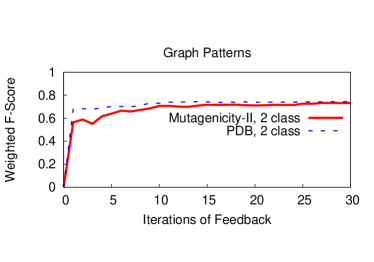
In this experiment, we evaluate the performance of softmax based learning algorithm using weighted F-Score metric. we show how the performance of the learning model improves with the iterations of feedback. As discussed earlier in each iteration, the learner selects ten patterns for feedback and iteratively updates the current model. After each iteration, we measure weighted F-Score of our currently learned model with the test fold. Then we plot F-score of the learner across the number of iterations executed so far. In Figure 5, 6 and 7, we show the progression of F-score across iterations for the set, sequence and graph datasets. The performance on set and sequence datasets is relatively better than that on graph datasets. The reason behind this is that effective feature vector construction for graph patterns is comparatively difficult than set and sequence patterns. For all the datasets, within five to ten iterations of feedback (each iteration has 10 patterns), learning method converges and stay stable. Compared to the entire (closed) frequent pattern space, the number of feedback that PRIIME use is almost negligible, yet the performance of the learning model is satisfactory.
| Dataset | Accuracy | Accuracy | Accuracy |
|---|---|---|---|
| PRIIME’s | ([33]’s) | [4]’s | |
| Chess | 90.8 % | 42.7% | 55.5% |
| Mushroom | 84.5% | 45.3% | 61.4% |
| EHR | 78.8% | 46.6% | 40.6% |
| Drug-Side-Effects | 71.9% | 36.3% | 54.50% |
| Reuters1 | 91.1% | 35.9% | NA |
| Reuters2 | 76.6% | 38.2% | NA |
| PDB | 73.1% | NA | 50.7% |
| Mutagenicity-II | 66.8% | NA | 44.7% |
4.5 Comparison with the Existing Algorithms
To compare with the existing works we implement [33]’s interactive learning method in python and compute the percentage accuracy experiment of their method for the set and sequence data by following the instructions provided in the paper [33]. We also compare with [4]’s sampling algorithm (executable collected from the authors) for the set and graph data; we pick sampler’s recall metric mentioned in [4] as it computes the percentage of interesting patterns recovered by the sampler. For all algorithms, we use 100 feedback and use the percentage of accuracy as a comparative metric. Table 2 shows the comparison, which clearly demonstrates that our algorithm performs substantially better than the existing methods. We validate that this performance boost can be credited to efficient feature construction for complex patterns and intelligent exploitation-exploration strategy for feedback pattern selection. We will discuss more on this in the following sections.
4.6 Comparison of Unsupervised Feature Learning Approach with Others
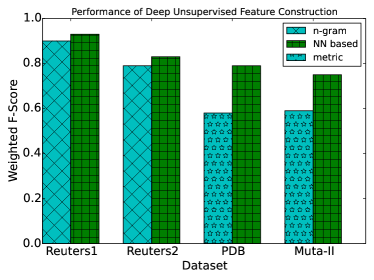
In this experiment, we evaluate the effectiveness of the proposed unsupervised feature construction based approach with alternative feature representation for sequence and graph patterns. For sequence pattern, we use n-gram based technique, where we extract all 2-grams and 3-grams from the data and use those as features. For graph patterns, we obtain topological metrics compiled by [17] and consider these metrics as features for graph patterns. We run PRIIME for iterative sessions (100 feedback) and use the weighted F-score for comparison. In figure 8, we show the findings using bar chart. First two groups of the bar chart are for sequence datasets and the remaining two groups are for graph datasets. As we can see, PRIIME’s unsupervised feature learning performs better than the alternative feature representation of both sequence and graph patterns. Specifically, PRIIME’s feature embedding for graph datasets is significantly better than that of the competitors’.
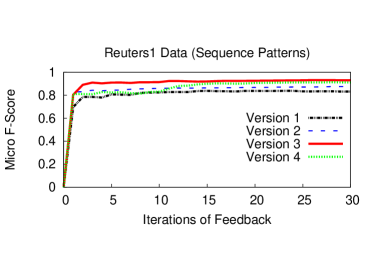
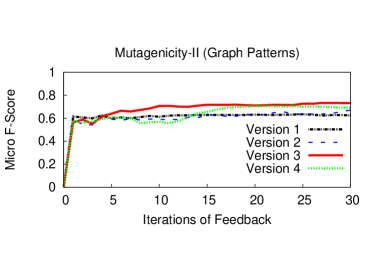
4.7 Representative Patterns Selection
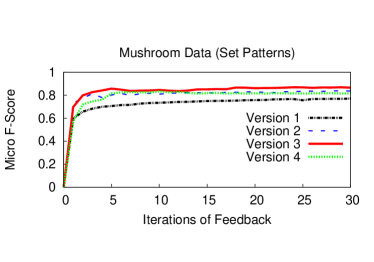
As discussed in Section 1, our proposed solution is different than the existing works on how we select patterns for feedback. To show that our approach is more effective, we create four different versions of PRIIME . In one, we solely rely on exploitation i.e pick top patterns for feedback from a batch according to the expected gradient length (EGL). In second, we concentrate on exploration and select most diverse patterns for feedback using only k-center from the entire batch. The third version is the one that we proposed in this work, where we retain top 50% patterns from a batch according to the EGL then apply k-center to find most diverse patterns for feedback. In fourth, we use only k-center (exploration) in the first interactive sessions, then we use the combination of EGL and k-center (exploitation-exploration) like third version for the next 10 iterations, and in final 10 iterations, we only use EGL (exploitation). In Figure 9, 10 and 11, we show the performance of the above four versions of PRIIME for a set, sequence, and graph data. As we can see, for all the cases, our proposed exploitation-exploration (Version 3 curve in the figures) strategy performs better than the other three options. Our’s performance better than the fourth version (Version 4 in the figures) establish the fact that in interactive pattern discovery, balancing exploration and exploitation in all iterations of learning is beneficial than gradually changing from exploration to exploitation like the fourth version. More importantly, the performance of the learning methods that solely depends on the current learning (Version 1 in the Figures) is the lowest among all three, which suggests that high exploitation of the current model for selecting patterns for feedback may yield sub-optimal model.
5 Case Study
To demonstrate the applicability of interactive personalized interesting pattern discovery in a real world setting, we perform a case study in the real-estate domain. Generally, the success of a home searching process depends on a user’s ability to construct a well-defined search query. It also depends on her patience while going through the hundreds of houses that are returned by the search engine. This assessment is particularly challenging for new home buyers, who are, sometimes not even familiar with all different home features. The overall process of selecting the right home takes time; actually, for 40% of first time home buyers, the lag time between research and action (buying a home) is around 120 days [12]. Given that home buying is a significant investment, most home buyers take help from an experience real estate agent who can read the buyer’s mind as soon as possible and show her the home that is just right for her.
PRIIME in this setup works just like a virtual real estate agent for the home buyers; where each house can be thought of as a set type transaction and house features as the items in the transaction. In each iteration, PRIIME presents a set of frequent patterns which are a summary set of features of the houses in the data. By utilizing the feedback over the quality of patterns PRIIME gradually learns the user’s interestingness criteria on the house features. Finally, using the learned model PRIIME identifies the house summaries (patterns) as well as the houses that the user will prefer. In the following, we will explain in detail from the data collection, experimental setup, and observations.
5.1 Data
We crawl trulia.com from November 2015 to January 2016 (3 months) for five major cities: Carmel, Fishers, Indianapolis, Zionsville and Noblesville in the Central Indiana. The information that we crawl is the basic house information, text on house detail, school, and crime information. In total, we crawl houses among which are from Carmel, are from Fishers, are from Indianapolis, are from Zionsville and are from Noblesville. We choose Central Indiana home market because of our familiarity with the region.
To clean the crawled text data we use standardized data cleaning approach, i.e. remove stop words, stemming and lemmatization of words. We have manually cleaned some keywords that are written in unstructured abbreviated form. For example, keyword fireplace is written as frplc, or firplc in many house details. In order to compile house features set, we use Rake [25] to find the key phrases. Next we group the key phrases, where we keep two key phrases together if they share at least one keyword. That way, we get all the features of a category together. For example, all the key phrases related to basement grouped together. Finally, we manually investigate these groups and identify specific house features. In the end, we retain only those house features that appear in at least ten (10) houses. The total number of house features we extracted from the crawled data is 130 that includes interior features, neighborhood features, and school information.
5.2 Setup
We empirically evaluate PRIIME by demonstrating its performance over a
demographic group of home buyers. We identified a group from
the yearly report of realtor.com [21]
and populate a potential house features set that this group might like. The group is a
median-income couple with kids. People in this demographic group are of age between to .
We select first features related to the type of a house and nearby schools quality.
Next features related to the neighborhood of a house. Third set of features are related
to the interior of a house. According to the report [21],
of the peoples in the group prefer single family home and
of the individuals in this group want good quality nearby schools,
so we select Single Family Home, Nearby schools, Above Average Quality Primary School,
and Above Average Quality Middle School as house features.
of families with kids prefer nearby parks, playground, so
we pick Neighborhood playground, Trails, Community pool and Lowest crime rate.
of this demography have kids and most likely they prefer
houses with open concept design, spacious, easy to maintain, common and work area,
and large kitchen with necessary amenities. With that in mind, we pick,
Open concept, 4 Bedrooms, 3 Bathrooms, 2 car garage, finished basement,
Large Master Bedroom, Hardwood floor, Open Concept kitchen,
Stainless-steel appliance, Granite countertop and island, Dual sink,
Many cabinets, Common area, Work area and Large backyard.
5.3 Experiment and Observations
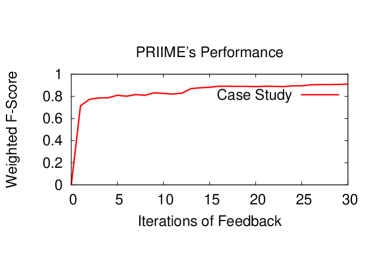
After generating features set associated with the demographic group, we first create labels for the mined closed patterns from the data with support. We assign label 1 (interesting) to a pattern if it contains or more features from the devised features set, otherwise 0 (non-interesting). Next, we split the patterns set into train and test and execute PRIIME over the training split. We set the batch size to and consider patterns for feedback in each iteration. We measure the classification performance of PRIIME in terms of weighted F-Score.
First, we observe how PRIIME’s performance changes with the interactive sessions. In Figure 12, we plot PRIIME’s performance using weighted F-Score over the test data in the y-axis, and plot iterations count of PRIIME in the x-axis. As we can see, the performance of the system improves with iterations of feedback. After iterations, PRIIME reaches to a reasonable performance with a Weighted F-Score higher than . PRIIME reaches to a stable position in terms of performance after iterations.
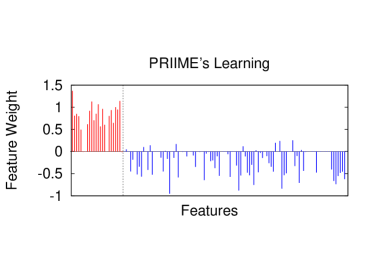
To illustrate the training quality of the learning module in PRIIME, we create a bar chart with the feature weights of the model. To visually show the distinction between weights of the selected features set from the weight of the rest of the features, we divide the plotting area into two regions, in the left region we display the weights of the selected features set in red ink and in the right region we show the weight of the rest of the features in blue ink. As we can see in Figure 13, PRIIME puts positive weights on the features from the selected set and negative weight to the majority of other features. Few features in the right side of the plot have positive weight and we found that top two (according to weight) of these features are many windows and counter space which are related to the selected open concept and open concept kitchen feature. Note that, the learned features weights used in the bar chart is collected after iterations.
6 Related Works
There exist a few works which target personalized pattern discovery by using users feedback. In [33] the authors propose a model that learns a user’s ranking function over the frequent itemsets. They start with the entire set of closed frequent itemsets, and send users a small list of patterns; the user provides a complete ordering among the patterns which the model uses as constraints in an SVM ranking based model. The model chooses the next batch of patterns for feedback using the learned SVM ranking model. Bhuiyan et al. [4] propose another interactive pattern mining framework, where the user interacts with a Markov Chain Monte Carlo (MCMC) sampling entity, which samples frequent patterns from hidden data. The target distribution of the sampler is iteratively refined based on binary feedback from the user. Boley et al. [6] propose a co-active based approach for interactive pattern mining, which use user’s feedback to decide between searching and sampling of patterns from the output set. There also exist a few other works [18], which mine a small set of interesting patterns by defining novel interestingness metrics for frequent patterns. For instance, Mampaey et al.[18] summarizes the frequent pattern set and Blei et. al.[5] defines subjective interestingness, both using maximum entropy model. [14] develops a toolbox with interestingness measures, mining and post-processing algorithms as built-ins that can assist a user to visually mine interesting patterns. However, the scope of these works is different than our work.
There are some recent works on interactive knowledge discovery which solves domain specific problems. Examples include mining geospatial redescriptions [13], and subgroup discovery [10, 22]. In the work on mining geospatial redescriptions [13], the authors propose a system called SIREN, in which a user builds queries based on his interests and the system answers the queries through visualization of redescriptions (different ways of characterizing the same things). In [10, 22], the authors present a framework which utilizes user’s feedback and devises a search procedure for finding subgroups.
7 Conclusion
In this work, we propose a generic framework of interactive personalized interesting pattern discovery called PRIIME. The proposed method uses user’s rating on a small collection of patterns for learning a user profile model, which at a later stage can be used for recommending patterns that best align with user’s interests. Such a method is highly useful for identifying a small number of interesting patterns where interestingness is defined through user’s rating.
References
- [1] Clustering to minimize the maximum intercluster distance. Theoretical Computer Science, 38(0):293–306, 1985.
- [2] C. C. Aggarwal. Data classification: algorithms and applications. CRC Press, 2014.
- [3] R. Agrawal and R. Srikant. Fast algorithms for mining association rules in large databases. In Proc. of VLDB, pages 487–499, 1994.
- [4] M. Bhuiyan, S. Mukhopadhyay, and M. A. Hasan. Interactive pattern mining on hidden data: A sampling-based solution. In Proceedings of the 21st ACM CIKM, pages 95–104, 2012.
- [5] T. D. Bie. Maximum entropy models and subjective interestingness: an application to tiles in binary databases. Data Mining and Knowledge Discovery.
- [6] M. Boley, M. Mampaey, B. Kang, P. Tokmakov, and S. Wrobel. One click mining-interactive local pattern discovery through implicit preference and performance learning. In KDD 2013 Workshop IDEA, 2013.
- [7] A. Bondu, V. Lemaire, and M. Boulle. Exploration vs. exploitation in active learning : A bayesian approach. In Int. Joint Conf. on Neural Networks, pages 1–7, 2010.
- [8] S. Bringmann, A. Zimmermann, L. Raedt, and S. Nijssen. Don’t be afraid of simpler pattern. In PKDD, pages 55–66, 2004.
- [9] D. Ciresan, U. Meier, and J. Schmidhuber. Multi-column deep neural networks for image classification. In Computer Vision and Pattern Recognition (CVPR), 2012 IEEE Conference on, pages 3642–3649, 2012.
- [10] V. Dzyuba and M. van Leeuwen. Interactive discovery of interesting subgroup sets. In Advances in Intelligent Data Analysis XII, volume 8207, pages 150–161. 2013.
- [11] P. Fournier-Viger, A. Gomariz, T. Gueniche, A. Soltani, C. Wu., and V. S. Tseng. SPMF: a Java Open-Source Pattern Mining Library. Journal of ML Research (JMLR), 15:3389–3393, 2014.
- [12] A. J. S. from The National Association of Realtors® and Google. The digital house hunt: Consumer and market trends in real estate. National Association of Realtors, 2013.
- [13] E. Galbrun and P. Miettinen. Siren: An interactive tool for mining and visualizing geospatial redescriptions. In Proceedings of the 18th ACM SIGKDD, pages 1544–1547, 2012.
- [14] B. Goethals, S. Moens, and J. Vreeken. Mime: A framework for interactive visual pattern mining. In ECML, pages 757 –760, 2011.
- [15] M. A. Hasan and M. J. Zaki. Output space sampling for graph patterns. In Proc. of VLDB, pages 730–741, 2009.
- [16] Q. V. Le and T. Mikolov. Distributed representations of sentences and documents. arXiv preprint arXiv:1405.4053, 2014.
- [17] G. Li, M. Semerci, B. Yener, and M. J. Zaki. Effective graph classification based on topological and label attributes. Stat. Anal. Data Min., 5(4):265–283, 2012.
- [18] M. Mampaey, N. Tatti, and J. Vreeken. Tell me what i need to know: succinctly summarizing data with itemsets. In Proc. of the 17th ACM SIGKDD.
- [19] M. Mampaey, J. Vreeken, and N. Tatti. Summarizing data succinctly with the most informative itemsets. ACM Trans. Knowl. Discov. Data, 6(4):16:1–16:42, 2012.
- [20] T. Mikolov, I. Sutskever, K. Chen, G. S. Corrado, and J. Dean. Distributed representations of words and phrases and their compositionality. In Advances in Neural Information Processing Systems 26, pages 3111–3119. 2013.
- [21] T. N. A. of Realtors. 2015 home buyer and seller generational trends.
- [22] B. Omidvar-Tehrani, S. Amer-Yahia, and A. Termier. Interactive user group analysis. In Proceedings of the 24th CIKM, pages 403–412, 2015.
- [23] B. Perozzi, R. Al-Rfou, and S. Skiena. Deepwalk: Online learning of social representations. In Proceedings of the 20th ACM SIGKDD.
- [24] R. Řehůřek and P. Sojka. Software Framework for Topic Modelling with Large Corpora. In Proceedings of the LREC 2010 Workshop on New Challenges for NLP Frameworks, pages 45–50.
- [25] S. Rose, D. Engel, N. Cramer, and W. Cowley. Automatic keyword extraction from individual documents. Text Mining, pages 1–20, 2010.
- [26] B. Settles. Active learning literature survey. University of Wisconsin, Madison, 52(55-66):11, 2010.
- [27] B. Settles, M. Craven, and S. Ray. Multiple-instance active learning. In Advances in Neural Information Processing Systems 20, pages 1289–1296. 2008.
- [28] P. Simard, D. Steinkraus, and J. C. Platt. Best practices for convolutional neural networks applied to visual document analysis. In Document Analysis and Recognition, 2003. Proceedings. Seventh International Conference on, pages 958–963, 2003.
- [29] R. Socher, E. H. Huang, J. Pennin, C. D. Manning, and A. Y. Ng. Dynamic pooling and unfolding recursive autoencoders for paraphrase detection. In Advances in Neural Information Processing Systems, pages 801–809, 2011.
- [30] C. Szegedy, W. Liu, Y. Jia, P. Sermanet, S. Reed, D. Anguelov, D. Erhan, V. Vanhoucke, and A. Rabinovich. Going deeper with convolutions. CoRR, abs/1409.4842, 2014.
- [31] T. Uno, M. Kiyomi, and H. Arimura. Lcm ver. 2: Efficient mining algorithms for frequent/closed/maximal itemsets. In Proc. IEEE ICDM’04 Workshop FIMI’04, 2004.
- [32] J. Vreeken, M. Leeuwen, and A. Siebes. Krimp: Mining itemsets that compress. Data Min. Knowl. Discov., 23(1):169–214, 2011.
- [33] D. Xin, X. Shen, Q. Mei, and J. Han. Discovering interesting patterns through user’s interactive feedback. In Proc. of the 12th ACM SIGKDD, pages 773–778, 2006.
- [34] X. Yan, J. Han, and R. Afshar. Clospan: Mining closed sequential patterns in large datasets. In In SDM, pages 166–177. SIAM, 2003.
- [35] M. J. Zaki and J. Wagner Meira. Data Mining and Analysis: Fundamental Concepts and Algorithms. Cambridge University Press, 2014.
- [36] C. Zhou, B. Cule, and B. Goethals. Itemset based sequence classification. In Machine Learning and Knowledge Discovery in Databases, pages 353–368. Springer, 2013.