Hidden Order Signatures in the Antiferromagnetic Phase of U(Ru1-xFex)2Si2
Abstract
We present a comprehensive set of elastic and inelastic neutron scattering measurements on a range of Fe-doped samples of U(Ru1-xFex)2Si2 with 0.01 0.15. All of the samples measured exhibit long-range antiferromagnetic order, with the size of the magnetic moment quickly increasing to 0.51 at 2.5% doping and continuing to increase monotonically with doping, reaching 0.69 at 15% doping. Time-of-flight and inelastic triple-axis measurements show the existence of excitations at (1 0 0) and (1.4 0 0) in all samples, which are also observed in the parent compound. While the excitations in the 1% doping are quantitatively identical to the parent material, the gap and width of the excitations change rapidly at 2.5% Fe doping and above. The 1% doped sample shows evidence for a separation in temperature between the hidden order and antiferromagnetic transitions, suggesting that the antiferromagnetic state emerges at very low Fe dopings. The combined neutron scattering data suggests not only discontinuous changes in the magnetic moment and excitations between the hidden order and antiferromagnetic phases, but that these changes continue to evolve up to at least = 0.15.
- PACS numbers
-
71.27.+a, 75.25.-j, 75.40.Gb, 78.70.Nx
I Introduction
The heavy fermion material URu2Si2 has been a subject of long-standing interest since the discovery of a phase transition at T0 = 17.5 K, thirty years ago Palstra_85 . Initially thought to be an antiferromagnetic transition, the small antiferromagnetic moment of 0.03 that arises in this material is far too small to account for the large specific heat jump at T0 Broholm_87 ; Broholm_91 . Three decades of research have produced a number of conclusions regarding the nature of this phase Mydosh_11 ; Mydosh_14 , but have failed to determine the order parameter, leading to this phase being dubbed the ‘hidden order’ phase. To study the behavior of the hidden order phase, a large number of perturbations have been applied to the system in the form of applied field, hydrostatic pressure and chemical substitution. In all cases, the hidden order phase is destroyed with relatively small perturbations: applied fields of 35 T Jo_08 , hydrostatic pressure 0.8 GPa Butch_10 and chemical substitution of typically greater than 5 % on any of the atomic sites Amitsuka_94 ; Endstra_93 ; Park_93 . In nearly every case, the hidden order state is suppressed continuously, and a ferro- or antiferromagnetic state emerges.
Neutron scattering has played an important role in determining the properties of the hidden order phase. For example, while careful study has shown that the small antiferromagnetic moment is present even in ultra-clean samples Bourdarot_14 , it is likely caused by inhomogeneous strain Amitsuka_07 . Within the paramagnetic phase above T0, inelastic neutron scattering measurements observed gapless, weakly dispersing features at the point on the Brillouin Zone (BZ) edge with = (1 0 0) ( = 0.407), while below T0, these excitations became gapped ( = 4.5-4.8 meV Bourdarot_14 ; Butch_15 ) and more intense Broholm_91 ; Wiebe_07 . It was determined that the gapping of these excitations results in an entropy change of sufficient size to account for the specific heat jump at T0 Wiebe_07 . Below T0 additional, commensurate excitations appear at the point of the BZ, , with a gap of = 1.7-1.8 meV Bourdarot_14 ; Butch_15 . This wavevector is the ordering wavevector for the antiferromagnetic moment in both the hidden order and more conventional magnetically-ordered phases. Since the transition at T0 is related to the gapping of the incommensurate excitations and the emergence of the commensurate ones, these have both been cited as possible ‘signatures’ of the hidden order state in neutron scattering experiments Mydosh_14 ; Bourdarot_14 .
The first instance in which perturbations were found to enhance the hidden order state was through the use of applied pressure. Application of pressure increased T0 slightly, reaching 18.5 K at a pressure of 0.5 GPa Butch_10 . However, at higher pressures, this system still transitions to an antiferromagnetic state; at T = 0 this occurs at approximately 0.8 GPa. Pressures between 0.8 and 1.4 GPa have both a hidden order and a Neél transition, while above 1.4 GPa the transition is directly from paramagnetic to antiferromagnetic at TN = 19.5 K Butch_10 . Due to this interplay of hidden order and antiferromagnetism, studying the behavior under applied pressure has become of particular interest in trying to determine the nature of the unknown order parameter. Likewise, the chemical substituents that enhance T0 have also become an interesting avenue of research for determining the order parameter of the hidden order state. Of the dozens of chemical dopings that have been applied to URu2Si2 only two dopings, both on the Ru site, have been shown to increase the value of T0: Fe Kanchanavatee_11 and Os Kanchanavatee_14 . In both of these cases, the transition temperature continues to increase as a function of doping, over a large range, before dropping abruptly. Interestingly, of all of the pure compounds of the family USi2, = Fe and Os are the only two that are non-magnetic Endstra_93 ; Sandratskii_94 . Furthering the analogy between hydrostatic pressure and Fe/Os-doping, the doped systems are also observed to become more conventionally antiferromagnetic with increasing chemical pressure, however no signature of multiple transitions have been observed with transport measurements Kanchanavatee_11 ; Kanchanavatee_14 . It was speculated that these systems experience only a gradual crossover between the hidden order and antiferromagnetic states, although this remains an open question.
In this work, we use elastic and inelastic neutron scattering to measure the magnetic structure and excitations of various doping concentrations within the U(Ru1-xFex)2Si2 series, in an attempt to determine the nature of the hidden order-to-antiferromagnetic crossover, as well as whether the doped compounds contain inelastic signatures of the hidden order state and/or signatures of a conventional antiferromagnetic state (spin waves). Recently, neutron diffraction measurements have been carried out on a number of dopings in this series Das_15 , which found that the magnetic moment grows continuously from = 0 to = 0.05 and that at dopings above 5% the magnetic moment remains relatively constant at 0.8 . This leads the authors to suggest that 5% doping marks the hidden order-to-antiferromagnetic phase transition, analogous to the transition at 0.8 GPa in the parent compound under pressure Das_15 . This suggests that in order to study the nature of the excitations through the transition, it is important to measure dopings both above and below = 0.05.
II Experiment
Single crystals of U(Ru1-xFex)2Si2 with = 0.01, 0.025, 0.05, 0.10 and 0.15 were grown at McMaster University. Stoichiometric amounts of unpurified depleted Uranium, Ru (99.95%), Fe (99.99%) and Si (99.9999%) were arc-melted on a water-cooled copper hearth in a mono-arc furnace under an inert Ar atmosphere. The largest impurity in the Uranium precursor is elemental Fe at a level of 50 ppm, which is small (0.01%) when compared to the nominal doping concentrations. The resulting polycrystalline boule was then used to grow the single crystals using the Czochralski method. This was performed in a tri-arc furnace using a water-cooled copper hearth under a continuously-gettered Ar atmosphere at 900 ∘C. After the growths, the single-crystalline nature and sample alignments were confirmed with Laue x-ray diffraction.
These samples were studied using elastic and inelastic neutron scattering at the High-Flux Isotope Reactor (HFIR) and the Spallation Neutron Source (SNS) of Oak Ridge National Laboratory (ORNL). The diffraction measurements were performed on all of the samples using the HB-1A spectrometer at HFIR, while inelastic measurements were done on the HB-1 (for = 0.01 and 0.05) and HB-3 (for =0.025, 0.10 and 0.15) triple-axis instruments at HFIR, as well as the SEQUOIA time-of-flight spectrometer at the SNS (for =0.05 and 0.15). For comparison, data on the parent compound has been included where appropriate; this data was measured on the Multi-Axis Crystal Spectrometer (MACS) at the NIST Center for Neutron Research and was published previously Williams_16 . The neutron measurements described in this work were performed using 1 single crystal of each doping: the = 0.01 sample had a mass of 5.65(2) g and a mosaic of 4.5∘; the = 0.025 sample had a mass of 1.99(1) g and a mosaic of 1.3∘; the = 0.05 sample had a mass of 2.98(1) g and a mosaic of 10∘; the = 0.10 sample had a mass of 1.85(1) g and a mosaic of 3.0∘; and the = 0.15 sample had a mass of 1.74(1) g and a mosaic of 4.0∘. All of these samples were aligned in the [H 0 L] scattering plane for each of the neutron scattering experiments.
The HB-1A measurements were performed in a closed-cycle refrigerator with a base temperature of 4.0 K using a fixed incident energy of 14.7 meV. PG (002) monochromator and analyzer crystals were used with PG filters, and the collimation was 40’-40’-40’-80’. The HB-1 and HB-3 measurements were performed in closed-cycle refrigerators with a base temperature of 4.0 K using a fixed final energy of 14.7 meV. PG (002) monochromator and analyzer crystals were used with PG filters, and the collimation was 48’-40’-40’-120’. The SEQUOIA measurements were also performed in a closed-cycle refrigerator with a base temperature of 5 K, using a fixed incident energy of 30 meV. The crystals were rotated in the [H 0 L] plane in 1∘ steps over a 190∘ range.
III Magnetic Structure Determination
The neutron diffraction involved measurements of all of the Bragg peaks for which 4.7 Å-1, at 4 K and 30 K, as well as the temperature dependence of the (1 0 0) and (0 0 1) magnetic Bragg peaks. While the (0 0 1) peaks was found to have a weak magnetic signal, the -axis magnetic contribution was found to be consistent with what would be expected due to multiple scattering for Ei = 14.7 meV, suggesting that the magnetic moments point along the -direction. Multiple scattering was also encountered in the parent material, where the same magnetic structure was refined for the small, intrinsic moments Ross_14 .
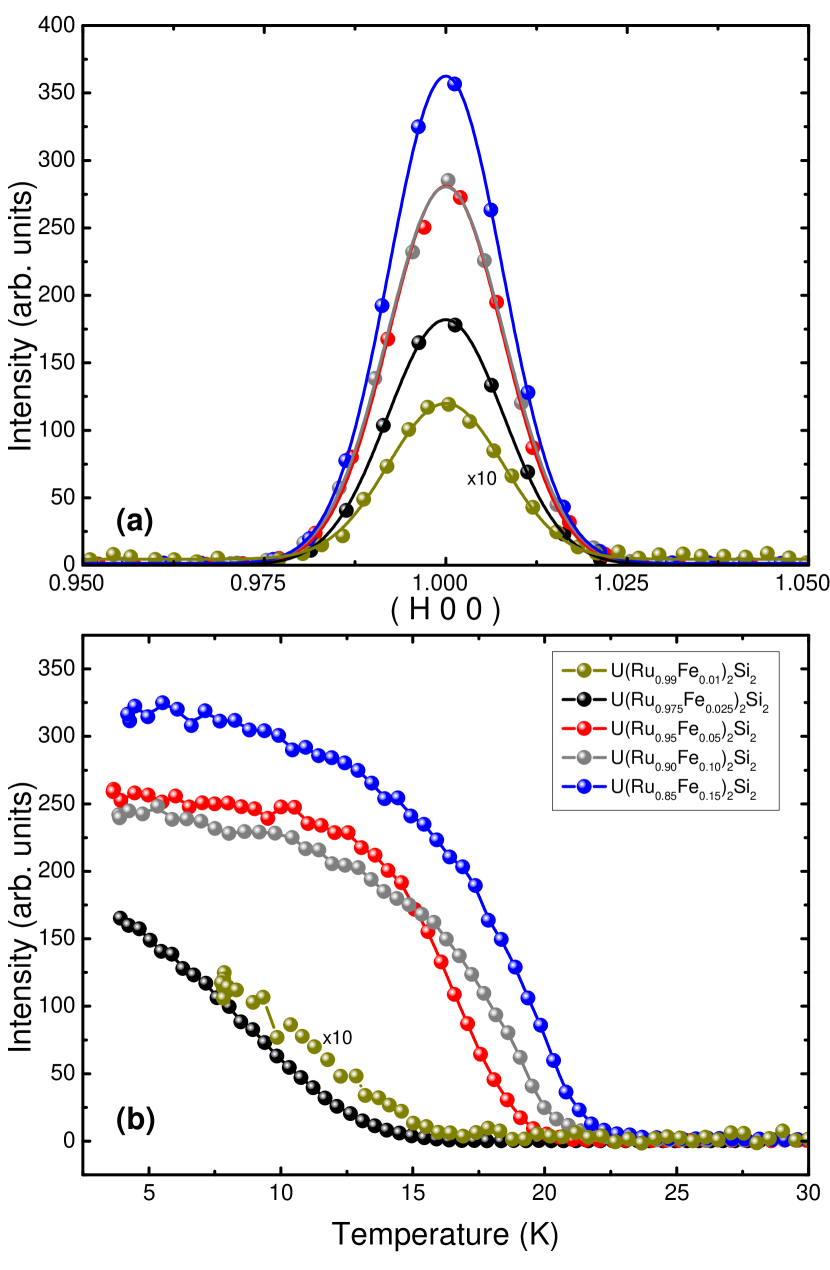
Fig. 1 shows the (1 0 0) magnetic Bragg peak at 4 K in the various Fe-doped samples (panel (a)) and their temperature dependence (panel (b)). This is a disallowed nuclear peak so there is no scattering from the sample above T0, as seen in the temperature-dependence. We observe the onset of magnetic scattering, and the transition appears to be second order in nature. The temperature dependence of the lowest two dopings, 1% and 2.5% do not show the same temperature dependence. Previous work using SR has shown that at these dopings, there is considerable phase separation between magnetic and non-magnetic regions, likely as a result of the random dopant distribution in these samples Wilson_16 . This is a likely origin of the observed temperature dependence of the magnetic Bragg peak. However, the peaks are resolution-limited at all dopings, suggesting that the magnetic order is sufficiently long-ranged. Using the 7 structural and 9 magnetic peaks collected on each sample, the magnetic structure and moment can be determined. In agreement with the parent material at ambient pressure and in the pressure-induced antiferromagnetic state, this magnetic structure has magnetic moments aligned along the -axis, with the body-centered moment antiparallel to the moments in the neighboring -planes Ross_14 .
| Doping (%) | TN (K) | Moment () | T0 (K) Wilson_16 | TN (K) Wilson_16 |
|---|---|---|---|---|
| 1.0 % | 15.0(5) | 0.048(5) | 17.5 | 16.0 |
| 2.5 % | 15.0(5) | 0.51(1) | ||
| 5.0 % | 20.0(5) | 0.59(1) | 21.0 | 21.0 |
| 10.0 % | 21.0(5) | 0.59(2) | 21.5 | 21.0 |
| 15.0 % | 22.5(5) | 0.66(2) | 25.5 | 25.0 |
The magnetic moment as a function of doping at T = 4 K was extracted from the integrated intensity of the (1 0 0) magnetic peak normalized by the integrated intensity of the (1 0 1) structural peak, with the proper Lorentz factors taken into account for both Bragg peaks. The (1 0 1) structural peak was chosen for the normalization to minimize the difference in instrumental Q-resolution at the two peak positions, since resolution effects were not incorporated in these calculations. This approach is in contrast to the method employed by Das et al Das_15 , who chose the higher order Bragg peak (6 0 0) for the normalization to avoid extinction effects. Neither normalization method accounts for the effect of multiple-scattering, which has been noted as significant in URu2Si2, but that is difficult to calculate directly Bourdarot_14 ; Ross_14 . This may produce differences in the size of the magnetic moments determined.
The moments that were extracted from the neutron diffraction measurements are shown in Table 1, along with the values of TN and T0 from SR in a previous work Wilson_16 . The values of TN from the measurement of the (1 0 0) magnetic Bragg peak are lower than those found by SR, likely due to the local probe nature of the SR measurements. The size of the moments agree well with the values determined from the internal field measurements based on the muon precession frequency, suggesting they are sensitive to the same magnetic ordering. The size of the moment in the Fe-doped samples is compareable to what is seen in the pressure-induced antiferromagnetic state of the parent compound Amitsuka_99 , except for the lowest doping (1%). In the lowest-doped sample, the size of the internal field determined by SR would suggest a moment size of 0.45 , however this was associated with a reduced volume fraction of 0.6 at T= 5 K Wilson_16 . The decreased moment seen by the neutron measurements is likely due to the phase separation between antiferromagnetism and the hidden order phase observed by the SR measurements. This would indicate that the transition from hidden order to antiferromagnetism occurs at a doping between 1% and 2.5%, lower than that suggested by Das et al. Das_15 . While we speculate that the difference in the moments may result from a different normalization method, the difference in the doping dependence may also be a result of differences in nominal and actual doping concentrations.
IV Inelastic Measurements
Fig. 2 shows the inelastic time-of-flight measurements of the 5% sample at 30 K (panel (a)) and at 5 K (panel (b)), as well as the 15% sample at 5 K (panel (c)). Fig. 2(a) shows measurements in the paramagnetic state. The inelastic spectrum seen here in the 5%-doped sample is identical to what is seen in the parent material above T0: gapless excitations emanating from = (0.6 0 0), and no excitation at = (1 0 0). Panel (d) illustrates what happens in the hidden order state of the parent material (this data is adapted from Ref. (19)). The excitation at becomes gapped, resulting in the entropy change seen by specific heat. Additionally, gapped excitations also appear at , albeit with a smaller gap and less intensity. Fig. 2(b) shows the excitation spectrum below the transition in the 5.0% Fe-doped sample. Relative to the parent material, we see that the incommensurate excitation is qualitatively unchanged. The gap appears to be larger, but with little change in the spin wave velocity, similar to what is observed under hydrostatic pressure Williams_16 . The commensurate excitation, however, shows a large change when compared to the pure material in the hidden order state. It is significantly weaker relative to the incommensurate excitation. Furthermore, the scattering that is present at the commensurate point in the 5% doping is only present at much higher energies.
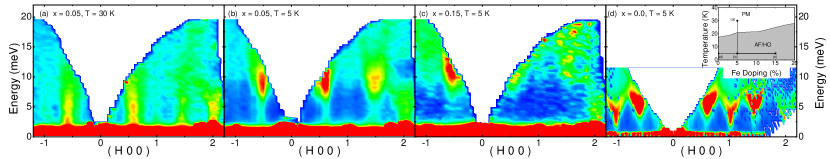
Moving to higher Fe-doping (15.0% in Fig. 2(c)), the weakening of these excitations seems to continue at both the commensurate and incommensurate points. Additionally, we observe that the gap at is larger than at = 0.05 or in the parent. This type of trend has been observed under pressure, where an increase in the transition temperature seems to correlate with an increase in the incommensurate gap, though the magnitude of the gap change in this system is much larger than what has been observed under pressure for the same change in the transition temperature Williams_16 ; Bourdarot_10 . The excitations also appear broadened, both in and . This would suggest that Fe doping distorts the Fermi surface, weakening the nesting that gives rise to the excitations Butch_15 . Furthermore, no additional excitations appear with Fe doping, including any conventional spin waves centered on the (1 0 0) magnetic Bragg peak. To more carefully investigate the changes in the excitations, inelastic triple axis neutron scattering measurements were performed at both and , above and below T0.
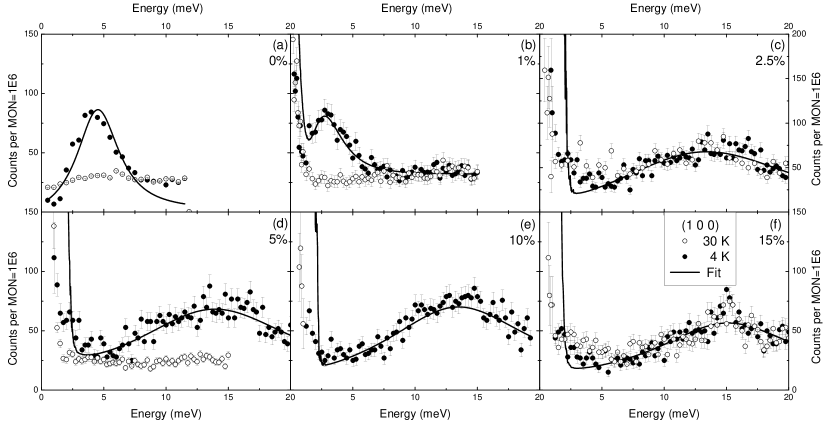
The inelastic triple-axis measurements at = (1 0 0) are shown in Fig. 3, at 30 K, above the transition (open circles), and at 4 K, below the transition (filled circles) for each of the measured dopings. The data for the 1% (panel (b)) and 5% (panel (d)) samples were taken on the HB-1 spectrometer, which had a lower background than the same measurements on the HB-3 spectrometer for the other Fe-doped samples. However, all samples clearly show the opening of the gap in the excitation spectrum below the transition. The same excitation in the parent compound is shown in Fig. 3(a) for comparison (data adapted from Ref. (19)). The solid line is a fit to the data, following the analysis of Ref. (3) and Ref. (19), given by:
| (1) | |||||
where is an overall scale factor for the intensity and is the Half Width at Half Maximum (HWHM) for the Lorentzian functions. With an energy gap , the dispersion relation reads:
| (2) |
where is the projection of the difference of the wave vector transfer from the critical wave vector perpendicular and parallel, respectively, to the -direction. The velocities used were those of the parent compounds, where = = = 23.7(5) meVÅ and = = 32.5(7) meVÅ Williams_16 . Eq. 1 was multiplied by a Bose factor and convoluted with the 4D experimental resolution function using Reslib Zheludev_07 . This under-estimates the elastic peak at (1 0 0) in Fig. 3 due to the elastic magnetic Bragg peak at this , but more reliably reproduces the quasi-elastic signal at the incommensurate (1.4 0 0) in Fig. 4. Since these measurements were most concerned with extracting the parameters of the inelastic excitation, no additional terms were included to model the elastic peak. The values obtained from these fits are given in Table 2, below.
We see that in the 1% doping, the commensurate excitation is nearly unchanged from the parent material; the gap and width are unchanged within error. However, we notice a dramatic change in the 2.5% doped sample, where the excitation is substantially broadened in energy and is peaked at much higher energies. The excitation is essentially unchanged with further increases in doping, with the gap energy and the width much larger than in the parent compound. This trend is shown in Fig. 5 where we can see the very abrupt changes in the gap (panel (a)) and the FWHM (panel (c)), which are relatively constant above 1% doping. It is also notable that the commensurate excitation is qualitatively unchanged across the phase transition, despite the emergence of the magnetic Bragg peaks at (1 0 0). In agreement with the time of flight measurements, no other excitations are present in any of the samples.
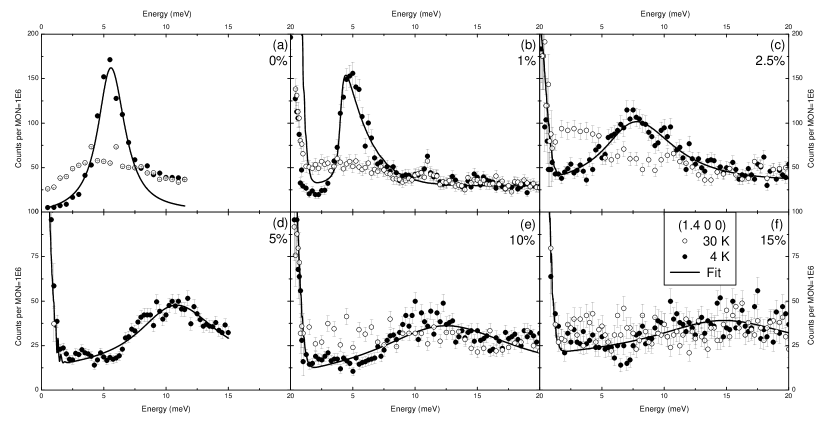
Fig. 4 shows the excitation that is present below T0 at = (1.4 0 0) as a function of doping. This excitation was fit in the same manner as the commensurate excitation, shown by the solid lines in Fig. 4. The values obtained from this fitting are given in Table 2. As with the commensurate excitation, the incommensurate excitation shows very little change at 1% doping relative to the parent compound. However, above 1% doping, rather than a discontinuous change, the incommensurate excitation exhibits a continuous broadening and upward shift in energy. As with the doping dependence of the magnetic moment, the incommensurate excitation shows a discontinuous change from the hidden order to antiferromagnetic phases, as well as a continued evolution over the entire range of Fe doping. This is apparent from looking at Fig. 5(a) and (c), where the gap and FWHM, respectively, show an increase over the full range of dopings measured. The excitation appears to weaken continuously with increasing Fe doping, but is present in all dopings measured with no additional excitations present.
| Doping | Wavevector | I (arb. units) | (meV) | (meV) |
|---|---|---|---|---|
| (1 0 0) | – | |||
| (1 0 0) | 1.55(3.77) | |||
| (1 0 0) | 6.99(2.13) | |||
| (1 0 0) | 10.28(3.08) | |||
| (1 0 0) | 7.01(1.95) | |||
| (1 0 0) | 6.04(1.34) | |||
| (1.4 0 0) | – | |||
| (1.4 0 0) | 5.12(3.08) | |||
| (1.4 0 0) | 5.26(2.26) | |||
| (1.4 0 0) | 2.48(78) | |||
| (1.4 0 0) | 0.59(26) | |||
| (1.4 0 0) | 0.25(25) |
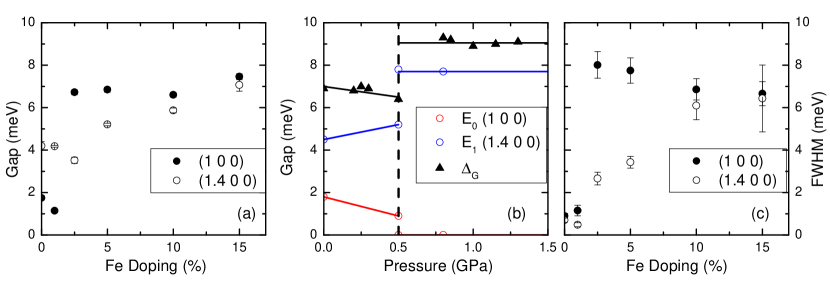
Comparing these results to the gap measured by inelastic neutron scattering under pressure (shown in Fig. 5(b)), we see that there is a similarity when considering the incommensurate excitation (blue circles). The application of pressure also increases the gap, though it is assumed that under pressure the gap jumps discontinuously at P0 = 0.5 GPa and is constant above. However, there may not be enough data points to be certain Bourdarot_10 ; Williams_16 ; Villaume_08 .
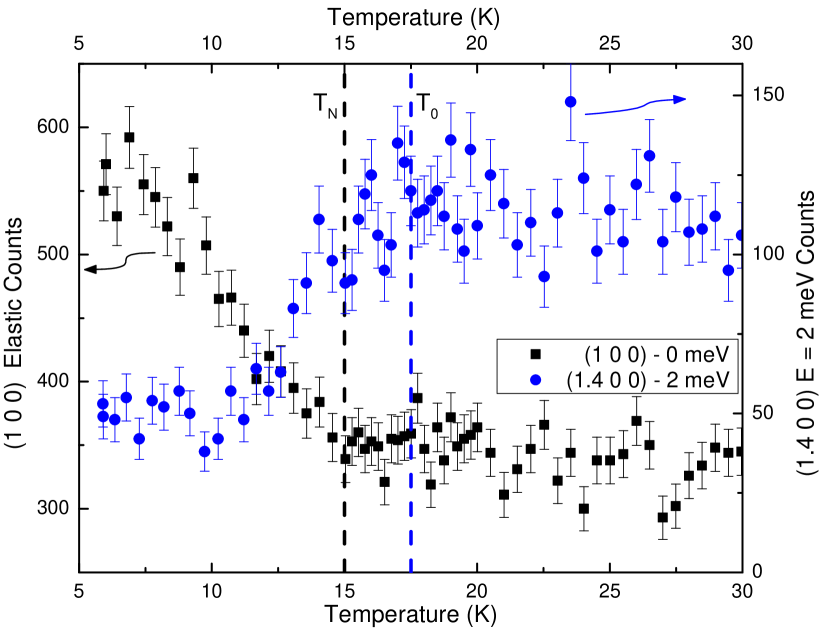
Lastly, to more directly probe the relationship between the hidden order and the antiferromagnetic order, we measured the order parameters for both types of ordering simultaneously in the 1% Fe doped sample, shown in Fig. 6. The black squares denote the peak intensity of the (1 0 0) elastic magnetic Bragg peak, while the blue circles are the scattering intensity at (1.4 0 0) and an energy transfer of 2 meV. This shows the strength of the scattering at a point within the incommensurate gap, a measurement that was shown to determine the opening of the gap at T0 in the parent compound Wiebe_04 . In agreement with the quantitative similarities of the excitations in the 1% sample and the parent compound, as well as the bulk thermodynamic data Kanchanavatee_11 ; Wilson_16 , we see the opening of the incommensurate gap at T0 = 17.5 K. However, in agreement with the SR measurements Wilson_16 , the onset of the antiferromagnetic order occurs at a slightly lower temperature, TN = 15 K. Despite the apparent variation in the transition temperatures, specific heat measurements see no entropy change between the hidden order and antiferromagnetic phases, emphasizing that the Fermi surface reconstruction happens at the upper transition Kanchanavatee_11 . Recent magnetization and thermal expansion measurements also see evidence for the possibility of two transitions, though they suggest that this is also present at higher dopings (5%) Ran_16 . This may be due to variations in doping concentrations or a difference in sensitivity of the measurement techniques.
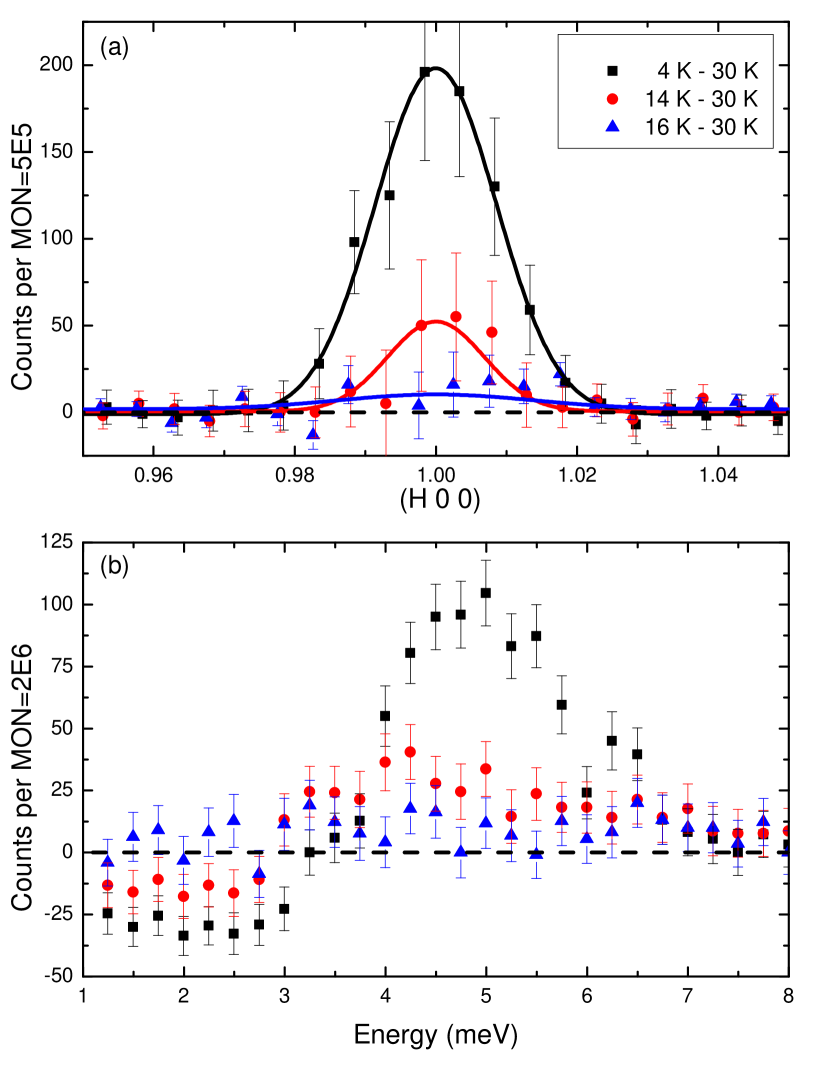
To verify the presence of two transitions, constant measurements were performed at 4 K, 14 K, 16 K, 18 K and 30 K to measure both the (1 0 0) magnetic Bragg peak and the opening of the gap at (1.4 0 0), shown in Fig. 7. It can be seen that the 14 K data shows a gap in the (1.4 0 0) excitation spectrum, and there is appreciable scattering at the (1 0 0) magnetic Bragg peak. At 16 K, the magnetic Bragg peak is absent, within error, while the gap in the (1.4 0 0) constant- measurement had been reduced, it is still present. Both measurements at 18 K are identical within error to the 30 K data. This is consistent with the separation in temperature of the hidden order and magnetic transitions.
V Discussion & Conclusions
We have presented a comprehensive set of elastic and inelastic neutron scattering measurements on a range of Fe-doped samples of U(Ru1-xFex)2Si2 with 0.01 0.15. We have found that the onset of the antiferromagnetic phase occurs at very low doping, with the 2.5% doped sample showing an ordered moment of 0.51 . However, the 1% sample seems to show excitations that are nearly identical to the parent compound, but onsetting at a higher temperature than the antiferromagnetic moment. Combined with previous susceptibility and SR measurements on these samples Wilson_16 , there is strong evidence of different transition temperatures for the antiferromagnetic and hidden orders, in agreement with other techniques on different Fe-doped samples Ran_16 . Resistivity and specific heat measurements do not see any signatures of an abrupt phase transition between the hidden order and antiferromagnetic state Kanchanavatee_11 ; Ran_16 . This is consistent with no observed change in for the incommensurate excitation, which remains at the -point of the hidden order phase, suggesting no change in the BZ between the antiferromagnetic and hidden order phases. Additionally, the SR measurements see evidence for phase separation at low dopings, likely a result of the statistically-random distrubition of Fe dopants Wilson_16 . These dopings are also where the (1 0 0) magnetic Bragg peak does not show a rapid onset, seen in Fig. 1(b), which would be expected in samples with low doping concentrations.
All of the dopings that were measured show evidence for long-ranged magnetic order, with the moment size increasing as a function of doping. This suggests that even far from the parent compound, there is still an evolution away from hidden order. This increase in the magnetic moment is accompanied by a continuous increase in TN, which peaks above the dopings studied at 40% doping, before being suppressed to a paramagnetic state above 70% doping. Synthesis of large single crystals becomes difficult above 15% Fe doping Kanchanavatee_11 , but SR measurements up to 50% Fe doping show that the magnetic moment decreases above 15% Fe substitution Wilson_16 .
The inelastic time-of-flight and triple-axis measurements show that both sets of excitations observed in the parent compound are present at all dopings measured. However, while the excitations are qualitatively unchanged, there are dramatic changes in the quantitative properties above 1% doping, most noticeably in the reduction of the intensity of the commensurate excitation. The increase in the gap and energy-broadening of the excitations at both the commensurate and incommensurate point occurs noticeably in the 2.5% doped sample. Both the magnitude of the gap () and the width () evolve continuously with doping, which is most apparent at the incommensurate point. As observed with measurements of the parent compound under pressure, the increase in the gap at coincides with an increase in T0. This also follows the monotonic increase in the magnetic moment with doping, suggesting that the critical doping is between 1% and 2.5%, but that the magnetic moment and the excitations change continuously at higher dopings.
The pressure results have been somewhat unclear about the existence and properties of the commensurate excitation, with work performed at 0.62 GPa reporting its absence Bourdarot_10 ; Villaume_08 ; Hassinger_10a , while other work seeing a gap of 1 meV at 0.72 GPa Aoki_09 and a gap of 1.8 meV at 1.02 GPa Williams_16 . This has been interpreted as mode softening at the critical pressure, PC = 0.6 GPa, which may explain the changing value of the gaps as seen in the present case of Fe-doping. However, the much larger gap and width in the Fe-doped samples clearly demonstrate that the behavior of the commensurate excitation under Fe doping is not the same as under applied pressure, which may suggest that the effect of Fe doping on the point Fermi surface pocket is not strictly analogous to the changes that occur under hydrostatic pressure. Furthermore, the change in the excitations point to evolutions in the Fermi surface with increasing Fe doping; this serves to increase the gap, suggesting that the Fermi surface pockets at the , and/or points distort slightly to change the optimal energy for the nesting. This must occur without any Fermi surface reconstruction, as there is no entropy change across the HO-AF transition Kanchanavatee_11 , nor do we see any change in the location of the incommensurate excitation (), suggesting that the Fermi surface is not distorted in the antiferromagnetic state. Drawing the analogy to the antiferromagnetic state induced by applied pressure, that transition similarly shows no Fermi surface reconstruction by quantum oscillation measurements Hassinger_10b . We can make further comparison to the pressure-induced AF state by looking at the excitations seen by neutron scattering. Under pressure, the gap at the incommensurate point similarly shows a slight increase, while the intensity of the excitations also increases Williams_16 . The intensity of the excitations does not increase with Fe doping, but this may be a result of impurities distorting the Fermi surface, serving to weaken the nesting that is undistorted in the case of applied pressure. This can also be seen by comparing the width of the excitations, which are unchanged under pressure Williams_16 , but dramatically broadened in the case of Fe doping.
This study serves to illustrate that URu2Si2 is ideally placed on the precipice of magnetic states: antiferromagnetism under pressure or Fe-doping, and even ferromagnetism under Re-doping Butch_11 . In all cases, we see that the excitation spectrum changes quantitatively, but not qualitatively, and is not destroyed by the emergence of the magnetically-ordered state Williams_16 ; Williams_12 . Thus this work demonstrates that in the Fe-doped compounds studied here, as with other perturbations, the hidden order state is not incompatible with magnetic order but rather that the electronic correlations are intimately related to magnetism.
VI Acknowledgments
The authors would like to thank C.R. Wiebe for helpful discussions as well as C. Broholm for his input and collaboration on the parent compound Williams_16 . We also note that inelastic neutron scattering work on these compounds was submitted recently during the preparation of this manuscript Butch_16 and we thank N.P. Butch for sharing that work, whose results are consistent with the present study.
We acknowledge instrument support from S. Chi, M. Matsuda, L.M. Debeer-Schmitt and D. Pajerowski. This research at ORNL’s High Flux Isotope Reactor and Spallation Neutron Source was sponsored by the Scientific User Facilities Division, Office of Basic Energy Sciences, US Department of Energy. Work at McMaster University was supported by the Natural Sciences and Engineering Research Council of Canada and the Canadian Foundation for Innovation. T.J.W. acknowledges support from the Wigner Fellowship program at Oak Ridge National Laboratory. M.N.W. acknowledges support from the Alexander Graham Bell Canada Graduate Scholarship program.
References
- (1) T.T.M. Palstra, A.A. Menovsky, J. van den Berg, A.J. Dirkmaat, P.H. Kes, G.J. Nieuwenhuys and J.A. Mydosh. Phys. Rev. Lett. 55, 2727 (1985).
- (2) C. Broholm, J.K. Kjems, W.J.L. Buyers, P. Matthews, T.T.M. Palstra, A.A. Menovsky and J.A. Mydosh. Phys. Rev. Lett. 58, 1467 (1987).
- (3) C. Broholm, H. Lin, P.T. Matthews, T.E. Mason, W.J.L. Buyers, M.F. Collins, A.A. Menovsky, J.A. Mydosh and J.K. Kjems. Phys. Rev. B 43, 12809 (1991).
- (4) J.A. Mydosh and P.M. Oppeneer. Rev. Mod. Phys. 83, 1301 (2011).
- (5) J.A. Mydosh and P.M. Oppeneer. Phil. Mag. 94, 3642 (2014).
- (6) Y.J. Jo, L. Balicas, C. Capan, K. Behnia, P. Lejay, J. Flouquet, J.A. Mydosh and P. Schlottmann. Phys. B: Condens. Matter. 403, 749 (2008).
- (7) N.P. Butch, J.R. Jeffries, S. Chi, J.B. Leão, J.W. Lynn and M.B. Maple. Phys. Rev. B. 82, 060408(R) (2010).
- (8) H. Amitsuka and T. Sakakibara. J. Phys. Soc. Japan. 63, 736 (1994).
- (9) T. Endstra, G.J. Nieuwenhuys and J.A. Mydosh. Phys. Rev. B. 48, 9595 (1993).
- (10) J.-G. Park and B.R. Coles. J. Phys.: Condens. Matter. 6, 1425 (1994).
- (11) F. Bourdarot, S. Raymond and L.-P. Regnault. Phil Mag. 94, 3702 (2014).
- (12) H. Amitsuka, K. Matsuda, I. Kawasaki, K. Tenya, M. Yokoyama, C. Sekine, N. Tateiwa, T.C. Kobayashi, S. Kawarazaki and H. Yoshizawa. J. Mag. Mag. Mat. 310, 214 (2007).
- (13) N.P. Butch, M.E. Manley, J.R. Jeffries, M. Janoschek, K. Huang, M.B. Maple, A.H. Said, B.M. Leu and J.W. Lynn. Phys. Rev. B. 91, 035128 (2015).
- (14) C.R. Wiebe, J.A. Janik, G.J. MacDougall, G.M. Luke, J.D. Garrett, H.D. Zhou, Y.-J. Lo, L. Balicas, Y. Qiu, J.R.D. Copley, Z. Yamani and W.J.L. Buyers. Nat. Phys. 3, 96 (2007).
- (15) N. Kanchanavatee, M. Janoschek, R.E. Baumbach, J.J. Hamlin, D.A. Zocco, K. Huang and M.B. Maple. Phys. Rev. B. 84, 245122 (2011).
- (16) N. Kanchanavatee, B.D. White, V.W. Burnett and M.B. Maple. Phil. Mag. 94, 3681 (2014).
- (17) L.M. Sandratskii and J. Kübler. Phys. Rev. B. 50, 9258 (1994).
- (18) P. Das, N. Kanchanavatee, J.S. Helton, K. Huang, R.E. Baumbach, E.D. Bauer, B.D. White, V.W. Burnett, M.B. Maple, J.W. Lynn and M. Janoschek. Phys. Rev. B. 91, 085122 (2015).
- (19) T.J. Williams, H. Barath, Z. Yamani, J.A. Rodriguez-Riviera, J.B. Leao, J.D. Garrett, G.M. Luke, W.J.L. Buyers and C. Broholm. arXiv/cond-mat:1607.00967 (2016).
- (20) K.A. Ross, L. Harriger, Z. Yamani, W.J.L. Buyers, J.D. Garrett, A.A. Menovsky, J.A. Mydosh and C.L. Broholm. Phys. Rev. B. 89, 155122 (2014).
- (21) M.N. Wilson, T.J. Williams, Y.-P. Cai, A.M. Hallas, T. Medina, T.J. Munsie, S.C. Cheung, B.A. Frandsen, L. Liu, Y.J. Uemura and G.M. Luke. Phys. Rev. B. 93, 064402 (2016).
- (22) H. Amitsuka, M. Sato, N. Metoki, M. Yokoyama, K. Kuwahara, T. Sakakibara, H. Morimoto, S. Kawarazaki, Y. Miyako, and J.A. Mydosh. Phys. Rev. Lett. 83, 5114 (1999).
- (23) F. Bourdarot, E. Hassinger, S. Raymond, D. Aoki, V. Taufour, L.-P. Regnault and J. Flouquet. J. Phys. Soc. Japan. 79, 064719 (2010).
- (24) A. Zheludev: ResLib 3.4 (Oak Ridge National Laboratory, (2007).
- (25) E. Hassinger, G. Knebel, T.D. Matsuda, D. Aoki, V. Taufour and J. Flouquet. Phys. Rev. Lett. 105, 216409 (2010).
- (26) A. Villaume, F. Bourdarot, E. Hassinger, S. Raymond, V. Taufour, D. Aoki and J. Flouquet. Phys. Rev. B. 78, 012504 (2008).
- (27) C.R. Wiebe, G.M. Luke, Z. Yamani, A.A. Menovsky and W.J.L. Buyers. Phys. Rev. B. 69, 132418 (2004).
- (28) S. Ran, C.T. Wolowiec, I. Jeon, N. Pouse, N. Kanchanavatee, K. Huang, D. Martien, T. DaPron, D. Snow, M. Williamsen, S. Spagna and M.B. Maple. arXiv/cond-mat:1604.00983 (2016).
- (29) E. Hassinger, D. Aoki, F. Bourdarot, G. Knebel, V. Taufour, S. Raymond, A. Villaume, J. Flouquet. J. Phys. Conf. Ser. 251, 012001 (2010).
- (30) D. Aoki, F. Bourdarot, E. Hassinger, G. Knebel, A. Miyake, S. Raymond, V. Taufour and J. Flouquet. J. Phys. Soc. Japan. 78, 053701 (2009).
- (31) N.P. Butch and M.B. Maple. J. Phys.: Condens. Matter. 22, 164204 (2011).
- (32) T.J. Williams, Z. Yamani, N.P. Butch, G.M. Luke, M.B. Maple and W.J.L. Buyers. Phys. Rev. B. 86, 235104 (2012).
- (33) N.P. Butch, S. Ran, I. Jeon, N. Kanchanavatee, K. Huang, A. Breindel, M.B. Maple, R.L. Stillwell, Y. Zhao, L. Harringer and J.W. Lynn. arXiv/cond-mat:1607.02136 (2016).