acmlicensed \isbn978-1-4503-4443-2/16/07\acmPrice$15.00 http://dx.doi.org/10.1145/2959424.2959438
Diurnal and Weekly Cycles in IPv6 Traffic
Abstract
IPv6 activity is commonly reported as a fraction of network traffic per day. Within this traffic, however, are daily and weekly characteristics, driven by non-uniform IPv6 deployment across ISPs and regions. This paper discusses some of the more apparent patterns we observe today.
keywords:
Network protocols; Network measurement<ccs2012> <concept> <concept_id>10003033.10003039.10003045</concept_id> <concept_desc>Networks Network layer protocols</concept_desc> <concept_significance>500</concept_significance> </concept> <concept> <concept_id>10003033.10003079.10011704</concept_id> <concept_desc>Networks Network measurement</concept_desc> <concept_significance>500</concept_significance> </concept> </ccs2012>
[500]Networks Network layer protocols \ccsdesc[500]Networks Network measurement
1 Introduction
Global trends indicate that IPv6 accounts for approximately 10 – 15% of Internet traffic today, as shown in Fig. 1 and corroborated by [1] and [2].
2 Global Traffic
This analysis uses HTTP access logs collected on Yahoo’s content delivery network between April 26th 2016 and May 16th 2016 inclusive, excepting May 5th, missing from this dataset. All timestamps are UTC.
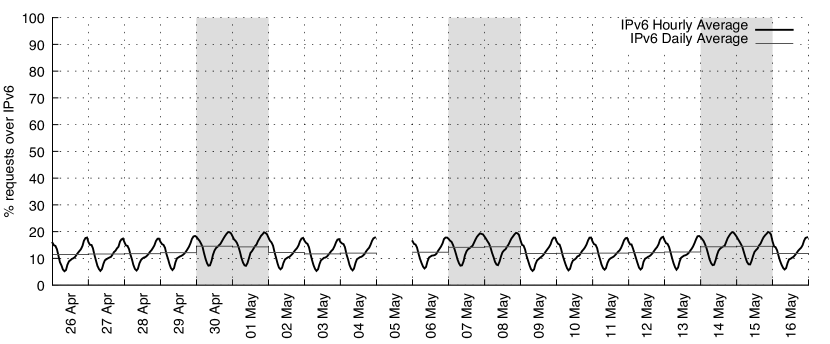
Fig. 1 shows hourly and daily global averages for the proportion of requests served over IPv6. The daily cadence is clear, with notable differences between weekdays and weekends: on weekdays, the IPv6 request ratio ranges from an average of 5.2% between 06:00 – 07:00UTC, to 16.6% by 22:00 – 23:00UTC. On weekends, the pattern is similar but with a higher minima of 7.4% and maxima of 19.7%.
The distinction between weekdays vs. weekends is echoed in the daily averages, with an average of 11.9% requests over IPv6 on weekdays, and 14.4% on weekends. This variation is observed in other published measurements [1]. In this paper, we consider contributing factors to those variations.
2.1 Working-week Patterns
(a) Fixed-line providers. (b) Mobile providers.
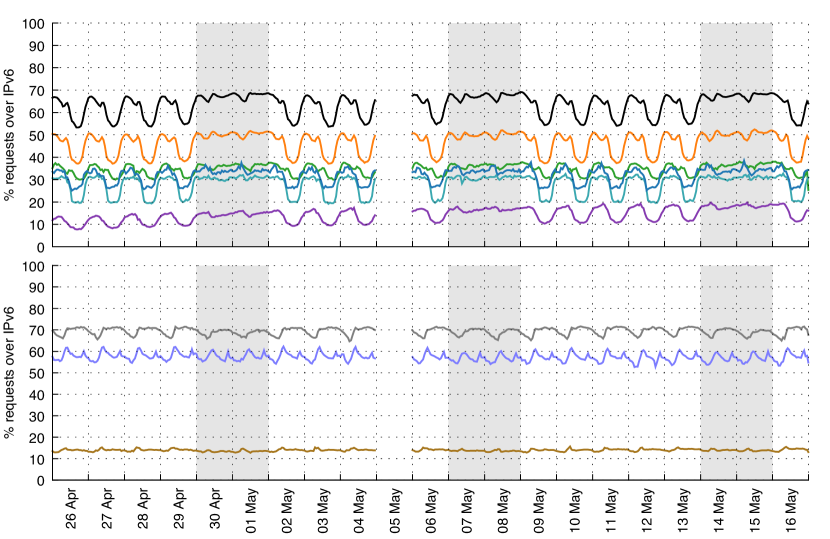
Some ISPs have distinct access patterns that affect the IPv6 request ratio through an ordinary week. Fig. 2 shows the daily share of requests from selected ASNs registered in the US; these ASNs generate most of our US-based IPv6 traffic. ASNs for fixed-line service providers are shown separately in Fig. 2a from mobile providers in Fig. 2b.
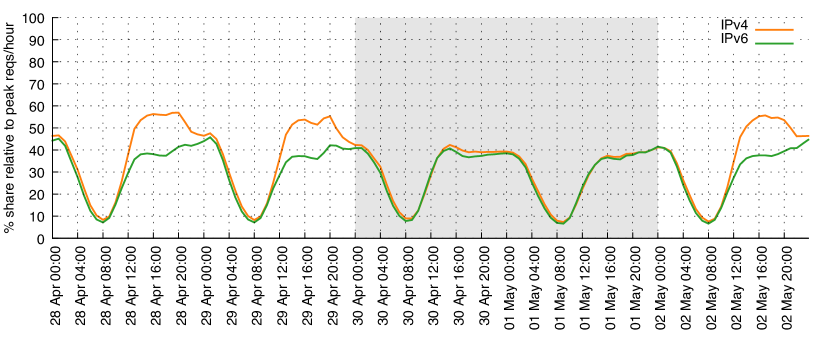
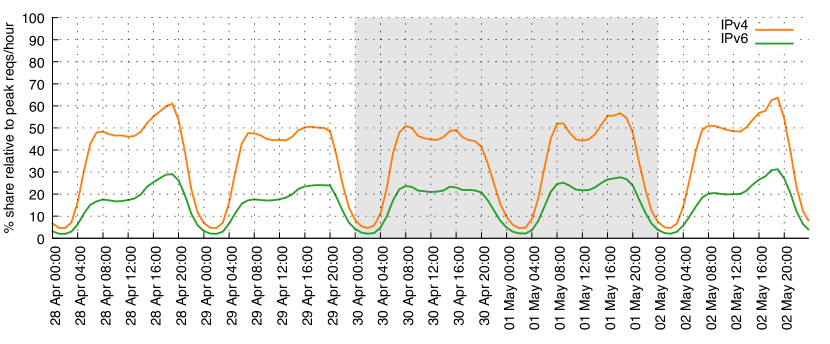
We observe two behaviours: the fixed-line providers generate a distinct pattern during the working week different from their weekend behaviour, while mobile providers are consistent throughout the week. Regarding the fixed-line subscribers, to help determine whether the shift in request ratios occurs due to a decrease in requests over IPv6, an increase in requests over IPv4, or a combination of both, request counts from the same set of ASNs are aggregated in Fig. 3. Noting that this plot shows absolute request counts as a fraction of the peak observed in the aggregate dataset, we see requests dip on both protocols at night, and peak during office hours, as expected. Notably, the number of requests served over IPv6 is reasonably constant throughout, while there is a distinct increase in requests over IPv4 during office hours. This implies that the lower IPv6 ratio is not an obvious shift of requests from IPv6 to IPv4 but instead that additional traffic from office sites is more likely to be IPv4-only, directly affecting the request ratios and thus the global average reported on weekdays.
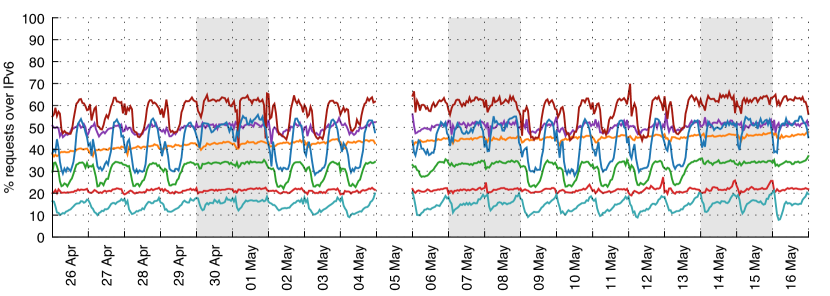
Fig. 4 shows the daily share of requests from selected ASNs registered in European countries; these ASNs generate most of our EU-based IPv6 traffic. These are primarily fixed-line ISPs. While a workday pattern is clear in some ASNs, there are various fixed-line providers that do not exhibit the same daily pattern as the others; this may be due to the diverse nature of DSL providers in the European market. Fig. 5 shows the aggregate behaviour of these ASNs; largely, it appears that the absolute number of requests follows the same pattern between IPv4 and IPv6.
2.2 Regional Traffic Patterns
Regional variation in IPv6 deployment is clearly a contributing factor to the daily variation in the share of requests over IPv6. In order to determine where IPv6 deployments are most active, we can geo-locate requests and associate them with their likely time zone.

Fig. 6a shows the daily proportion of requests served over IPv6 from each time zone observed. The notable clusters indicate the North American countries, Brazil, various European countries (including Portugal, the UK, France, Germany, Belgium, the Netherlands, the Czech Republic, Norway, Lithuania, Estonia, Finland, Greece, and Romania), and some countries in the Asia/Pacific region, such as Malaysia, Japan, and Australia. Fig. 6b takes some of the active time zone clusters, and shows their hourly averages separately.
The dominant regions are clearly North America and Europe. Requests geo-located to North America are consistently served more frequently over IPv6; commonly around 26% of requests in the region between 00:00 to 06:00UTC on weekdays, i.e., peak evening hours, and a similar share through weekends following the pattern observed in Fig. 2a. The IPv6 request share here consistently falls to around 17% between 12:00 and 20:00UTC.
In Europe, 9% of requests tend to be made over IPv6 between 18:00 and 02:00UTC on weekdays and most hours at weekends. The share of requests falls below 6.5% between 06:00 and 14:00UTC. As already noted in the European context, the correlation between increased IPv4 activity and core office hours in some ASNs is not as strong as it is in the US.
3 Conclusions
The daily cadence shown in Fig. 1 is largely driven by traffic from the US. The proportion of IPv6 requests is most pronounced in the US market, and we see strong overlap between the quietest period in the US (08:00UTC) and the lowest share of IPv6 in the global averages. Also notable is the daily variation in IPv6 requests observed in many, but not all, fixed-line networks. This is a key contributor to the 2.5% difference in global IPv6 on weekdays vs. weekends.
This paper presents a high-level overview of where and when IPv6 is active today. The protocol is clearly dominant in some networks, and carries significant traffic in the US and the EU; aggregate access patterns will continue to evolve as regions and networks adopt the protocol.
References
- [1] Google IPv6 Adoption Statistics. https://www.google.com/intl/en/ipv6/statistics.html.
- [2] Internet Society, World IPv6 Launch Measurements. http://www.worldipv6launch.org/measurements/.
- [3] J. Czyz, M. Allman, J. Zhang, S. Iekel-Johnson, E. Osterweil, and M. Bailey. Measuring IPv6 Adoption. In SIGCOMM ’14: Proceedings of the 2014 ACM Conference on SIGCOMM. ACM, 2014.
- [4] I. Livadariu, A. Elmokashfi, and A. Dhamdhere. Characterizing IPv6 control and data plane stability. In IEEE INFOCOM 2016 – The 35th Annual IEEE \balancecolumnsInternational Conference on Computer Communications. IEEE, 2016.
- [5] D. Plonka and A. Berger. Temporal and Spatial Classification of Active IPv6 Addresses. In IMC ’15: Proceedings of the 2015 ACM Conference on Internet Measurement Conference. ACM, 2015.
- [6] D. Thaler, R. Draves, A. Matsumoto, and T. Chown. Default Address Selection for Internet Protocol Version 6 (IPv6). RFC 6724, Sept. 2012.
- [7] D. Wing and A. Yourtchenko. Happy Eyeballs: Success with Dual-Stack Hosts. RFC 6555, Apr. 2012.