Optical and ultraviolet spectroscopic analysis of SN 2011fe at late times
Abstract
We present optical spectra of the nearby Type Ia supernova SN 2011fe at 100, 205, 311, 349, and 578 days post-maximum light, as well as an ultraviolet spectrum obtained with Hubble Space Telescope at 360 days post-maximum light. We compare these observations with synthetic spectra produced with the radiative transfer code PHOENIX. The day +100 spectrum can be well fit with models which neglect collisional and radiative data for forbidden lines. Curiously, including this data and recomputing the fit yields a quite similar spectrum, but with different combinations of lines forming some of the stronger features. At day +205 and later epochs, forbidden lines dominate much of the optical spectrum formation; however, our results indicate that recombination, not collisional excitation, is the most influential physical process driving spectrum formation at these late times. Consequently, our synthetic optical and UV spectra at all epochs presented here are formed almost exclusively through recombination-driven fluorescence. Furthermore, our models suggest that the ultraviolet spectrum even as late as day +360 is optically thick and consists of permitted lines from several iron-peak species. These results indicate that the transition to the “nebular” phase in Type Ia supernovae is complex and highly wavelength-dependent.
1 Introduction
The Type Ia supernova (SN Ia) SN 2011fe was discovered on 2011 August 24, just 11 hr after explosion (Nugent et al., 2011). It is among the nearest ( Mpc) and youngest ( hr) SNe Ia ever discovered. Extensive spectroscopic and photometric studies of SN 2011fe indicate that it is “normal” in nearly every sense: in luminosity, spectral and color evolution, abundance patterns, etc. (Parrent et al., 2012; Richmond & Smith, 2012; Röpke et al., 2012; Vinkó et al., 2012; Munari et al., 2013; Pereira et al., 2013). Its unremarkable nature coupled with the wealth of observations made over its lifetime render it an ideal laboratory for understanding the physical processes which govern the evolution of normal SNe Ia. Indeed, these data have allowed observers to place numerous and unprecedented constraints on the progenitor system of a particular SN Ia (e.g., Li et al., 2011; Nugent et al., 2011; Bloom et al., 2012; Chomiuk et al., 2012; Horesh et al., 2012; Margutti et al., 2012).
Equally as information-rich as observations taken at early times are those taken much later, when the supernova’s photosphere has receded and spectrum formation occurs deep in the SN core. For example, Shappee et al. (2013) used late-time spectra to further constrain the progenitor system of SN 2011fe, namely that the amount of hydrogen stripped from the putative companion must be . McClelland et al. (2013) found that the luminosity from SN 2011fe in the 3.6 m channel of Spitzer/IRAC fades almost twice as quickly as in the 4.5 m channel, which they argue is a consequence of recombination from doubly ionized to singly ionized iron peak elements. In addition, Kerzendorf et al. (2014) used photometric observations near 930 d post-maximum light to construct a late-time quasi-bolometric light curve, and showed that the luminosity continues to trace the radioactive decay rate of 56Co quite closely, suggesting that positrons are fully trapped in the ejecta, disfavoring a radially combed or absent magnetic field in this SN. Graham et al. (2015) presented an optical spectrum at 981 d post-explosion and used constraints on both the mass of hydrogen as well as the luminosity of the putative secondary star as evidence against a single-degenerate explosion mechanism. Taubenberger et al. (2015) presented an optical spectrum at 1034 d post-explosion, and speculated about the presence of [O 1] lines near 6300 Å, which, if confirmed, would provide strong constraints on the mass of unburned material near the center of the white dwarf progenitor of SN 2011fe. Non-detections of the H line at both of these very late epochs also strengthened the constraints on the presence of hydrogen initially posed by Shappee et al. (2013). Finally, Mazzali et al. (2015) used spectrum synthesis models of SN 2011fe from 192 to 364 days post-explosion to argue for a large central mass of stable iron and a small mass of stable nickel – about 0.23 and 0.01 , respectively.
We complement these various late-time analyses with a series of radiative transfer models corresponding to a series of optical and ultraviolet (UV) spectra of SN 2011fe.
2 Observations
| UT Date | Phase | Telescope |
|---|---|---|
| (days) | Instrument | |
| 2011 Dec 19 | 100 | WHTISIS |
| 2012 Apr 2 | 205 | Lick 3-mKAST |
| 2012 Jul 17 | 311 | Lick 3-mKAST |
| 2012 Aug 23 | 349 | Lick 3-mKAST |
| 2013 Apr 8 | 578 | Lick 3-mKAST |
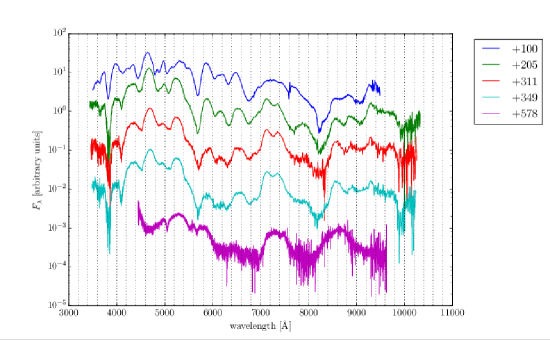
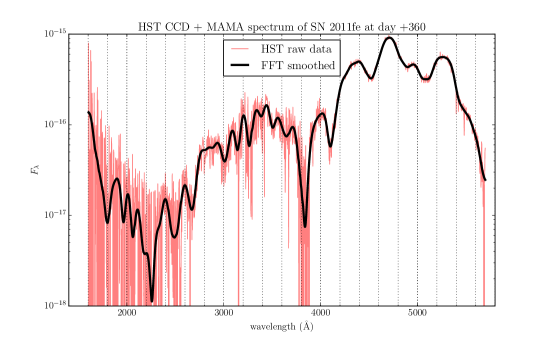
We obtained optical spectra of SN 2011fe at days +100, +205, +311, +349, and +594 (Dec 19, 2011, Apr 2, 2012, Jul 17, 2012, Aug 23, 2012, Mar 27, 2013); the observations are shown in Figure 1 and described in Table 1. The day +205 and +311 spectra were presented in Mazzali et al. (2015). We also obtained an ultraviolet spectrum with Hubble Space Telescope at day +360 (GO 12948; PI: R. Thomas). This latter observation consisted of ten orbits, the first nine using the STIS/NUV-MAMA configuration, and the last with the STIS/CCD G430L and G750L configurations. The data from one of the NUV-MAMA orbits was unrecoverable, and so the final spectrum, shown in Figure 2, represents co-addition of the nine remaining observations.
Also shown in Figure 2 is a smoothed version of the HST spectrum. We used the algorithm presented in Marion et al. (2009), which consists of applying a low-pass filter to the signal. The motivation for this approach is the notion that the physical features in SN Ia spectra are broad, while most noise in the spectrum is narrow. Therefore, if one can suppress the high-“frequency” features (the noise), what will remain will be the pure signal from the SN. To accomplish this task, one calculates the power spectrum of the original spectrum using a Fourier transformation, suppresses the power spectrum at all high “frequencies” in which information is deemed to be noise, and applies an inverse Fourier transformation to recover the smoothed spectrum. An especially useful feature of this technique is its insensitivity to spikes in HST spectra due to cosmic rays.
3 Radiative transfer models
We used the PHOENIX/1D code (Hauschildt & Baron, 1999) with the same modifications discussed in Friesen et al. (2014) to capture the most important physical processes at late times in SNe Ia. The underlying explosion model was a spherically symmetric delayed-detonation model presented in Domínguez, Höflich & Straniero (2001). For each observation presented in §2 we calculated a corresponding synthetic spectrum, assuming a 16 day rise time for the model (Nugent et al., 2011).
4 Discussion
The theory of spectrum formation at late times in normal SNe Ia has broadly converged to a scenario in which electron configurations of atoms in the rarefied ejecta are primarily in their ground state, and are excited by collisions with free electrons to low-lying metastable levels, which in turn emit forbidden lines as they return to the ground state (e.g., Meyerott, 1978, 1980; Axelrod, 1980; Ruiz-Lapuente & Lucy, 1992; Kuchner et al., 1994; Ruiz-Lapuente et al., 1995; Bowers et al., 1997; Mazzali et al., 2011; Mazzali & Hachinger, 2012; Silverman, Ganeshalingam & Filippenko, 2013). Little to no continuum emission is present in SN Ia spectra at these epochs. This stands in contrast to the spectrum formation mechanism at early times, near maximum light, in which the optical depth to Thomson scattering on free electrons is large, leading to the formation of a photosphere on top of which atoms undergo line scattering via strong permitted lines, giving rise to P Cygni spectral features. Kirshner & Oke (1975) argued that the P Cygni mechanism is no longer active at late times because the photosphere has disappeared (indicated by the absence of continuum) and there are no longer enough photons for these strong lines to scatter.
Curiously, good spectral fits have been obtained for relatively late SN Ia spectra with the parameterized spectrum synthesis code SYNOW, which treats only line scattering by permitted lines. Such fits require only a few ions – Na 1, Ca 2, and Fe 2 – and fit optical spectra fairly well, especially blueward of Å. Examples include the normal SN 1994D at day +115 (Branch et al., 2005), the normal SN 2003du at day +84 (Branch et al., 2008), the subluminous SN 1991bg at day +91 (Branch et al., 2008), and the peculiar SN 2002cx at day +227 (Jha et al., 2006). While the parameterized approach of SYNOW to solving the radiative transfer equation restricts analysis of those fits to putative line identifications and velocity measurements, they nevertheless demonstrate that either SN Ia spectra exhibit a remarkable degeneracy with respect to forbidden and permitted line formation, or that permitted lines continue to drive emergent spectrum formation at late times, regardless of what physical mechanisms generate the underlying flux (Branch et al., 2008; Friesen et al., 2012).
These two competing analyses of late-time SN Ia spectra agree that the majority of the spectrum is formed by Fe lines, but they predict dramatically different velocities of the line-forming regions in the ejecta. For example, Branch et al. (2008) argue that Fe, Ca, and Na are located at 7000 km s-1 and higher in the day +84 spectrum of SN 2003du. In contrast, Bowers et al. (1997) argue for velocities from 1000 – 3000 km s-1 in the +95 spectrum of the same object. Identifying the correct velocity of the line-forming region has important consequences for constraining the structure of the inner regions of SN Ia ejecta, which in turn constrain the as-yet unknown explosion mechanism.
4.1 Day +100
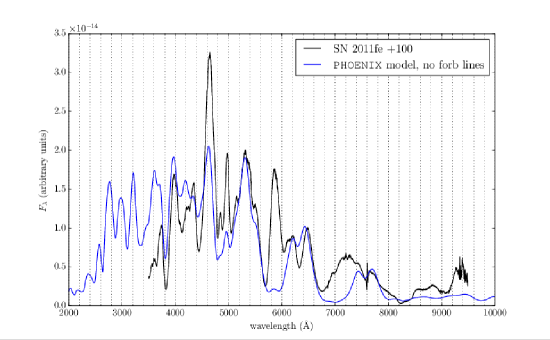
The day +100 spectrum of SN 2011fe and the corresponding synthetic spectrum from PHOENIX are shown in Figure 3. Overall the fit is good, although a few features in our model do not match those in the observed spectrum, namely the emission feature near 5900 Å. In addition, the peak at 4700 Å in the synthetic spectrum is too weak, the blue side of the broad emission at 7200 Å is absent in the model, and the flux in the blue and near-UV is too high. Most other features are well reproduced, both in strength and in shape.
In the context of much of the literature which concerns late-time SN Ia spectra, the fidelity of this fit is peculiar because the calculation used the most current atomic database of Kurucz (1995, 2002), which includes no forbidden line data for any ions. This stands in contrast to the most common interpretations of spectra of “old” SN Ia, which were discussed earlier. If the purely permitted line identifications are correct they are difficult to reconcile with kinematic analyses such as that of Maeda et al. (2010), which assume that the emission peaks correspond to forbidden lines forming within a few 100 km s-1 of km s-1. Rather, the strong emission peaks at Å and Å, which each have previously been identified as a mixture of [Fe 2] and [Fe 3] lines, may instead be formed by the handful of permitted lines of Fe 2 whose upper levels are among the crowded configuration, with energies between 5 eV and 6 eV, and whose lower levels are, coincidentally, the handful of metastable levels around 3 eV which are purportedly responsible for the aforementioned forbidden emission features. However, it is important to note that the analysis of Maeda et al. (2010) only requires that the ejecta is optically thin at the rest wavelength of the line and as we show below in the redder parts of the spectra that condition is met at later epochs. In the line-scattering interpretation of spectrum formation, this would imply that the dips just to the blue of these two strong emission features are the corresponding absorptions, rather than regions lacking in emission. These absorptions would correspond to line velocities of km s-1, similar to that found in the +115 spectrum of SN 1994D by (Branch et al., 2005).
Although below we illustrate some complications with this permitted-line-only model, it is instructive first to entertain the idea that this is, in fact, representative of late-time spectrum formation physics in SNe Ia. Given the contrast of this result with those found elsewhere in the literature, it is important to evaluate the late-time line scattering scenario within the context of other analyses of SN 2011fe, in order to determine whether or not it is copacetic with what is already known about the spectral evolution of this object. We consider three such pieces of analysis. First, Parrent et al. (2012) traced the velocity evolution of Fe 2 in the early spectra of SN 2011fe using the automated spectrum code SYNAPPS (Thomas, Nugent & Meza, 2011) and found that at day +15 the minimum velocity of that ion was km s-1 (see their Figure 3). Furthermore, after maximum light, the rate of change of line velocities in SN 2011fe, and in most SNe Ia in general, slows dramatically. Second, in the hydrodynamical model used in our calculation, Fe remains the most abundant species in the ejecta from the center of the ejecta out to km s-1 (see Friesen et al., 2014, Figure 2); our putative line velocity estimate of km s-1 falls well within this range. Finally, Iwamoto et al. (1999) show that the optical depth of Fe 2 computed in local thermodynamic equilibrium (LTE) peaks between 5000 K and K, roughly the same temperature range as that of the ejecta in our models. (One would be remiss to read too much into this corroboration, as the radiation field in the SN Ia ejecta at this epoch is far from LTE.) Although none of these results offer conclusive evidence that the strong features in the +100 spectrum of SN 2011fe are indeed P Cygni profiles, they do show that it is quite reasonable to consider that possibility.
We caution that it is unlikely that the entire optical spectrum consists of overlapping P Cygni line profiles due to resonance-scattering, as is the case at very early (photospheric) epochs in SNe Ia. Branch et al. (2008) attempted to fit the day +84 spectrum of SN 2003du with the resonance-scattering code SYNOW, and found that P Cygni lines fit the blue part of the spectrum (blueward of 6600 Å) quite well, but failed quite severely redward of that. As they discuss, the likely explanation is that resonance-scattering near this epoch is very influential at blue wavelengths, but forbidden emission is prominent in the red. (We find a similar result in our attempts to fit the optical and UV spectra at +349 and +360, respectively, which we discuss below.) In fact, to argue that spectrum formation consists of either resonance-scattering by optically thick permitted lines or emission from optically thin forbidden lines is somewhat of a false dilemma, as both scenarios assume a degree of locality in the radiative transfer which is probably unphysical. In particular, the former assumes that the source function depends only on the local mean intensity , while the latter assumes that emitting lines are well separated in wavelength such that they act independently of each other. Each of these approximations is valid in certain regimes, i.e., resonance-scattering at photospheric epochs and forbidden emission at very late times ( yr) and in wavelength regions far from the forest of iron-peak lines, such as the infrared, but there exists a wide range between those extremes, in which all of these effects compete to form the emergent spectrum.
Bongard et al. (2008) addressed this topic in detail by calculating a grid of PHOENIX spectra using the hydrodynamical model W7 (Nomoto, Thielemann & Yokoi, 1984) at 20 days post-explosion. They found that even at very low velocities and high optical depth (), the “spectrum”111The radiation flux . at those velocities is already highly distorted from that of a blackbody, due to line and continuum interactions of the radiation field with iron-peak elements deep in the core of the SN. The ions found at higher velocities, near the photosphere, then further distort this underlying spectrum through additional absorption, emission, and line scattering, leading to an emergent spectrum containing a complicated mixture of P Cygni, continuum, and thermal components which are difficult to disentangle.
That our spectral model which explicitly omits forbidden line data fits the day +100 spectrum of SN 2011fe reasonably well, suggests that day +100 is simply too early for collisionally excited forbidden emission to be the primary driver of spectrum formation. It appears that line scattering processes continue to contribute significantly, even this late in the lifetime of this SN. In short, there are many physically-motivated reasons to suspect that permitted lines play an important role in SN Ia spectrum formation at this epoch.
However, since forbidden lines are frequently identified in spectra of SNe Ia of this age, we tested this theory by expanding our atomic database to include collisional and radiative data of forbidden lines, as described in Friesen et al. (2014). We then repeated the radiative transfer calculation with this expanded database, and compare the two results in Figure 4. The results are quite similar, except that the model with forbidden lines has a lower UV flux and stronger emission at 7300 Å and 8600 Å.
The most notable shortcoming of both synthetic spectra is the lack of emission at 5900 Å. This feature has been identified alternatively as Na 1 D (Branch et al., 2008; Mazzali et al., 2008) or [Co 3] Å (Dessart et al., 2014). The explosion model used in these calculations contains little Na 1, so it is not surprising that we do not recover a strong Na I D emission feature there. However, at day 116 the model contains several 0.1 of 56Co, and yet the forbidden emission at 5900 Å does not appear. This discrepancy may be related to underestimating the gas temperature in the model at this epoch (see §4.2).
Identifying whether a feature is an “emission” or “absorption” is not a straightforward task in PHOENIX calculations. This is because the algorithm calculates emissivities and opacities of NLTE species by adding up all contributions to each at each wavelength point (e.g., Hauschildt & Baron, 2014), with no regard to the underlying atomic processes which produced them. Such an approach captures naturally the notion that spectrum formation is inherently multi-layered in supernovae: one region deep in the ejecta may be strongly in emission at one wavelength, but a region above it may be optically thick at that wavelength, absorbing much of the underlying emission (Bongard et al., 2008). The emergent spectrum is then a convolution of both processes, and such classifications as “absorption” or “emission,” while relevant to single interactions, no longer describe adequately the complete process of spectrum formation.
We are therefore relegated to using more indirect methods for isolating the sources of features in synthetic spectra. The single-ion spectrum method (Bongard et al., 2008) can help one identify the particular ion or ions which influence particular parts of a synthetic spectrum, but it cannot, e.g., isolate the effects of permitted lines from forbidden lines, which is desirable in this context. We found that the only useful way to accomplish this was to remove the forbidden lines from the calculation entirely and re-compute the entire model. This can unfortunately broaden the parameter space of the model, since forbidden lines affect the temperature structure by acting as coolants (Friesen et al., 2014; Dessart et al., 2014). Unfortunately we are aware of no more targeted method of accomplishing this goal.
We computed single-ion spectra for both synthetic spectra (with and without forbidden lines), for the most influential ions. For the spectrum without forbidden lines, these are shown in Figure 5. For the spectrum with forbidden lines, these are shown in Figure 6.
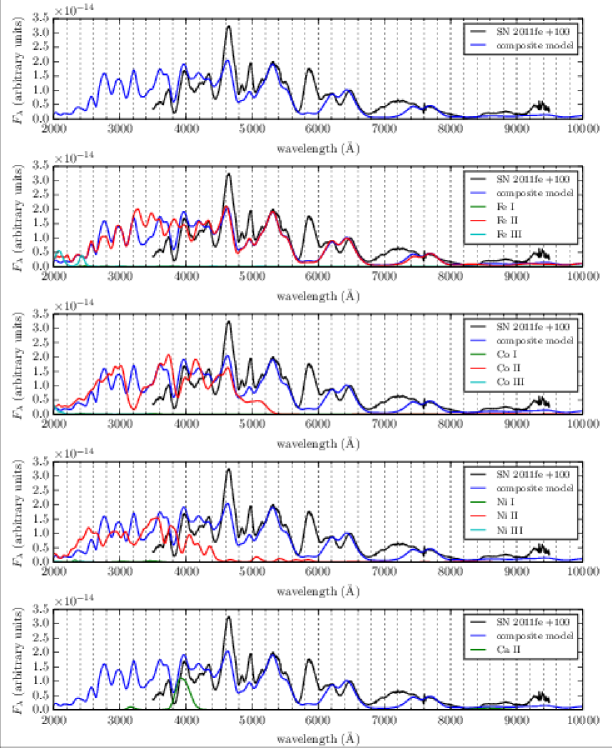
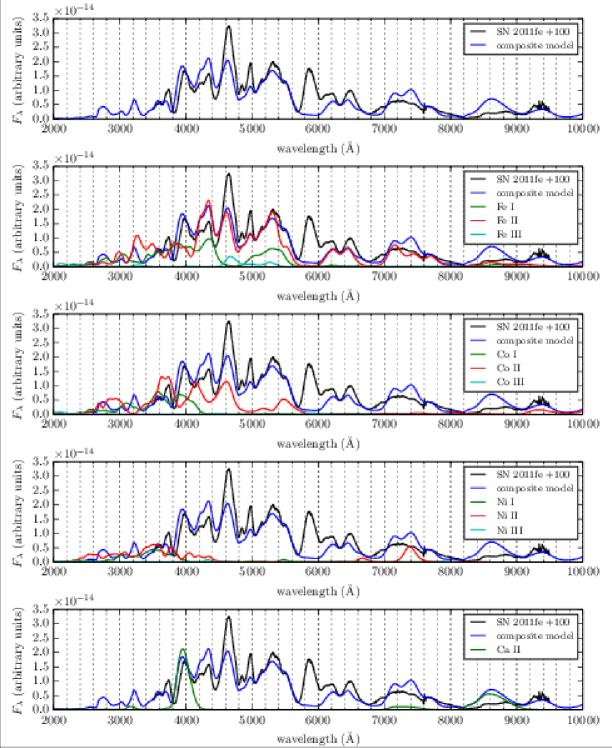
Both with and without forbidden lines, the synthetic spectra indicate that most of the optical spectrum at day +100 is formed by Fe 2. In addition, the Ca 2 H & K doublet at Å, a pair of strong resonance lines, contributes significantly to the emission at 4000 Å. However, comparison between the two sets of single-ion spectra indicate a fascinating result which Branch et al. (2008) found highly improbable: it appears that entirely different combinations of atomic lines can conspire to produce similar optical spectra. Furthermore, the synthetic spectra in Figure 3 and Figure 4 are the natural endpoints of calculations subject to otherwise identical parameters. For example, when forbidden lines are included, the emission at 4000 Å is due entirely to the Ca 2 H & K doublet; when they are absent, it is a combination of that same doublet with contributions also from Fe 2 and Co 2. The double-horned emissions at 7250 Å and 7500 Å in the synthetic spectra lacking forbidden lines are due to emission from Fe 2; but the double-horned features at 7150 Å and 7400 Å in the spectra containing forbidden lines are due to Fe 2 (possibly [Fe 2] Å)and [Ni 2] Å. This is likely stable 58Ni, since the radioactive 56Ni has mostly decayed by this point. The degeneracy among these various features is the likely explanation for the conflicting results of, e.g., Bowers et al. (1997) and Branch et al. (2008).
One would expect that adding forbidden lines is always favorable over neglecting them: if a calculation captures all relevant atomic processes and if forbidden lines are truly unimportant in some scenario, they will naturally “deactivate”. And in fact, adding in the forbidden atomic data did address some problems in the synthetic spectra which lacked them. The lower UV flux and the 8600 Å emission in the synthetic spectrum forbidden lines can be explained by their cooling effects: lower temperatures generally lead to lower opacities in the UV, and a lower temperature allows more Ca 3 to recombine to Ca 2. However, the cooling effects also introduced a new problem: the infrared triplet (IR3) of Ca 2 Å (a trio of strong permitted lines) is responsible for the emission at 8600 Å, but the model overestimates the strength of the emission at this wavelength. In the observation there is a pair of weaker emission features at the same location, and it is possible that at least one of these two emissions is due to the Ca 2 IR3, although probably not both, since they are spread too far apart in wavelength. It is therefore not entirely clear which of the two synthetic spectra are “better,” and it is possible therefore that both permitted and forbidden lines affect the optical spectra of SNe Ia at this epoch.
4.2 Day +205
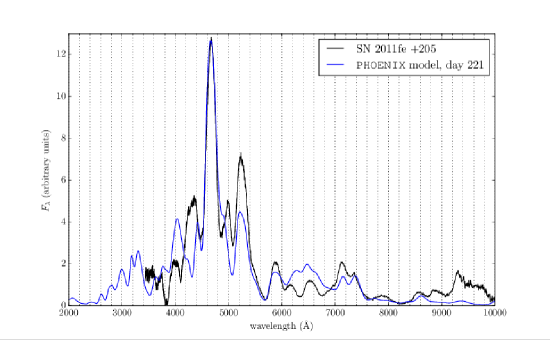
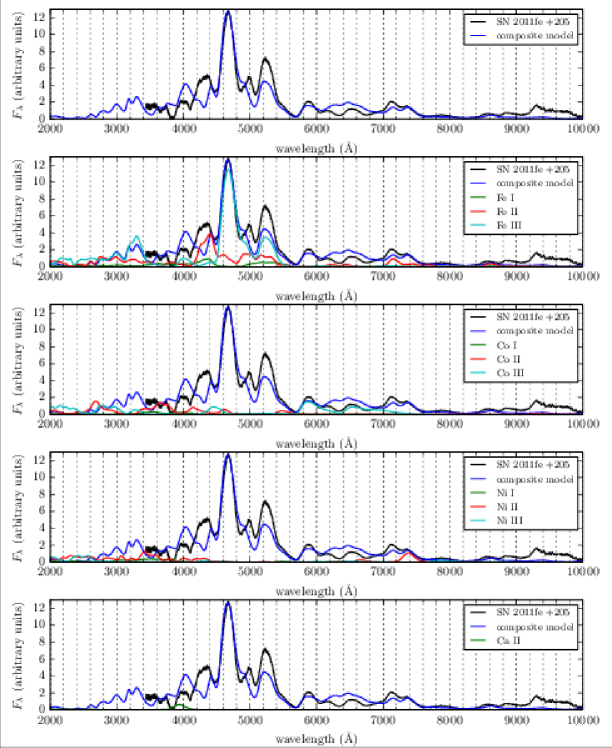
The day +205 spectrum of SN 2011fe and the corresponding PHOENIX spectrum are shown in Figure 7. Attempts to calculate a spectrum at this epoch without forbidden lines, as was done in §4.1, led to unrecoverable numerical instabilities in the code. It seems, then, that by this age forbidden lines play an important role. The single-ion spectra are shown in Figure 8. The emission feature at 4700 Å is primarily [Fe 3] Å and [Fe 2] Å. The weak but clearly separate features around 4300 Å are [Fe 2] Å, and the emission at 5300 Å is [Fe 2] Å. The double-horned feature in the synthetic spectrum centered around 7300 Å consists of [Fe 2] Å on the left, and [Ni 2] Å on the right; the shape of this pair of features is too exaggerated in the synthetic spectrum compared to the day +100 spectrum of SN 2011fe, but at later epochs the shape is a good match to the observations.
At this epoch the ratio of Fe 2 to Fe 3 is well reproduced, with the strength of the 4700 Å emission from Fe 3 improved over that from the day +100 spectrum. However, the 5200 Å emission, also from Fe 3, is somewhat weak. The strong Ca 2 IR3 emission which was overestimated in strength in they day +100 synthetic spectrum is now absent entirely. Coincidentally, the forbidden line [Fe 2] Å, at nearly the same wavelength as IR3, has grown in strength at day +205, and fits quite well to the observation. The Ca 2 H & K doublet, which was quite strong at day +100, has diminished in strength and is replaced mostly by [Fe 3] Å. It seems, then, that the serendipitous degeneracy among permitted and forbidden lines which Branch et al. (2005) found unlikely, may actually be realized, at least for some features in the optical spectra of SN 2011fe.
The double-horned pair of emissions centered at 7200 Å is better reproduced at this epoch as well. Curiously, the emission at 5900 Å is now quite well fit with [Co 3] Å, while at day +100, when most of the 56Ni had decayed to 56Co, the feature was absent entirely. It is possible that the temperature in the day +100 model was too low, which would explain the underabundance of Fe 3 emitting at 4700 Å and Co 3 emitting at 5900 Å. A higher temperature would also reduce the abundance of Ca 2 in favor of Ca 3, explaining the reduced strength of both the H & K doublet and the IR3.
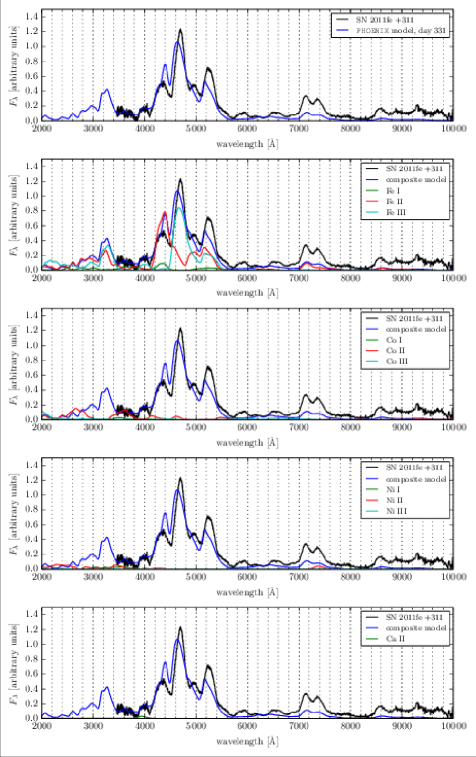
4.3 Day +311
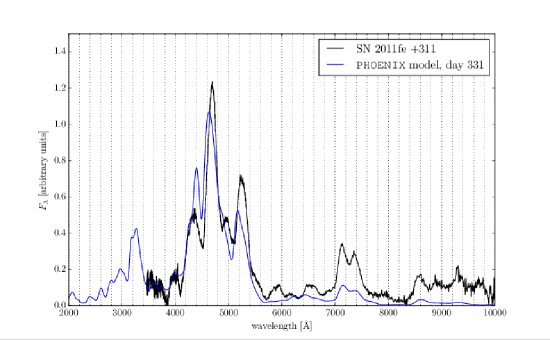
The observed and synthetic spectra at day +311 are shown in Figure 9, and the single-ion spectra are shown in Figure 10. At this epoch the spectra look similar to those at day +205. The [Fe 3] emission at 4700 Å is still strong, although at day +311 the [Fe 2] emission at 4400 Å has grown in strength, and continues to do so at later epochs. This is likely a reflection of some (but not much) recombination from Fe 3 to Fe 2 at this age. The Ca 2 H & K emission is still present at 4000 Å, but somewhat weak, just as at day +205.
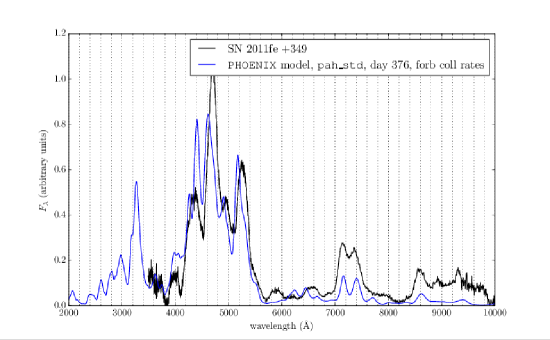
4.4 Day +349
The model and observations at day +349 are displayed in Figure 11. The corresponding single-ion spectra are shown in Figure 12. The Ca 2 H & K doublet emission at 4000 Å is of similar strength as at day +205, and it may still contribute to that feature in SN 2011fe, although the [Fe 3] appears to be stronger at that wavelength.
At this and later epochs the model begins to exhibit some problems. A sharp emission feature forms in the near-UV in the synthetic spectrum which is not observed in SN 2011fe. In addition, in the synthetic spectrum the emission at 4400 Å (due mostly to Fe 2) is nearly as strong as the 4700 Å feature (mostly Fe 3), while in the observed spectrum the latter remains considerably stronger. This problem is likely not one of radiative transfer effects in the model, but rather one of atomic physics. The recombination rate for ions scales with the free electron density , which dilutes geometrically roughly as (De, Baron & Hauschildt, 2010). Thus at these very late times the recombination time scale for, e.g., Fe 2, can be of the same order as the dynamical time scale, i.e., the age of the SN. In this case, time-dependent effects of ion recombination can become influential on spectrum formation (Sollerman et al., 2004; Taubenberger et al., 2015). In the calculations used to generate the above figures, we neglected time-dependence in both the radiation field and the ion populations: both are assumed to be in steady-state. Assuming a steady-state radiation field is a valid approximation at late times — since at most wavelengths the optical depths in the ejecta are low, the radiative transfer time scale is effectively the light-crossing time, which is many orders of magnitude shorter than the dynamical time scale. Thus the radiation field equilibrates with the ejecta almost instantaneously at any given time . However, by assuming steady-state in the ion populations, we overestimate the rate of recombination from, e.g., Fe 3 to Fe 2. This manifests in synthetic spectra as Fe 2 features which are too strong, as in Figure 11. Presumably the same pathology affects the day +578 synthetic spectrum more severely (see Figure 4.6).
Time-dependent effects in the ion populations may not be the only source of the discrepant features in the synthetic spectra at very late times. The density profile of the ejecta in the explosion model also strongly affect . Thus the Fe 2-to-Fe 3 population ratio may provide a constraint on the initial conditions of the explosion model. For example, Figure 11 may indicate that the density of the iron-rich core of the model is too high, leading to an which is too high, inducing recombination from Fe 3 to Fe 2 too soon.

4.5 The UV spectrum at day +360
The UV spectrum from HST at day +360, as well as the best fitting spectrum from PHOENIX, are shown in Figure 13. The single-ion spectra are shown in Figure 14. From these one finds that Fe 2 is responsible for most of the spectral features in the UV at day +360, just as it was at day +100. However, Fe 3, Co 3, and Ni 3 all contribute significantly to the bluest portion of the spectrum as well. The most interesting result, however, is that the Ca 2 H & K doublet continues to contribute significantly to the emission around 4000 Å, despite being over 1 yr since explosion. It seems, then, that the extreme strength of this line overcomes both the small total abundance of Ca 2 in the ejecta, as well as the large amount of geometric dilution which accompanies a year of expansion.
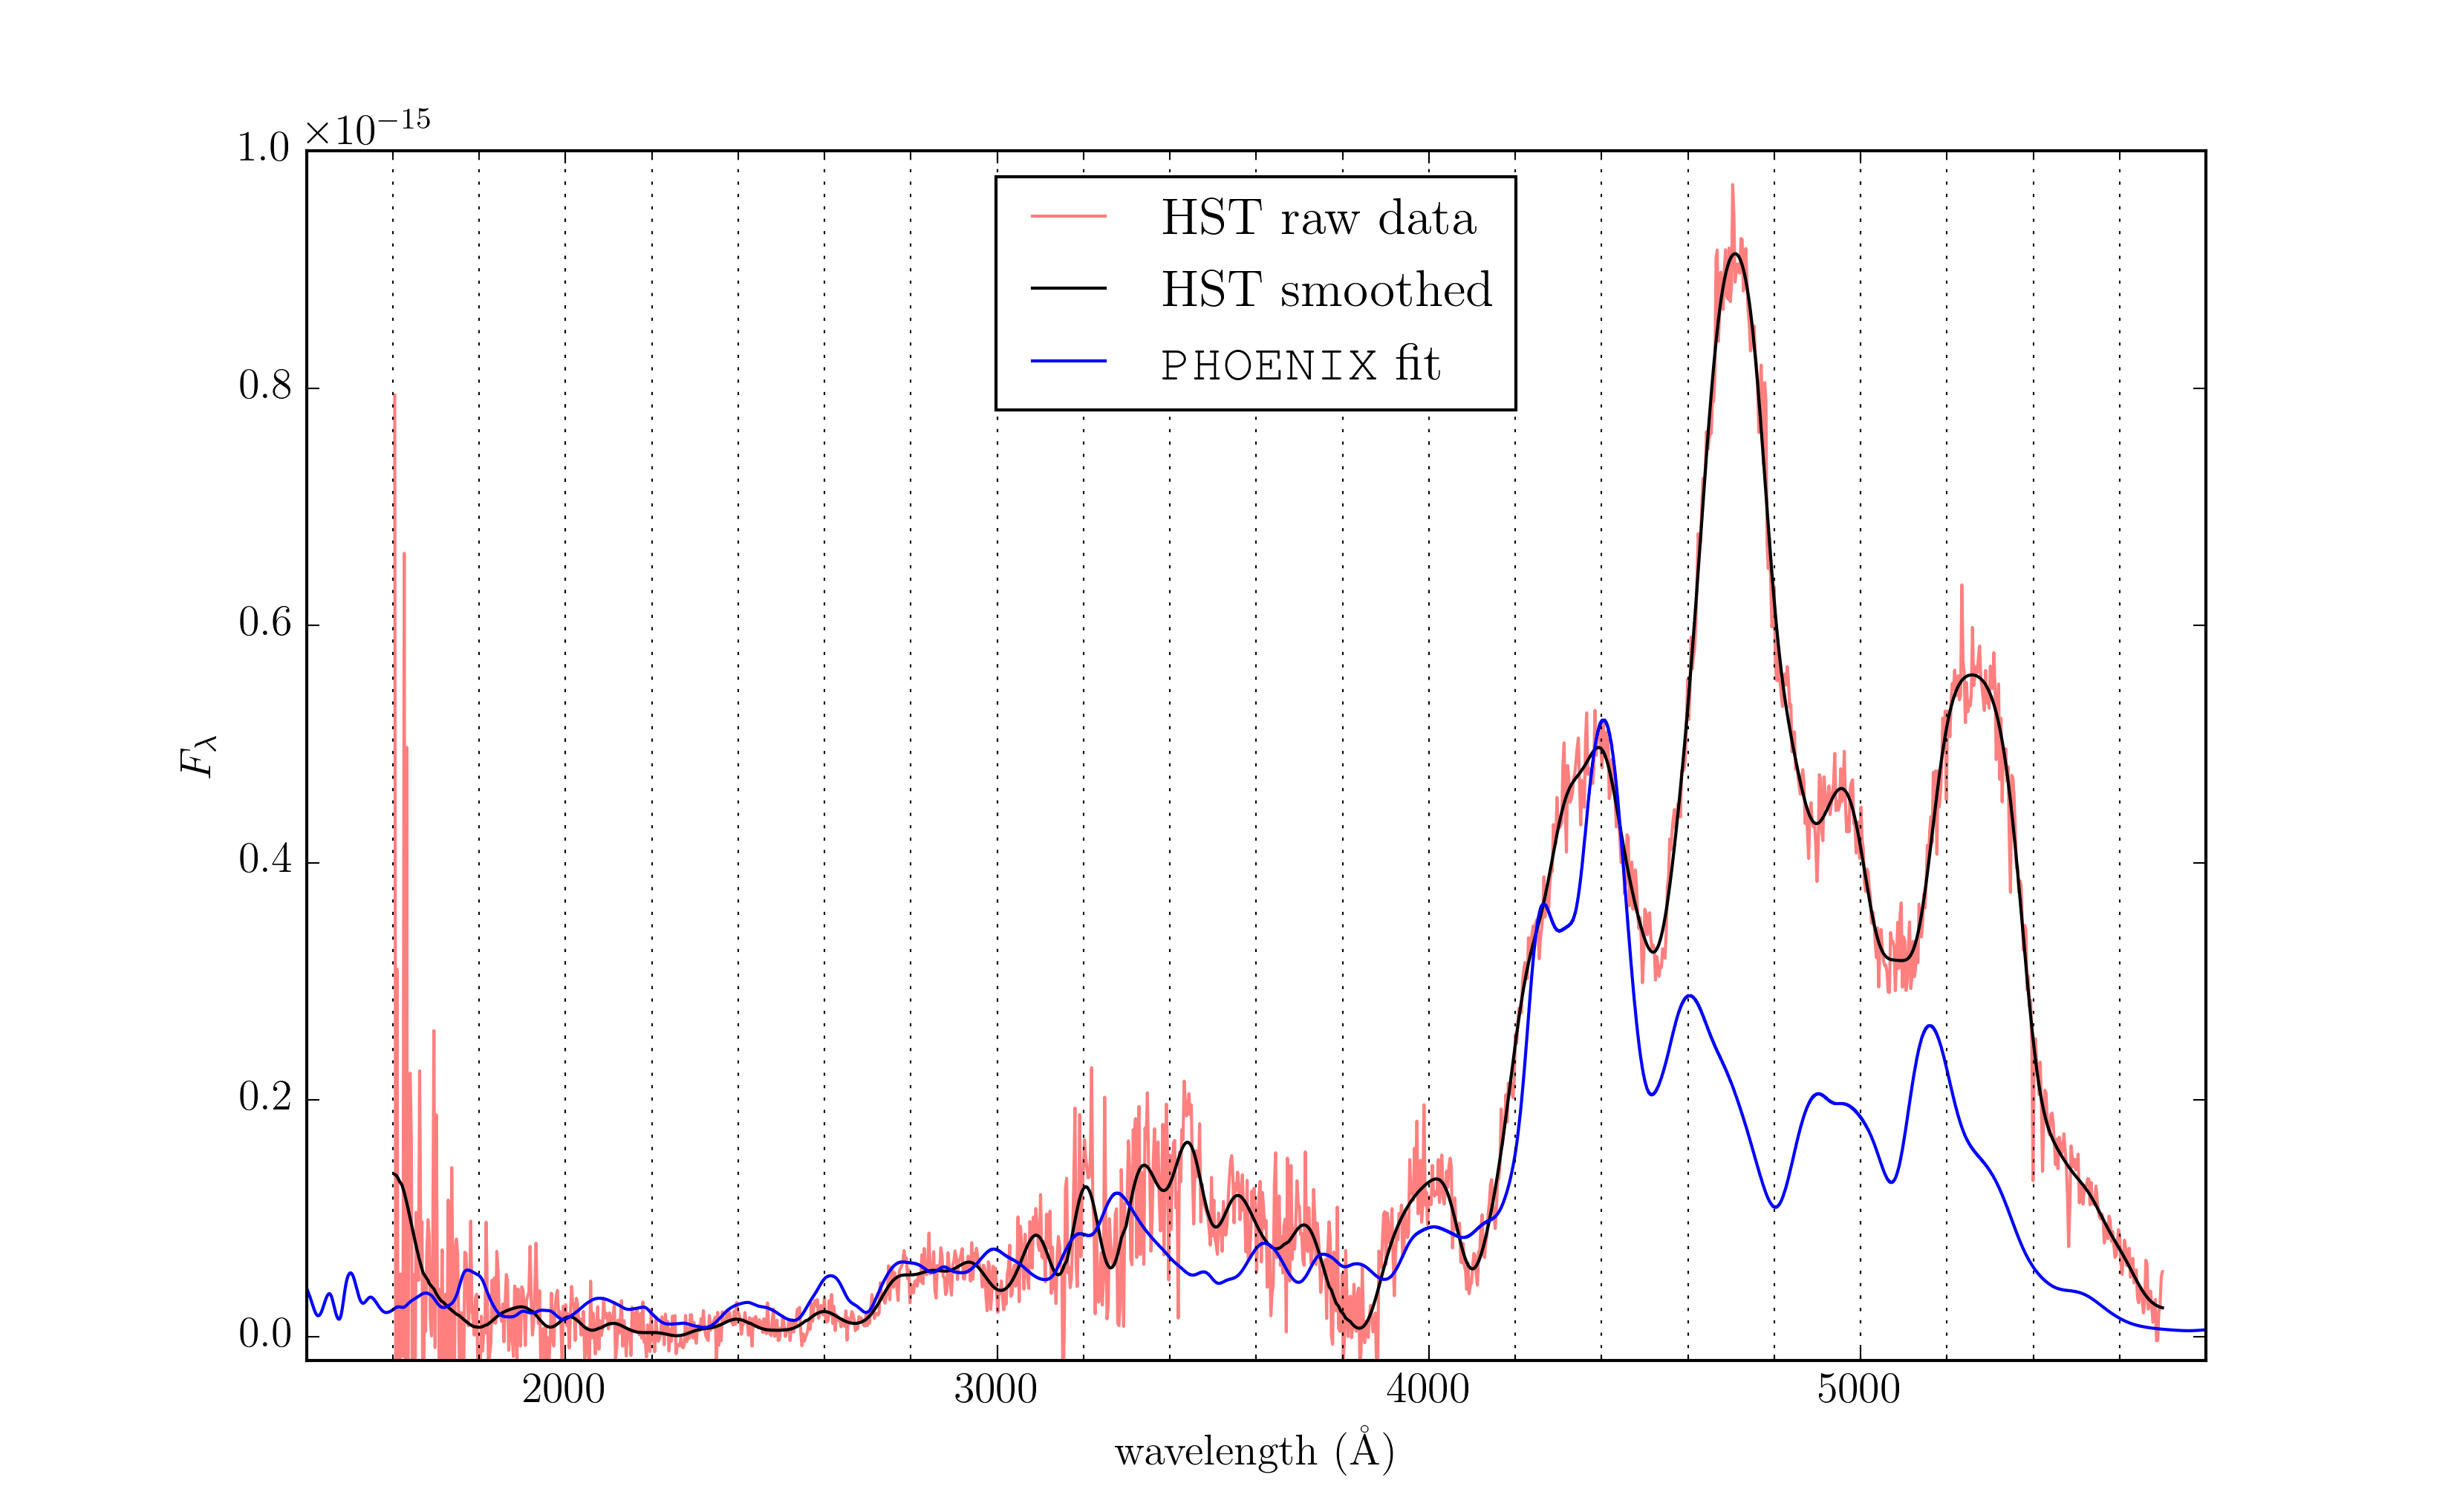
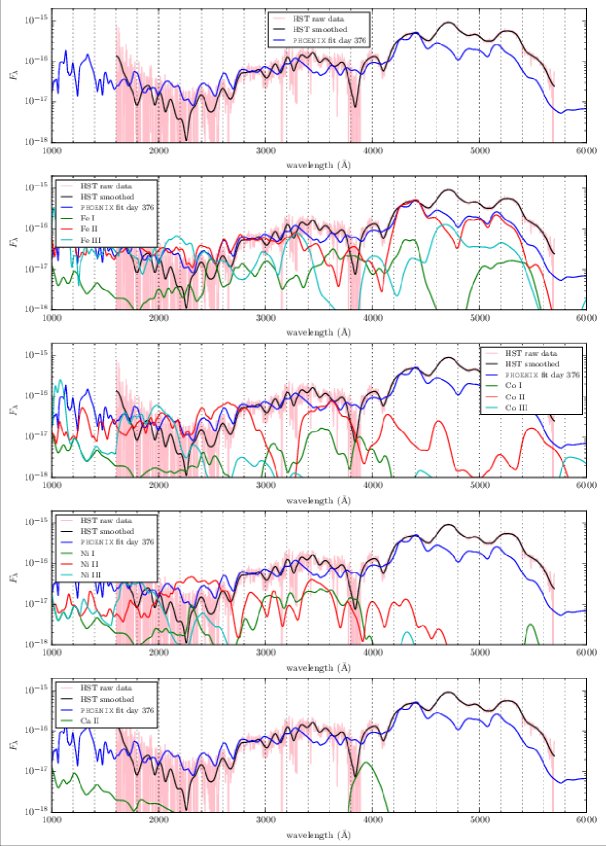
A second notable feature of this result is that nearly all of the Fe 2 features are permitted lines, not forbidden; the bluest forbidden lines for any ion in this version of the PHOENIX atomic database is about 3200 Å. Identifying these features is no simple feat, however, because Fe 2 has thousands of lines between Å. Furthermore, the contributions from several other ions in the UV at late times, each with several thousands of lines themselves, are at some wavelengths of similar strength as Fe 2. The convolution of all of these lines from different species renders the identification of individual features in the UV a difficult task. However, even without identifying particular lines, we can nevertheless learn a great deal about the UV line forming region using other methods (see Figure 6).
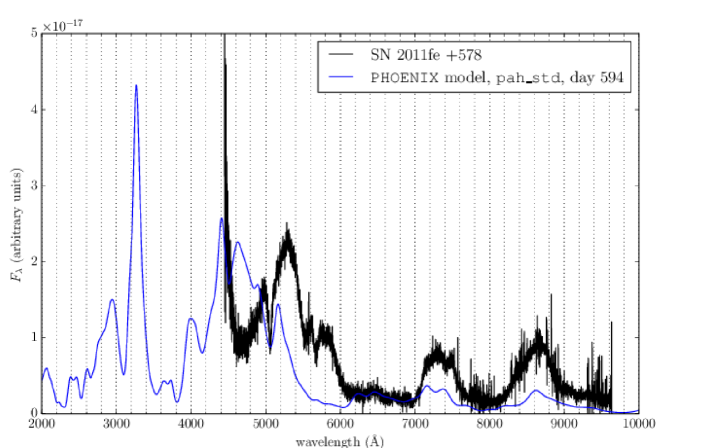
4.6 Day +578
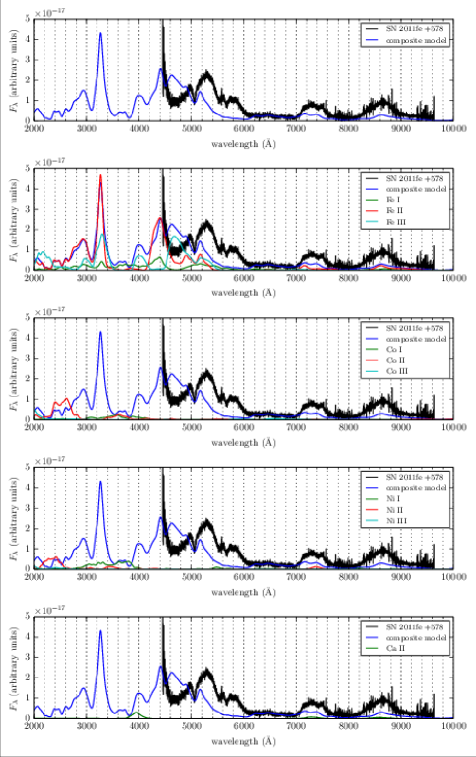
Figure 15 shows the observed and synthetic spectra of SN 2011fe at day +578. The single-ion spectra are shown in Figure 16. The fit of the PHOENIX synthetic spectrum to the observation is poor, and has resisted improvement even experimenting with a variety of different temperature-correction algorithms. Possible culprits for this include time-dependent effects as discussed in §4.4, as well as other physical processes which PHOENIX currently does not treat, including dielectric recombination and charge-exchange reactions. However, analysis of this result nevertheless reveals some useful information. For example, the unphysical spike in flux around 3250 Å is due entirely to Fe 2, although to which line in particular is not clear. In addition, the emission at 8600 Å formerly produced by Ca 2 IR3, has been replaced by [Fe 2] Å. This is yet another example of a truly remarkable degeneracy among permitted lines and forbidden lines at similar wavelength, but which become active at very different times.
Although our model spectra predict the recombination to Fe 2 too early, the event eventually does happen in SN 2011fe. In particular, in the day +594 spectrum, the strong Fe 3 emission peak at 4700 Å has disappeared entirely, with only a handful of Fe 2 features remaining. Indeed, Taubenberger et al. (2015) and Graham et al. (2015) have tentatively identified features of Fe 1 in d spectrum of SN 2011fe, perhaps heralding a concurrent recombination transition from Fe 2 to Fe 1.
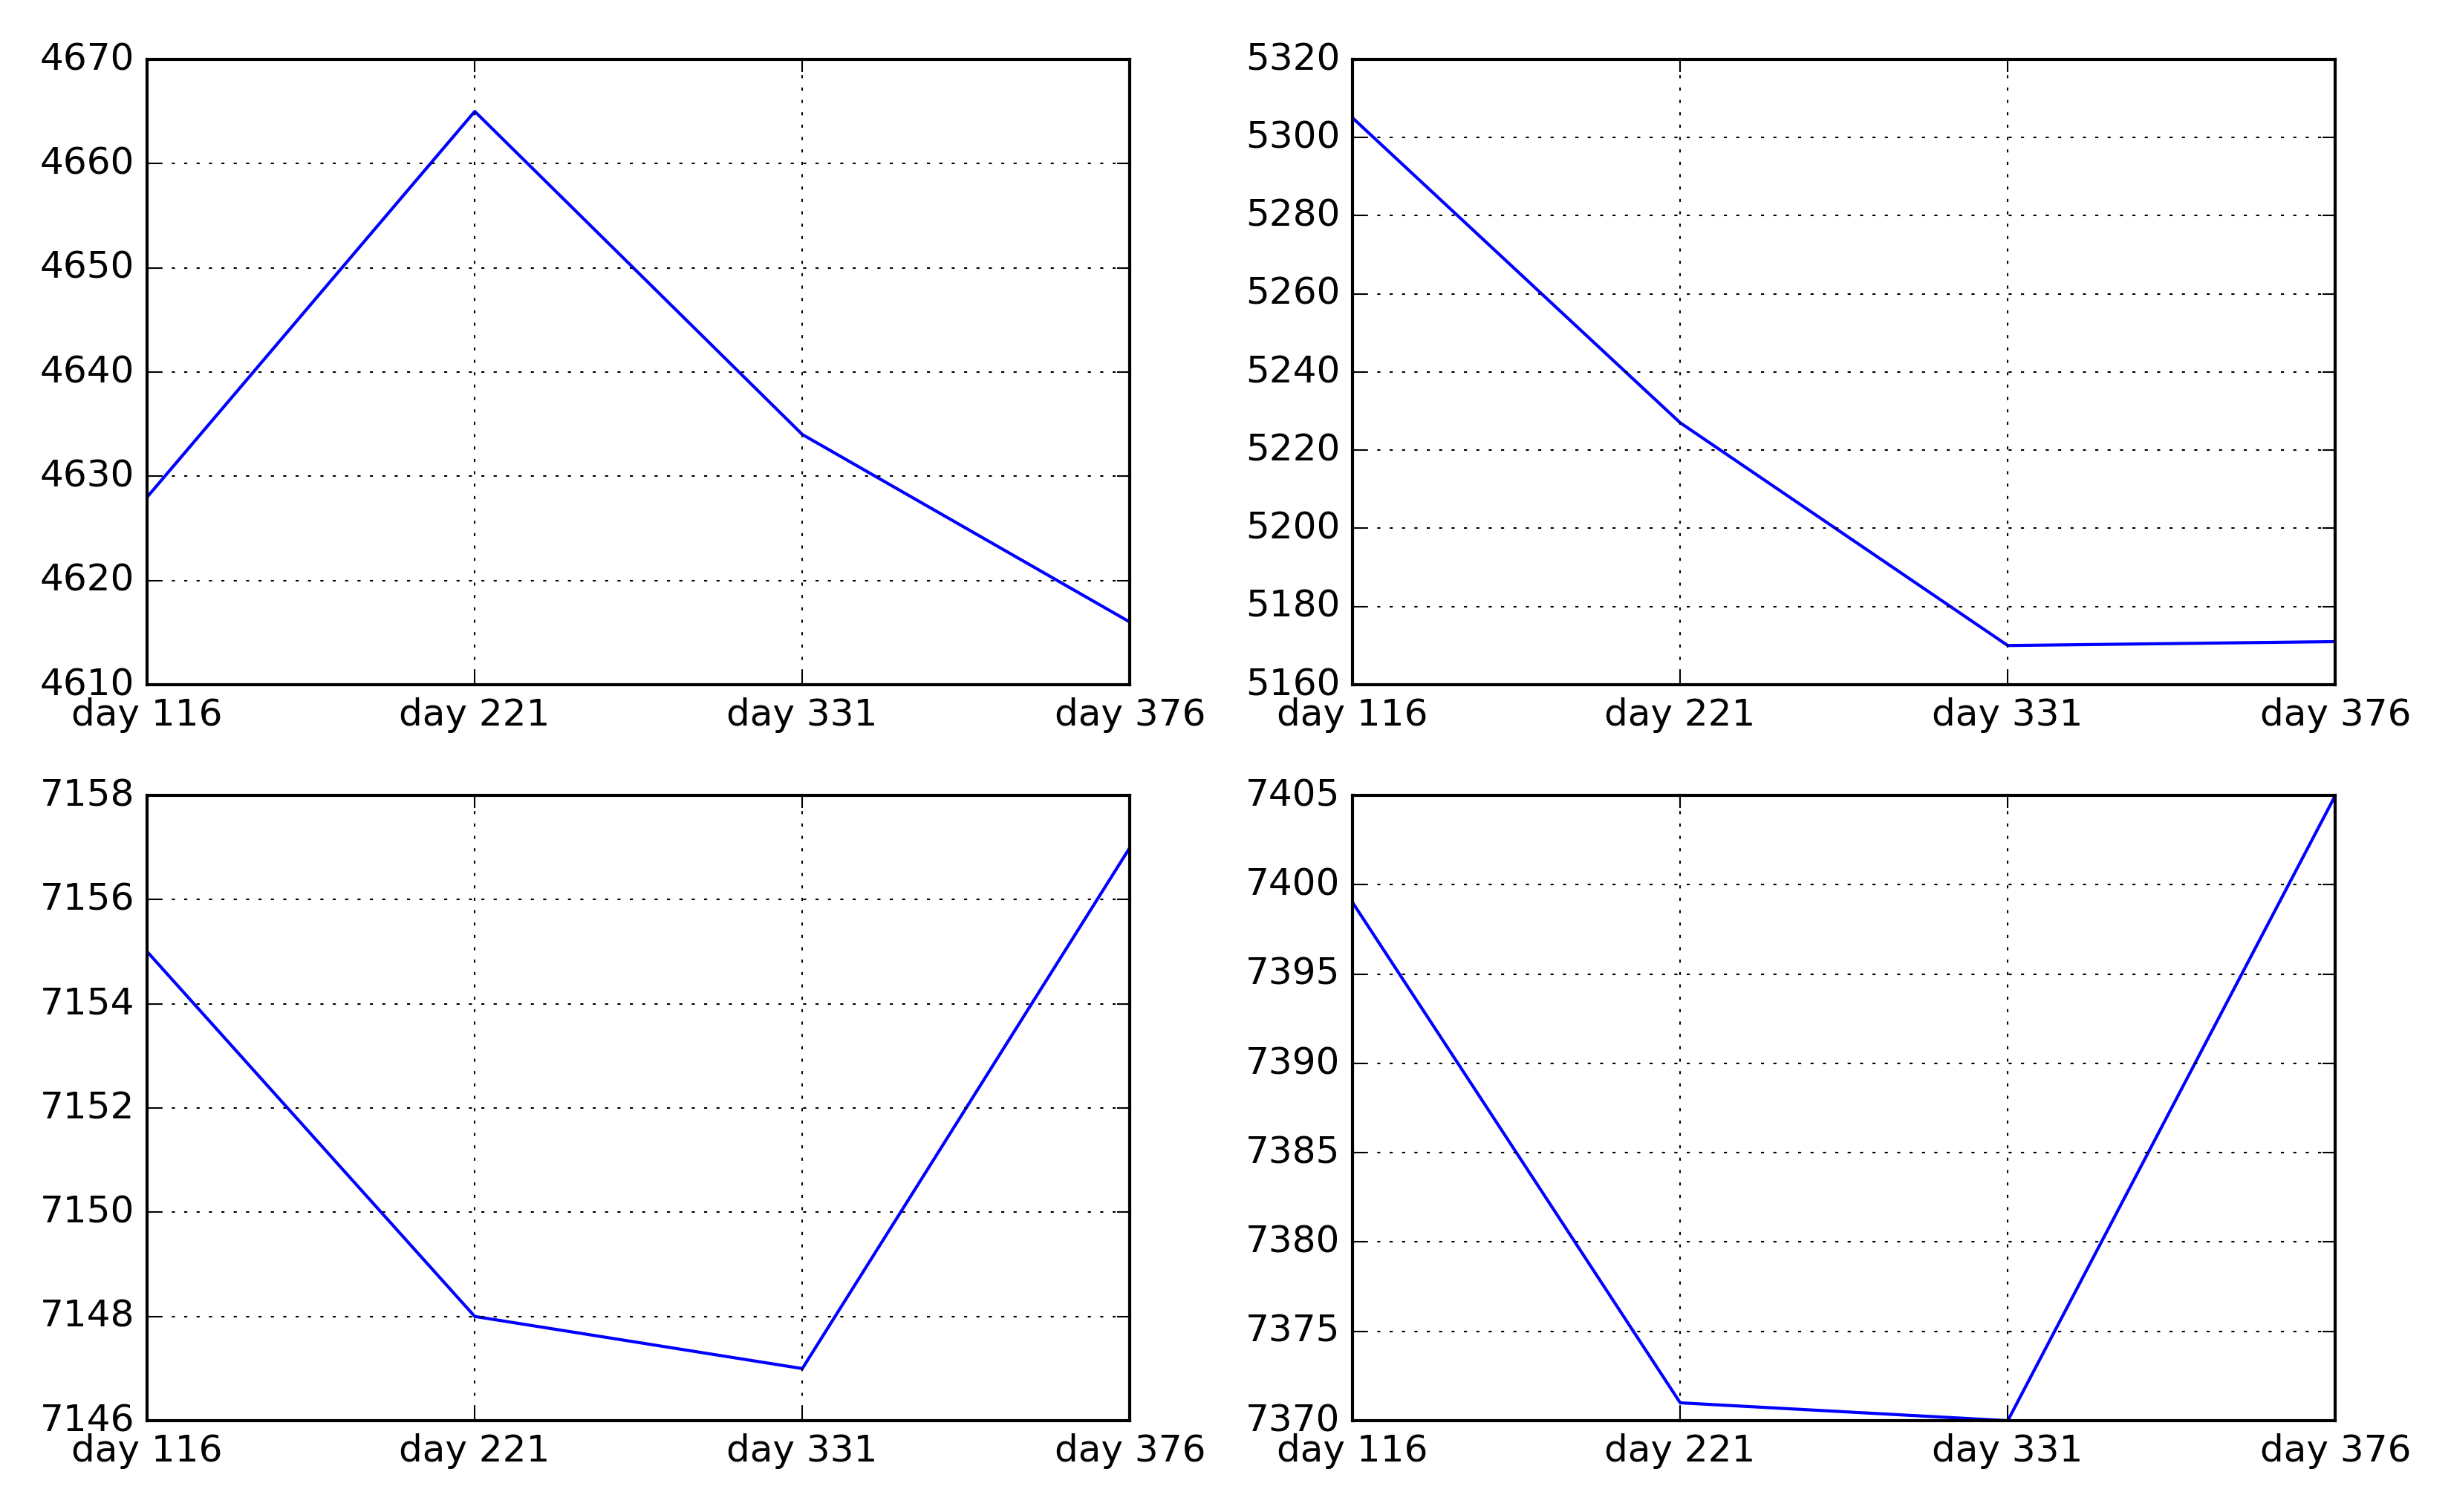
5 Velocity Shifts
In a recent paper, Black, Fesen & Parrent (2016) examined the wavelength shifts of prominent features at late times in a series of SNe Ia spectra, including the spectra of SN 2011fe. They found, in particular, a redward shift of of the prominent 4700 Åfeature with no signs of the redward drift slowing down at epochs up to day +400. Figure 17 shows that our models show no such general trend. In fact, the 4700 Åfeature after a strong redward shift, begins to move back to the blue. Since our models do not show a strong fidelity with the observations it is difficult to draw firm conclusions. Black, Fesen & Parrent (2016) suggest that the redward shift is primarily caused by temporal variations due to lines of [Fe III] and [Co II]. Since these lines are very temperature sensitive, this could be indicative of our general model uncertainties.
6 Opacity at late times
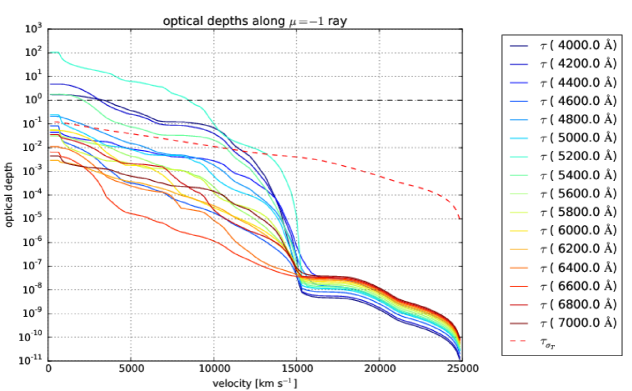
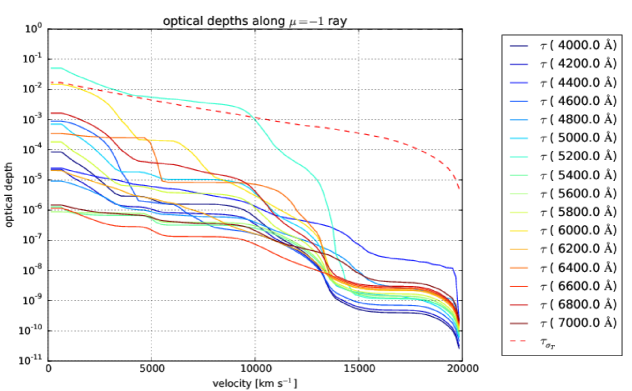
Our PHOENIX calculations have been fairly successful at reproducing the late-time optical and UV spectra of the normal SN 2011fe. In addition, one of the great advantages of using first-principles codes such as PHOENIX is that one may glean a great deal of information about the underlying physics which drives the formation of the synthetic spectra. For example, in Figure 19 we show the optical depths along the (radially inward) ray in the day +349 model whose spectrum was shown in Figure 11. For reference, the black dashed line shows , the division between optically thick and optically thin. The dashed red line shows the optical depth due only to Thomson scattering; at early times this is the dominant opacity source and gives rise to the photosphere in SNe. At late times, however, the geometric dilution of the free electron density leads to a very low Thomson scattering opacity, falling well below even all the way to the center of the ejecta. From this alone we may infer that there is likely very little continuum radiation present this late in a SN Ia’s lifetime, as reflected in the spectra. Furthermore, at only a select few wavelengths – mostly on the blue edge of the optical band – does the optical depth reach at all; at most wavelengths Å, the ejecta are quite optically thin, in agreement with previous studies. Our calculations therefore indicate that most of the optical spectrum at day +349 in SN 2011fe consists of blended emission features from collisionally excited, optically thin forbidden lines.
The UV portion of the spectrum of SN 2011fe behaves entirely differently than the optical, however. One may suspect as much simply by noticing the significant degree of structure and complexity in the observed UV spectrum (Figure 2). These suspicions are confirmed by analogous calculations of optical depths at various UV wavelengths, shown in Figure 21. The black and red dashed lines are the same as in Figure 19. Unlike the optical band, however, most UV wavelengths are extremely optically thick, with many reaching at the center of the ejecta. Another surprising result is that many UV wavelengths become optically thick at quite high velocity, crossing the threshold at km s-1. This result is corroborated by the presence of the emission component of the Ca 2 H & K doublet near 4000 Å in Figure 14.
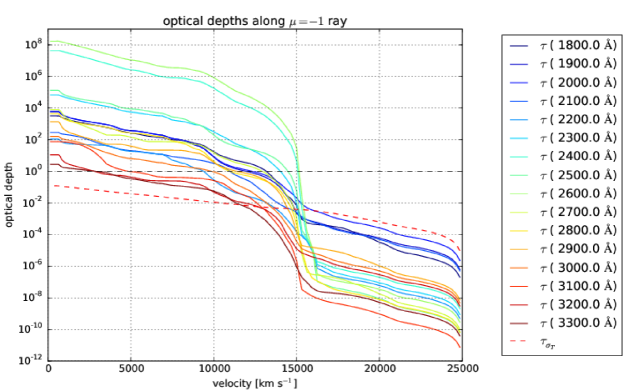
If the UV remains as optically thick as Figure 19 and Figure 21 suggest, then it appears that the transition from the “photospheric” to the “nebular” phase in SNe Ia is far more complex than expected. Specifically, there are likely few or no forbidden emission lines which are active in the UV; this precludes the possibility of measuring asymmetric bulk motion of the inner regions of the SN ejecta, since the assumption behind such measurements is that the emission lines are optically thin and centered at the line rest wavelengths (Maeda et al., 2010). On the other hand, since the UV is optically thick, the spectrum may consist of the same overlapping P Cygni line scattering profiles which characterize maximum-light spectra of SNe; if this is the case we may be able to infer ejecta velocities of the iron-rich core of SN 2011fe by measuring the location of the absorption minima of the features in Figure 2. However, as discussed in §4.5, the multitude of UV lines, as well as likely blending among several atomic species, make this challenging. If we entertain the possibility that some of the UV spectrum is forming at the UV photosphere at velocities of order km s-1, the rest wavelengths of such lines would still lie within a crowded space of UV and optical transitions of iron-peak elements.
The problem with the later fits may be related to time-dependent effects in the ionization of the gas, as the recombination time scale at late times is likely of order of the age of the SN. By assuming steady-state in our calculations, we likely overestimated the recombination rate, leading to an overabundance of Fe 2 with respect to Fe 3. Re-computing these models with time-dependence in the NLTE rate equations is possible in principle, but the inherent “noisiness” of the root-finding algorithm we used to calculate the temperatures becomes amplified with each time step, resulting in a large amount of spurious temperature oscillations in the model at very late times, and a poorly fitting spectrum.
7 Conclusions
We extended PHOENIX to calculate radiative transfer models well into the late-time epochs of SNe Ia, with an eye toward obtaining good fits to the high-quality optical and UV spectra of SN 2011fe. Doing so required similar methods to those discussed in Friesen et al. (2014), in particular using an alternative method to that of Unsöld-Lucy for calculating the temperature structure of the gas, as well as accounting for the collisional and radiative rate data for forbidden lines, which behave quite differently than permitted lines. The resulting synthetic spectra, ranging from +100 to +578 days post-maximum light, vary in degrees of fidelity to corresponding observed spectra of SN 2011fe, with the earlier epochs fitting quite well and the later epochs less so. At day +100 we found that radiative transfer calculations which neglect forbidden lines and those which include them can produce remarkably similar optical spectra, but with quite different atomic species and combinations of lines forming the various features. We found that, at least as late as day +360, permitted lines such as Ca 2 H & K and IR3 continue to influence spectrum formation in the optical, and permitted lines of Fe 2 form much of the spectrum in the UV. In addition, these models indicate that some emission features from permitted lines are replaced by other emission features of forbidden lines at nearly the same wavelength as the SN evolves. For example, the emission from Ca 2 H & K at 4000 Å is replaced around day +205 by [Fe 3] Å, and the emission from Ca 2 IR3 at around 8600 Å is replaced by [Fe 2] Å.
Acknowledgments
The work has been supported in part by support for programs HST-GO-12948.004-A was provided by NASA through a grant from the Space Telescope Science Institute, which is operated by the Association of Universities for Research in Astronomy, Incorporated, under NASA contract NAS5-26555. This work was also supported in part by NSF grant AST-0707704, by NASA Grant NNX16AB25G and DOE Grant DE-SC0009956. The work of EB was also supported in part by SFB 676, GRK 1354 from the DFG. R.J.F. gratefully acknowledges support from NASA grant 14-WPS14-0048, NSF grant AST-1518052, and the Alfred P. Sloan Foundation.
This research used resources of the National Energy Research Scientific Computing Center (NERSC), which is supported by the Office of Science of the U.S. Department of Energy under Contract No. DE-AC02-05CH11231; and the Höchstleistungs Rechenzentrum Nord (HLRN). We thank both these institutions for a generous allocation of computer time.
References
- Axelrod (1980) Axelrod T. S., 1980, PhD thesis, University of California, Santa Cruz
- Black, Fesen & Parrent (2016) Black C. S., Fesen R. A., Parrent J. T., 2016, ApJ, submitted, astro-ph/1604.01044
- Bloom et al. (2012) Bloom J. S. et al., 2012, ApJ, 744, L17
- Bongard et al. (2008) Bongard S., Baron E., Smadja G., Branch D., Hauschildt P. H., 2008, ApJ, 687, 456
- Bowers et al. (1997) Bowers E. J. C., Meikle W. P. S., Geballe T. R., Walton N. A., Pinto P. A., Dhillon V. S., Howell S. B., Harrop-Allin M. K., 1997, MNRAS, 290, 663
- Branch et al. (2005) Branch D., Baron E., Hall N., Melakayil M., Parrent J. T., 2005, PASP, 117, 545
- Branch et al. (2008) Branch D. et al., 2008, PASP, 120, 135
- Chomiuk et al. (2012) Chomiuk L. et al., 2012, ApJ, 750, 164
- De, Baron & Hauschildt (2010) De S., Baron E., Hauschildt P. H., 2010, MNRAS, 401, 2081
- Dessart et al. (2014) Dessart L., Hillier D. J., Blondin S., Khokhlov A., 2014, MNRAS, 439, 3114
- Domínguez, Höflich & Straniero (2001) Domínguez I., Höflich P., Straniero O., 2001, ApJ, 557, 279
- Friesen et al. (2012) Friesen B., Baron E., Branch D., Chen B., Parrent J. T., Thomas R. C., 2012, ApJS, 203, 12
- Friesen et al. (2014) Friesen B., Baron E., Wisniewski J. P., Parrent J. T., Thomas R. C., Miller T. R., Marion G. H., 2014, ApJ, 792, 120
- Graham et al. (2015) Graham M. L., Nugent P. E., Sullivan M., Filippenko A. V., Cenko S. B., Silverman J. M., Clubb K. I., Zheng W., 2015, ArXiv e-prints
- Hauschildt & Baron (1999) Hauschildt P. H., Baron E., 1999, Journal of Computational and Applied Mathematics, 109, 41
- Hauschildt & Baron (2014) —, 2014, A&A, 566, A89
- Horesh et al. (2012) Horesh A. et al., 2012, ApJ, 746, 21
- Iwamoto et al. (1999) Iwamoto K., Brachwitz F., Nomoto K., Kishimoto N., Umeda H., Hix W. R., Thielemann F.-K., 1999, ApJS, 125, 439
- Jha et al. (2006) Jha S., Branch D., Chornock R., Foley R. J., Li W., Swift B. J., Casebeer D., Filippenko A. V., 2006, AJ, 132, 189
- Kerzendorf et al. (2014) Kerzendorf W. E., Taubenberger S., Seitenzahl I. R., Ruiter A. J., 2014, ApJ, 796, L26
- Kirshner & Oke (1975) Kirshner R. P., Oke J. B., 1975, ApJ, 200, 574
- Kuchner et al. (1994) Kuchner M. J., Kirshner R. P., Pinto P. A., Leibundgut B., 1994, ApJ, 426, L89
- Kurucz (1995) Kurucz R. L., 1995, in Astronomical Society of the Pacific Conference Series, Vol. 78, Astrophysical Applications of Powerful New Databases, Adelman S. J., Wiese W. L., eds., p. 205
- Kurucz (2002) —, 2002, in American Institute of Physics Conference Series, Vol. 636, Atomic and Molecular Data and Their Applications, Schultz D. R., Krstic P. S., Ownby F., eds., pp. 134–143
- Li et al. (2011) Li W. et al., 2011, Nature, 480, 348
- Maeda et al. (2010) Maeda K. et al., 2010, Nature, 466, 82
- Margutti et al. (2012) Margutti R. et al., 2012, ApJ, 751, 134
- Marion et al. (2009) Marion G. H., Höflich P., Gerardy C. L., Vacca W. D., Wheeler J. C., Robinson E. L., 2009, AJ, 138, 727
- Mazzali & Hachinger (2012) Mazzali P. A., Hachinger S., 2012, MNRAS, 424, 2926
- Mazzali et al. (2011) Mazzali P. A., Maurer I., Stritzinger M., Taubenberger S., Benetti S., Hachinger S., 2011, MNRAS, 416, 881
- Mazzali et al. (2008) Mazzali P. A., Sauer D. N., Pastorello A., Benetti S., Hillebrandt W., 2008, MNRAS, 386, 1897
- Mazzali et al. (2015) Mazzali P. A. et al., 2015, ArXiv e-prints
- McClelland et al. (2013) McClelland C. M., Garnavich P. M., Milne P. A., Shappee B. J., Pogge R. W., 2013, ApJ, 767, 119
- Meyerott (1978) Meyerott R. E., 1978, ApJ, 221, 975
- Meyerott (1980) —, 1980, ApJ, 239, 257
- Munari et al. (2013) Munari U., Henden A., Belligoli R., Castellani F., Cherini G., Righetti G. L., Vagnozzi A., 2013, New A, 20, 30
- Nomoto, Thielemann & Yokoi (1984) Nomoto K., Thielemann F.-K., Yokoi K., 1984, ApJ, 286, 644
- Nugent et al. (2011) Nugent P. E. et al., 2011, Nature, 480, 344
- Parrent et al. (2012) Parrent J. T. et al., 2012, ApJ, 752, L26
- Pereira et al. (2013) Pereira R. et al., 2013, A&A, 554, A27
- Richmond & Smith (2012) Richmond M. W., Smith H. A., 2012, Journal of the American Association of Variable Star Observers (JAAVSO), 40, 872
- Röpke et al. (2012) Röpke F. K. et al., 2012, ApJ, 750, L19
- Ruiz-Lapuente et al. (1995) Ruiz-Lapuente P., Kirshner R. P., Phillips M. M., Challis P. M., Schmidt B. P., Filippenko A. V., Wheeler J. C., 1995, ApJ, 439, 60
- Ruiz-Lapuente & Lucy (1992) Ruiz-Lapuente P., Lucy L. B., 1992, ApJ, 400, 127
- Shappee et al. (2013) Shappee B. J., Stanek K. Z., Pogge R. W., Garnavich P. M., 2013, ApJ, 762, L5
- Silverman, Ganeshalingam & Filippenko (2013) Silverman J. M., Ganeshalingam M., Filippenko A. V., 2013, MNRAS, 430, 1030
- Sollerman et al. (2004) Sollerman J. et al., 2004, A&A, 428, 555
- Taubenberger et al. (2015) Taubenberger S. et al., 2015, MNRAS, 448, L48
- Thomas, Nugent & Meza (2011) Thomas R. C., Nugent P. E., Meza J. C., 2011, PASP, 123, 237
- Vinkó et al. (2012) Vinkó J. et al., 2012, A&A, 546, A12