A shock in ‘El Gordo’ cluster and the origin of the radio relic
Abstract
We present an X-ray and radio study of the famous ‘El Gordo’, a massive and distant () galaxy cluster. In the deep (340 ) Chandra observation, the cluster appears with an elongated and cometary morphology, a sign of its current merging state. The GMRT radio observations at 610 confirm the presence of a radio halo which remarkably overlaps the X-ray cluster emission and connects a couple of radio relics. We detect a strong shock () in the NW periphery of the cluster, co-spatially located with the radio relic. This is the most distant () and one of the strongest shock detected in a galaxy cluster. This work supports the relic–shock connection and allows to investigate the origin of these radio sources in a uncommon regime of . For this particular case we found that shock acceleration from the thermal pool is still a viable possibility.
keywords:
shock waves – X-rays: galaxies: clusters – galaxies: clusters: individual: ACT-CL J0102–4915 – radio continuum: general – radiation mechanisms: non-thermal1 Introduction
Galaxy clusters are the largest virialized structures in the Universe and form
via aggregation of less massive systems (e.g. Press &
Schechter, 1974). During merger
events, the intra-cluster medium (ICM) is heated by shocks and is believed to
become turbulent. Part of the energy involved in these processes is converted
into non-thermal phenomena that exhibit themselves in the radio band as
halo and relic emissions (e.g. Brunetti &
Jones, 2014, for a review). Both radio
sources are diffuse cluster-scale sources with steep
spectra111, with spectral index.
(). Radio halos are generally morphologically connected with
the
X-ray emission of the hosting cluster, whereas radio relics are elongated,
polarized and found in cluster peripheries (e.g. Feretti et al., 2012, for an observational
overview). In particular, radio relics are believed to form at
the gigantic shocks that are generated in major mergers, where cosmic ray
electrons (CRe) are (re)accelerated (see Brüggen et al., 2012; Brunetti &
Jones, 2014, for reviews). This scenario is supported by the arc-shaped morphologies of
relics, their high level of polarization and by the fact that an increasing
number of shocks have been detected at the location of radio relics
(e.g. Akamatsu &
Kawahara, 2013; Bourdin et al., 2013; Shimwell
et al., 2015; Eckert et al., 2016; Botteon et al., 2016). The main difficulty in the understanding of the origin of radio
relics resides in the low Mach number () associated
with merger shocks. The acceleration efficiency at these weak shocks is indeed
expected to be small and in several cases it is in tension with the
observational requirements (e.g. Markevitch et al., 2005; Macario et al., 2011; Kang
et al., 2012; Pinzke
et al., 2013; Kang
et al., 2014; van Weeren
et al., 2016; Botteon et al., 2016).
ACT-CL J0102–4915 is the most massive cluster detected in the far Universe, at
a redshift of (Menanteau
et al., 2012). For its extraordinary mass of
(Planck
Collaboration et al., 2014), it is also
known with the
nickname of ‘El Gordo’. The cluster was firstly discovered by
its strong Sunyaev-Zel’dovich (SZ) signal (Marriage
et al., 2011) and later
confirmed through optical and X-ray observations. The system is in a complex
merger state, as revealed by the double peaked galaxy distribution and the
elongated morphology of its hot ( ) ICM
(Menanteau
et al., 2010, 2012). In the radio band, a tenuous halo and a
double relic system at the cluster NW and SE X-ray boundaries were discovered
(Lindner
et al., 2014).
In this paper we report the discovery of a strong shock associated with a radio
relic in ‘El Gordo’ cluster. In particular, our joint Chandra and Giant Metrewave Radio Telescope (GMRT) analysis provides interesting insights about the origin of the relic.
Throughout the paper, we assume a concordance CDM cosmology with , and ,
in which at the cluster redshift (). Reported
uncertainties are 68%, unless stated otherwise.
2 Observations and data reduction
2.1 X-ray data reduction
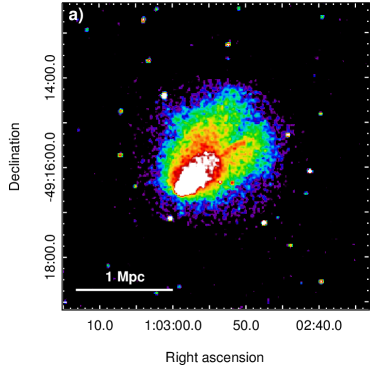
‘El Gordo’ was observed three times (ObsID: 12258, 14022, 14023) with Chandra in ACIS-I configuration and VFAINT mode for a total exposure time of
360 . We carried out the standard data reduction by using
CIAO 4.7 and Chandra CALDB 4.6.9. In particular,
soft proton flares were inspected analyzing the light curves extracted from the
S3 chip in the 0.5-2 band for each ObsID and removed using the
lc_clean routine. We then used the merge_obs task to make
the final 0.5-2 cleaned image (340 ) shown in
Fig. 1a.
We created a single exposure-corrected point spread function (PSF) map
with
minimum size for the merged image by combining the PSF and exposure maps of
each
ObsID. Once the PSF of the instrument is known, the wavdetect task
allows to identify discrete sources in the surface brightness (SB) image of the
cluster. These were detected using wavelet radii of 1, 2, 4, and 8 pixels,
confirmed by eye and excluded in the SB profile analysis. In order to create a
single background image, the reproject_event task was used to match
the background templates to the corresponding event files for every ObsID. This
single background image was normalized by counts in the band 9.5-12
and subtracted during the SB analysis.
Dealing with spectral analysis of low SB sources as in the case
of cluster outskirts requires a detailed treatment of the astrophysical and
instrumental background emission. In this respect, we modeled the sky
component due to the
Galactic emission with two thermal plasmas with and
, the cosmic X-ray background with an absorbed
power-law with photon index
and the ACIS-I particle background by using the analytical
approach prosed by Bartalucci et al. (2014). Spectra were extracted in the same
region for every ObsID and simultaneously fitted in the 0.5-11
energy
band with the package XSPEC v12.9.0o. Since the low X-ray count rate,
we
kept the metal abundance of the APEC model, which accounts for the ICM
thermal emission, fixed at the value of 0.3 (solar abundance
table by Anders &
Grevesse 1989) and used Cash statistics during the fits.
2.2 Radio data reduction
Archival GMRT 610 observations of ‘El Gordo’ (project code
, PI: R. R. Lindner) taken on 26 August 2012 were analyzed using the
Astronomical Image Processing System (AIPS). The GMRT Software Backend
was used to record the parallel polarization products RR and LL with a
bandwidth of 33.3 divided into 256 channels. The source 3C48 was
used for flux and bandpass calibration and the calibrator was used
for phase calibration towards the target. The total on-target observing time
was 170 minutes. Standard steps of flagging (excision of bad data) and
calibration were carried out. The resulting calibrated visibilities towards the
target were split and used for imaging. A few rounds of phase-only
self-calibration and a round of amplitude and phase self-calibration were
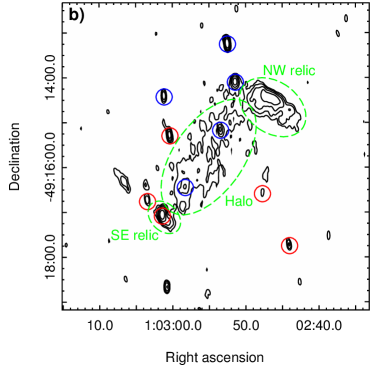
carried out to improve the sensitivity of the image. The final image with
visibilities weighted according to ROBUST 0 in the task IMAGR
and resolution (position angle ∘) is presented in
Fig. 1b. The image was corrected for the GMRT primary
beam using the task PBCOR. The off-source noise level is
50 and a 10% error on the absolute flux calibration
scale was assumed.
As a preliminary result of new GMRT data, we also used observations
taken at 327 (project code , PI: R. Kale) to perform
spectral analysis. The complete analysis of the new radio dataset will be
presented in the forthcoming paper (Kale et al., in preparation).
3 Results
3.1 X-ray/radio analysis
‘El Gordo’ X-ray emission remarkably recalls the famous ‘Bullet’ cluster
(Markevitch
et al., 2002): a dense cool core ( ) is
moving in the SE-NW direction producing a prominent cold front
(Menanteau
et al., 2012) which is expected to follow a shock wave
(e.g. Vikhlinin
et al., 2001; Markevitch
et al., 2002). The cluster is elongated along
the merger direction and presents a couple of X-ray tails that give to the
system a comet-like morphology (Fig. 1a).
Our 610 radio image of ‘El Gordo’ recovers extended emission better
than previously done by Lindner
et al. (2014, Fig. 2 and 15) as we considered
baselines down to 0.2 (instead of 0.48 ). This
allows to study the morphology of the diffuse sources in more detail. In our
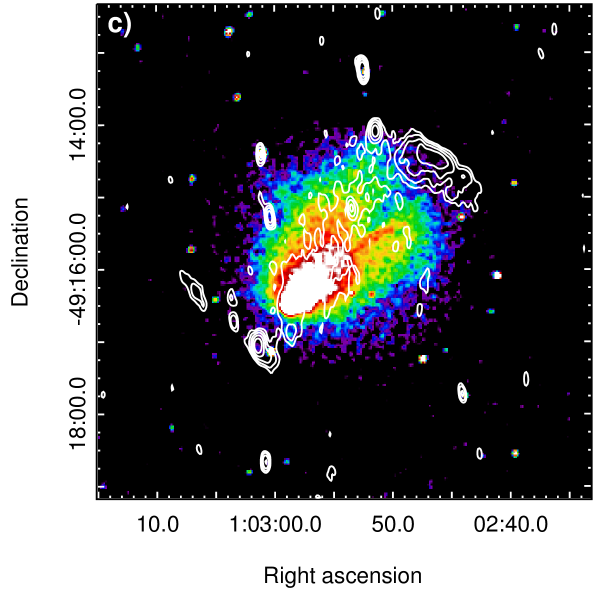
image shown in Fig. 1b, the prominent and elongated radio
halo connects a pair of radio relics, located in opposite directions at the NW
and SE edges of the cluster X-ray emission (Fig. 1c). The
strongest part of the halo coincides with the disrupted cluster core, whereas a
radio tail appears to remarkably follow the northern tail visible in the
X-rays (Fig. 1c).
Our work is focused on the NW radio relic, whose flux densities at 610
and 327 are and , respectively. These result in a radio spectral index
. The flux density of the relic at 2.1 measured
by Lindner
et al. (2014) with the Australia Telescope Compact Array implies from 2100 to
327 , which is consistent with what we estimated in the narrower
frequency range. Nevertheless, we will use the spectral index from 610 to
327 since it is taken from two high sensitivity images obtained from
GMRT observations with matched inner-uv coverage (uvmin
= 0.2 ).
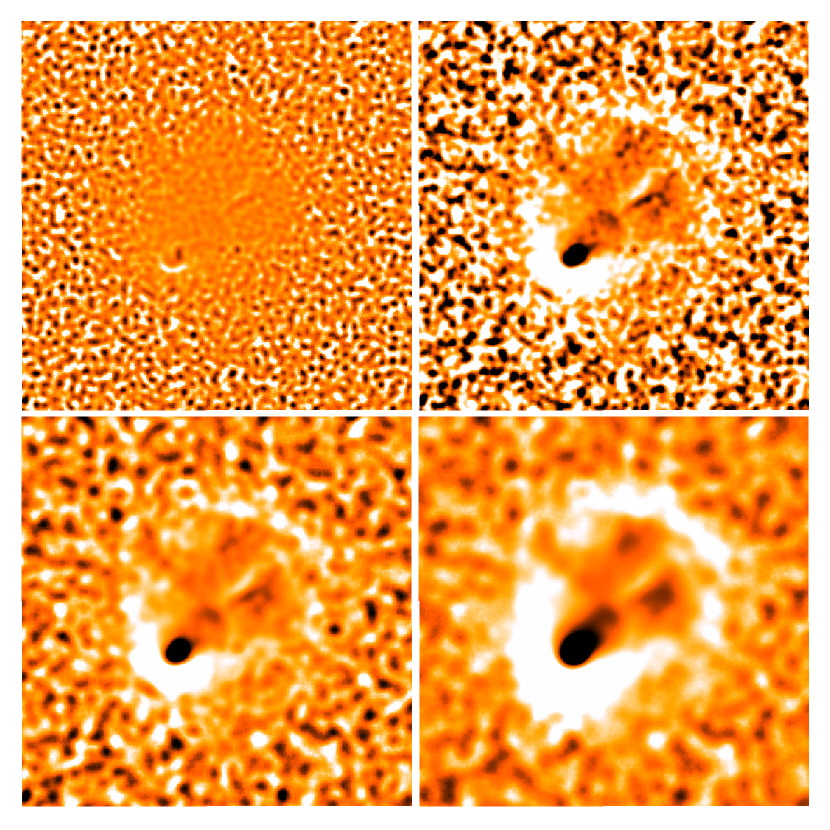
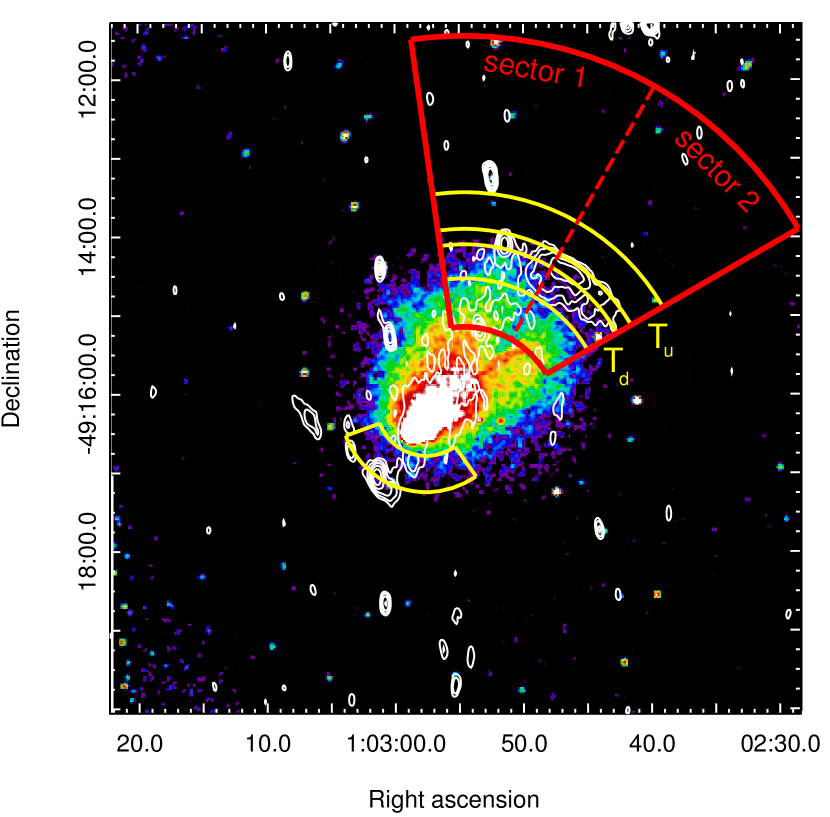
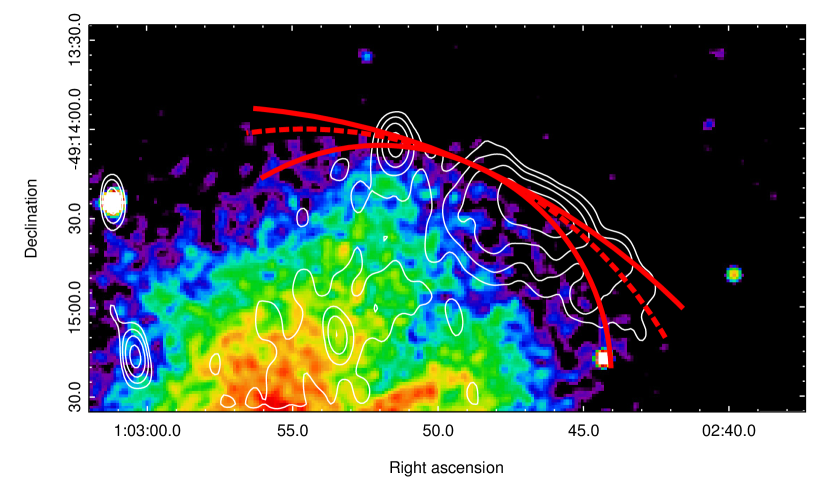
3.2 Relics and shocks
Double relics have been observed in different systems (e.g. de Gasperin et al., 2014) and are believed to form in mergers between two clusters with similar mass where diametrically opposite shocks move outwards along the merger axis (re)accelerating particles (van Weeren et al., 2011a). Menanteau et al. (2012) pointed out the possible presence of a couple of shocks by analyzing a Chandra unsharp-masked image of ‘El Gordo’. For these reasons we created the unsharp-masked images shown in Fig. 2 and searched for sharp edges in the X-ray SB image, identifying at least one discontinuity in the cluster. We used PROFFIT v1.3.1 (Eckert et al., 2011) to extract the SB profiles in the red sectors shown in Fig. 3, where the NW relic stands out. An underlying broken power-law density profile is usually adopted to describe the SB in presence of a discontinuity. In the case of spherical symmetry, the downstream density is higher by a factor of , with upstream density, at the shock putative distance . In formula
| (1) |
where is the density normalization, and are the power-law
indices and is the radius from the center of the sector (in
Fig. 3 RA: , DEC: , J2000). We
used this density shape to fit the X-ray SB keeping all parameters of the model
free to vary.
We firstly report results concerning sector 1+2 (opening angle (OA):
) because it covers the whole extension of the feature
shown in Fig. 2 and it gives the maximum SB drop with the best
statistics (a discussion on the sector choice is presented in
Section 3.2.1). In Fig. 4 we report
the best broken power-law model fit, which is in excellent agreement with data.
We detect a large SB drop, corresponding to a density compression factor
, co-spatially located with the relic. For a
shock, the Rankine-Hugoniot (RH) jump conditions for a monatomic gas
| (2) |
would lead to a Mach number . A shock is quite a rarity in galaxy clusters and so far only two of them have been detected ( in the ‘Bullet’ cluster, Markevitch 2006; in A665, Dasadia et al. 2016).

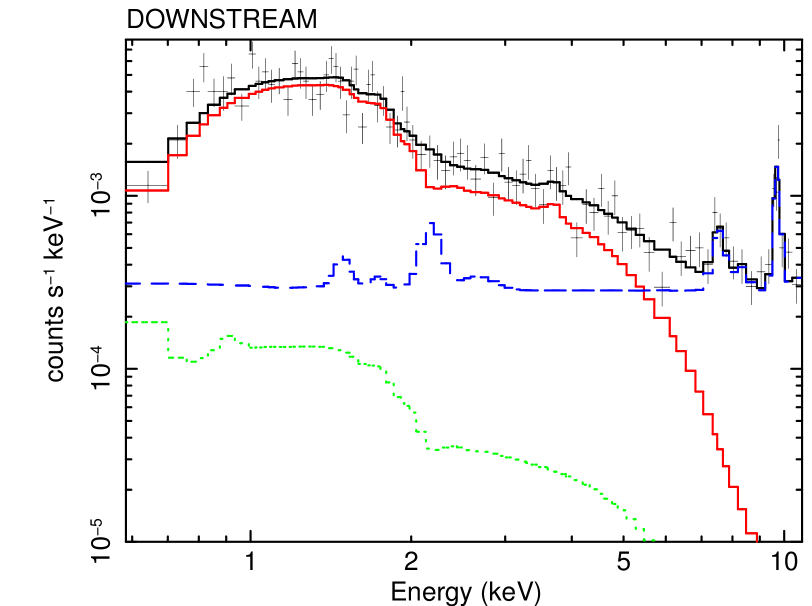
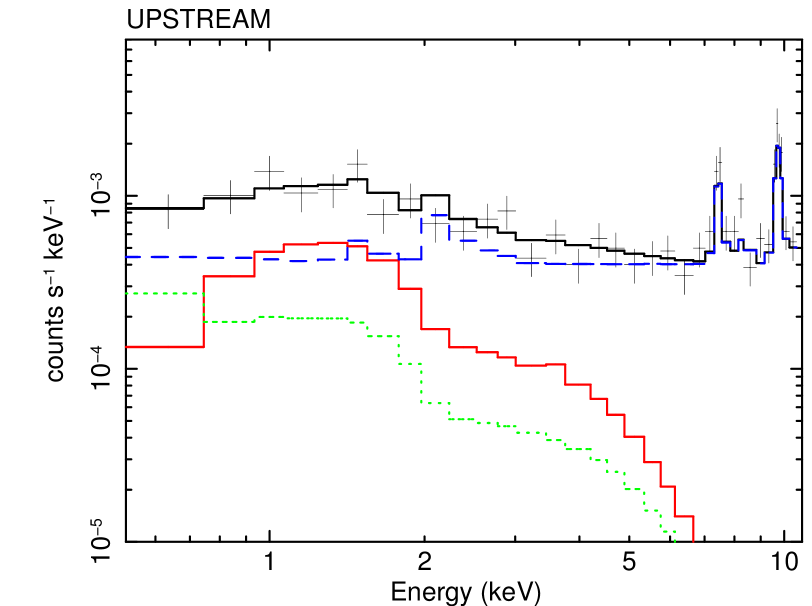
Shocks heat the downstream gas and this allows to distinguish them from cold
fronts, other kinds of SB discontinuities found in galaxy clusters with
inverted temperature jumps (e.g. Markevitch &
Vikhlinin, 2007). For
this reason we performed spectral analysis in the yellow sectors shown in
Fig. 1c. Spectra for sector 1+2 are reported in
Fig. 5. We found evidence of a very high downstream
temperature, , while only a lower limit to
the upstream one was obtained, . In principle, this is not
enough to confirm the shock nature of the discontinuity but, similarly to the E
shock in the ‘Bullet’ cluster (Shimwell
et al., 2015), the presence of a cold front
is very unlikely because it would imply a too high temperature ( ) at such a large cluster distance.
Although current data do not allow to measure a temperature jump at the
position of the shock, we can use the lower limit to such a jump to provide
independent constraints on the shock Mach number. According to RH conditions,
the upstream and downstream temperature are related by
| (3) |
which implies if we insert the upper
limit of and the lower limit on . We anticipate that this value is
consistent with the Mach number inferred from SB jump once systematic errors
are taken into account (see the following Section)
A visual inspection of Fig. 1a suggests the presence of a
drop in SB also at the position of the SE relic. A shock in this region is
expected due to the presence of the radio relic and in analogy with the
‘Bullet’ cluster (Markevitch
et al., 2002). However, current data do not allow
us to characterize statistically the SB drop because of the low X-ray counts in
this region. Nevertheless we found evidence for high temperature in the
putative downstream gas, in the yellow
sector in the SE (Fig. 3), somewhat supporting this
possibility. Since typical temperatures in cluster outskirts are of a
few keV, such an high would likely imply a
shock.
3.2.1 Systematic errors on X-ray analysis
| Sector | Radial range | |||||||||||||||
|---|---|---|---|---|---|---|---|---|---|---|---|---|---|---|---|---|
| 1 |
|
|
|
|
||||||||||||
| 2 |
|
|
|
|
||||||||||||
| 1+2 |
|
|
|
|
Results in the previous Section are based on measurements obtained for a
particular sector (1+2). This entirely covers the feature found in the
unshap-mask images (Fig. 2) and allows the best
characterization of the SB jump due to the statistics of the fit.
We checked the impact due to the choice of the SB extracting region in the
determination of the NW X-ray discontinuity and the resulting Mach number.
Firstly, we re-performed SB and spectral analysis by splitting the red and
yellow sectors of Fig. 3 in two sub-regions; the dashed
line distinguishes between sector 1 (OA: ), which
is oriented in the N direction, to sector 2 (OA:
), which is in the NW direction and better overlaps the
relic. In both
regions, the SB profile is well described by a compression factor , implying .
We then repeated the SB analysis by excluding data at and keeping the
discontinuity distance frozen at the values found in the radial
range. Although with a large error, spectral analysis allowed to constrain the
upstream temperature in sector 1, implying a 68% confidence interval estimate
for the Mach number (taking into account the
asymmetric errors on the two temperatures), whereas only lower limits to
can be obtained in sectors 1+2 and 2. The results of the fits obtained for the
three regions are summarized in Tab. 1.
Finally, we checked the variation on in sector
1+2 due to different shock curvature radii from the best fit value found in
Fig. 4 ( ). Results are reported
in Tab. 2 and the impact of on the shock
compression factor is presented in Fig. 6.
Spectral analysis requires a careful determination of the background sources
and its systematic uncertainties. In this respect, we varied background
normalization levels within and re-performed spectral fits. We
achieved results consistent with the reported cluster parameters within
. Nonetheless, we highlight that the measurement of high temperatures
is critical with Chandra given its low effective area at energies higher than
, in particular the estimated confidence range may not reflect
entirely the true statistical and systematic error range.
As a final test, a more complex model of a two-temperature
thermal plasma was adopted to fit the downstream spectra. In this case, the
high- component is not constrained while the low- component gives
unreasonably low temperatures (e.g. and
, for sector 1+2). As pointed out in the
case of the Coma cluster (Gastaldello
et al., 2015), the low- component mitigates
the fit residuals at low energy rather than describing a physical condition.
The high- spectral component instead supports the presence of a high
temperature plasma in the downstream region.
| 0.6 | 96.1/48 | ||
| 0.8 | 91.5/52 | ||
| 1.2 | 41.0/45 | ||
| 1.4 | 24.7/28 | ||
| 1.6 | 37.5/27 | ||
| 1.8 | 43.1/25 |

3.3 Constraints on the downstream magnetic field
Relativistic electrons scattering with the cosmic microwave
background (CMB) photons is expected to produce inverse Compton (IC)
emission. From the ratio between radio and X-ray emission it is possible to
constraints the magnetic field in the source region
(e.g. Blumenthal &
Gould, 1970). For this reason we preformed spectral analysis
in a region enclosing the NW relic and introduced, in addition to the canonical
thermal model for the ICM, a power-law in the spectral fit.
We assume that the IC spectrum is a power-law with photon index related to the
synchrotron spectral index via . Initially we set
(see Section 3.1) and kept it frozen in the fit
while thermal parameters were free to vary. In this case we obtain
0.5-2 upper limit to the non-thermal component
.
The IC measurement is a very complicated issue and can be influenced by several
factors. We investigated the impact on IC flux estimation by: using the IC
power-law slope in the range (consistently with the values
reported in Section 3.1), keeping the temperature frozen at 13.5
and 17 (which covers a range of obtained for
different sector choices in the relic region), varying background
normalization levels within
and re-performing the fits in the 0.7-11 and 0.9-11 energy bands.
In summary, we found upper limits in the range for the IC flux, representing
%
of the thermal model flux in the same energy band (0.5-2 ). However,
in the case of temperature frozen at 17 , the fits formally result in
a IC detection both for and 2.57; we do not consider these
detections solid enough due to the systematics related to the
presence of multi-temperature components and background characterization. We
further explore the
possibility of IC detection in Section 4.2.
By using our upper limits to IC flux, we conservatively
obtained222Calculations were obtained using Eq. 32 in
Brunetti &
Jones (2014). the following lower limits to the downstream magnetic
field strength: for , for and for . These
values are in line with other estimates for radio relics
(e.g. Bonafede et al., 2009; Finoguenov et al., 2010; van Weeren et al., 2010; van Weeren
et al., 2011b).
3.4 Acceleration efficiency
The relic–shock connection is nowadays supported by many observational
studies. Nevertheless, theoretical models of relic formation are challenged by
the low Mach numbers associated with cluster shocks. In fact, the commonly
adopted diffusive shock acceleration (DSA) model is severely challenged for
weak shocks if CRe are accelerated by the thermal pool (e.g. Brunetti &
Jones, 2014, for
review). A connected problem is the ratio of cosmic ray protons
and electrons that would be generated at these shocks and that current
-ray Fermi limits constrain at values that are significantly smaller
than that in supernova remnants (e.g. Vazza
et al., 2015; Vazza et al., 2016).
If the downstream synchrotron luminosity emitted at frequency
originates from electrons in steady state conditions, the bolometric () synchrotron luminosity that is generated via shock acceleration from a
shock with speed and surface can be estimated as
| (4) |
where is the efficiency of electron acceleration,
| (5) |
accounts for the ratio of the energy flux injected in “all” electrons and those visible in the radio band (), is the momentum of the relativistic electrons emitting the synchrotron frequency in a magnetic field and accounts for IC scattering of CMB photons. The injection spectrum of accelerated CRe is given by
| (6) |
where is the spectrum of seed particles upstream. In the case of CRe
acceleration from the thermal pool this is ,
where , implying a
synchrotron spectral index in the case of steady state
conditions (e.g. Blandford &
Eichler, 1987).
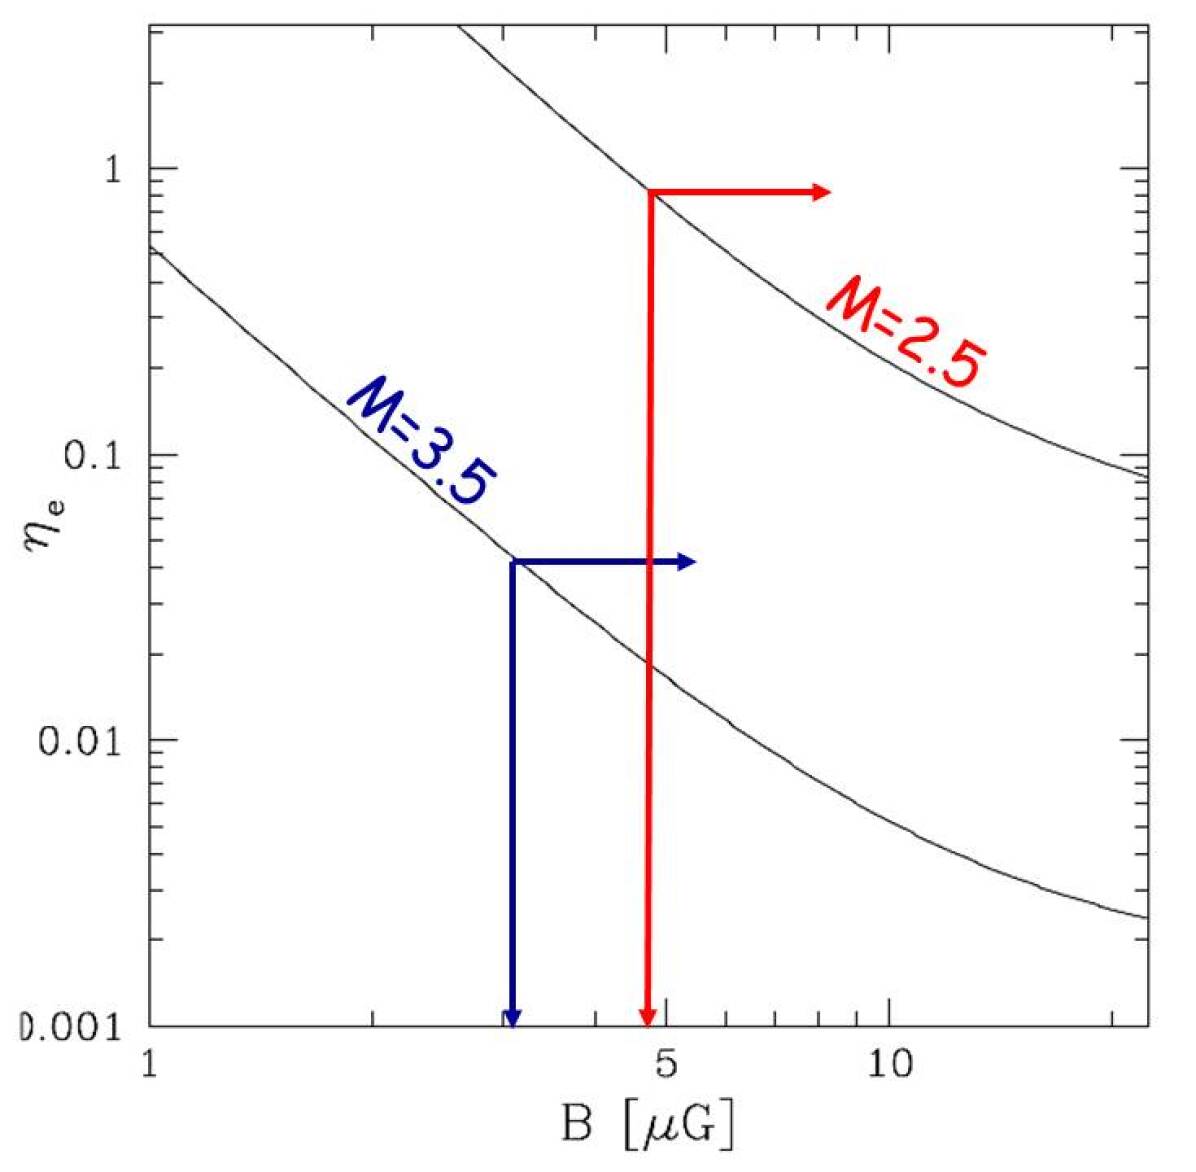
In Fig. 7 we report the acceleration efficiency that is necessary
to explain the radio luminosity observed in the NW relic assuming DSA of
thermal electrons upstream.
We assumed shock Mach numbers and 2.5, in line with the
values derived from the X-ray analysis. These Mach numbers would imply a
synchrotron spectrum of the relic and , respectively,
that are in line with radio measurements (Section 3.1).
Calculations were obtained assuming upstream number density and temperature
and 6.1 , respectively, and a
surface of the relic .
In Fig. 7 we also show the lower limits to the magnetic field in
the relic that are derived from the upper limits to the IC flux assuming the
two values of the spectral index (Section 3.3).
Despite we are dealing with a high-velocity shock, , we note that the efficiency of CRe acceleration that
is requested to explain the radio relic is large. This is due to the fact that
the NW relic in the ‘El Gordo’ is one of the most luminous radio relics known
so
far and because, for few magnetic fields, most of the CRe energy
is radiated via IC emission (due to the high redshift of the cluster). Still,
contrary to the case of weaker shocks (see e.g. A754, Macario et al. 2011; 1RXS
J0603.3+4214, van Weeren
et al. 2016; A115, Botteon et al. 2016), we
conclude that in this case DSA of thermal electrons is still a viable option.
Indeed for Mach number the electron acceleration efficiency appears
energetically viable , whereas for
additional mechanisms of pre-acceleration of thermal electrons downstream
(see Guo
et al. 2014a, b) may be required.
The other possibility is that the NW relic is due to shock re-acceleration of
seeds (relativistic or supra-thermal) electrons. In this case the efficiency
necessary to explain the radio emission is much smaller simply because the bulk
of the energy is channelled directly into highly relativistic particles
(Eq. 6, e.g. Markevitch et al. 2005; Kang
et al. 2012). Seeds can be broadly
distributed in the cluster outskirts where the life time of 100
electrons is very long (e.g. Pinzke
et al. 2013; Donnert et al. 2016)
or they can be in radio ghost/clouds generated by past AGN activity
(e.g. Kang & Ryu, 2016). The two possibilities have different predictions
on the upstream synchrotron emission that in principle can be tested with very
deep radio observations, but that are well beyond the aim of our paper.
4 Discussion
4.1 Overall considerations
‘El Gordo’ is a high redshift (, Menanteau
et al. 2012) and high mass
( , Planck
Collaboration et al. 2014) galaxy
cluster. It is the most
distant massive cluster with the brightest X-ray and SZ emission and the
farthest hosting diffuse radio sources (halo and relics). Our study makes it
is also the most distant cluster where a shock (with one of the highest
Mach number) has been detected.
Optical and X-ray observations revealed that ‘El Gordo’ is in a merging state
(Menanteau
et al., 2010, 2012). Recent numerical simulations were able to
reproduce the overall system properties assuming a nearly head on major merger
(Donnert, 2014; Molnar &
Broadhurst, 2015; Zhang
et al., 2015; Ng et al., 2015).
Double relic systems are expected to trace shocks moving outwards in cluster
outskirts. So far, studies on ‘El Gordo’ were mainly focused on the SE relic
located in front of the dense cool core, which is expected to follow a shock in
analogy with the well know ‘Bullet’ cluster case (Markevitch
et al., 2002).
However, current X-ray data do not allow to characterize the jump in this
region
because of the low statistics. We instead discovered a
shock spatially coincident with the NW relic. Our detection is based on the
Chandra SB jump. Although with large uncertainties, spectral analysis
is also consistent with the presence of a strong shock in the ICM. Further
indications of the shock are given by the unsharp-masked images of
Fig. 2. We also mention the striking similarity between ‘El
Gordo’ shock/reverse-shock and X-ray morphology with A2146 (Russell et al., 2010; Russell
et al., 2012) even though the latter is a less massive system
( , Planck
Collaboration et al. 2014) and does
not host any radio relics at the sensitivity level of current observations
(Russell
et al., 2011).
4.2 Hints of inverse Compton emission?

The search for IC emission from galaxy clusters has been undertaken for many
years with many instruments. However, no confirmed detection has been obtained
so far. The most famous dispute in this field regards the case of the nearby
Coma cluster (Rephaeli
et al., 1999; Rephaeli &
Gruber, 2002; Fusco-Femiano
et al., 1999; Fusco-Femiano et al., 2004, 2007; Rossetti &
Molendi, 2004; Wik et al., 2009, 2011; Gastaldello
et al., 2015). The excellent spatial resolution and
good spectral capabilities of the Chandra satellite allow to minimize the
contamination from the thermal X-ray emission and open to the possibility to
search for non-thermal emission also in the soft X-ray band
(e.g. Million &
Allen, 2009).
‘El Gordo’ is a perfect target to search for IC emission. It hosts a bright
radio relic in an external region with low thermal SB and it is at high
redshift (), where the equivalent CMB magnetic field strength is large,
.
We used the deep Chandra observations to look for IC signatures in the NW
relic (Section 3.3). In the case the temperature is frozen at
17 , the spectral analysis provides a formal detection and a
significant fraction (up to %) of the X-ray brightness across a relic
would be contributed by IC emission from the relic itself. This should be
visible in the X-ray images and profiles across the relic. For this reason we
extracted a SB profile in the 0.5-2.0 across a narrow sector (OA:
) containing the NW radio relic. The fit of a
broken power-law model (Eq. 1) in this restricted region
provides a good description of the SB jump, as shown in Fig. 8
(dashed red line), leading to . However, a SB
excess is present in the region of the relic. For this reason we also
attempt to fit the SB by adding a Gaussian component to the downstream
power-law. The addition of this Gaussian improves the fit
(Fig. 8, solid blue line) with .
Slight different sector centers and apertures do not influence this excess. The
Gaussian component coincident with the relic could represent an excess due to
IC emission from electrons in the relic. The excess flux associated with the
Gaussian component is in line with that expected from the spectral analysis.
The
combination of this excess with the formal detection of IC emission obtained
from the spectral analysis (with frozen) is tantalizing, however deeper
observations (i.e. ) are required to firmly conclude about this
possible detection.
5 Conclusions
We presented an X-ray/radio study of the famous ‘El Gordo’ cluster located at
focusing on the non-thermal activity in the cluster.
Our GMRT radio observations at 610 and 327 confirmed the presence of
a halo and a system of double relics. These represent the most distant diffuse
radio sources detected in a galaxy cluster so far. The halo is quite elongated
in the NW-SE, i.e. in the merger direction, and remarkably follows the ICM
emission of the northern X-ray tail. The two relics are found at the boundaries
of the X-ray emission. We focused on the NW relic which has a synchrotron
spectral index between 610 and 327 .
The deep Chandra observations (340 ) allowed us to discover a shock
at the position of the NW relic. The SB profile
taken is this region abruptly drops at the relic location. The density
compression factor and the high downstream temperature
provide the indication of a strong shock () in the ICM.
This is one of the three strongest shocks detected in galaxy clusters and the
most distant () observed so far.
The detection of a shock co-spatially located with a relic strongly supports
the relic–shock connection. The NW shock in ‘El Gordo’ cluster allows to study
particle acceleration in a rare regime of strong shock. We found that DSA of
thermal electrons is consistent with measured synchrotron spectrum.
Nonetheless, only shocks with appear energetically viable
while for weaker shocks re-acceleration models would be preferred.
The presence of relativistic particles emitting a bright synchrotron relic at
makes ‘El Gordo’ a suitable cluster candidate to search for IC
emission from the relic. From the X-ray spectral analysis we obtained possible
hints for IC emission from the relic, however we could not firmly
conclude the presence of IC excess and conservatively we derived only lower
limits to the downstream magnetic field that have been used to improve
constraints on particle acceleration. However, we also found hints of
an excess in the 0.5-2 SB profile across the relic region.
The combination of a possible IC excess in the spectral analysis with the hints
of excess in the SB is tantalizing and certainly deserves deeper Chandra observations.
Acknowledgments
We thank the anonymous referee for the useful comments on the manuscript. We thank Dominique Eckert for his help with the PROFFIT SB analysis. The scientific results reported in this article are based on observations made by the Chandra X-ray Observatory. We thank the staff of the GMRT who have made these observations possible. GMRT is run by the National Centre for Radio Astrophysics of the Tata Institute of Fundamental Research. AB and GB acknowledge partial support from PRIN-INAF 2014. RK acknowledges support through the DST-INSPIRE Faculty Award.
References
- Akamatsu & Kawahara (2013) Akamatsu H., Kawahara H., 2013, PASJ, 65, 16
- Anders & Grevesse (1989) Anders E., Grevesse N., 1989, GeCoA, 53, 197
- Bartalucci et al. (2014) Bartalucci I., Mazzotta P., Bourdin H., Vikhlinin A., 2014, A&A, 566, A25
- Blandford & Eichler (1987) Blandford R., Eichler D., 1987, Phys. Rep., 154, 1
- Blumenthal & Gould (1970) Blumenthal G., Gould R., 1970, Rev. Mod. Phys., 42, 237
- Bonafede et al. (2009) Bonafede A., Giovannini G., Feretti L., Govoni F., Murgia M., 2009, A&A, 494, 429
- Botteon et al. (2016) Botteon A., Gastaldello F., Brunetti G., Dallacasa D., 2016, MNRAS, 460, L84
- Bourdin et al. (2013) Bourdin H., Mazzotta P., Markevitch M., Giacintucci S., Brunetti G., 2013, ApJ, 764, 82
- Brüggen et al. (2012) Brüggen M., Bykov A., Ryu D., Röttgering H., 2012, Space Sci. Rev., 166, 187
- Brunetti & Jones (2014) Brunetti G., Jones T., 2014, Int. J. Mod. Phys. D, 23, 30007
- Dasadia et al. (2016) Dasadia S., et al., 2016, ApJ, 820, L20
- Donnert (2014) Donnert J., 2014, MNRAS, 438, 1971
- Donnert et al. (2016) Donnert J., Stroe A., Brunetti G., Hoang D., Roettgering H., 2016, preprint (arXiv:1603.06570)
- Eckert et al. (2011) Eckert D., Molendi S., Paltani S., 2011, A&A, 526, A79
- Eckert et al. (2016) Eckert D., Jauzac M., Vazza F., Owers M., Kneib J.-P., Tchernin C., Intema H., Knowles K., 2016, MNRAS, 461, 1302
- Feretti et al. (2012) Feretti L., Giovannini G., Govoni F., Murgia M., 2012, A&A Rev., 20, 54
- Finoguenov et al. (2010) Finoguenov A., Sarazin C., Nakazawa K., Wik D., Clarke T., 2010, ApJ, 715, 1143
- Fusco-Femiano et al. (1999) Fusco-Femiano R., Dal Fiume D., Feretti L., Giovannini G., Grandi P., Matt G., Molendi S., Santangelo A., 1999, ApJ, 513, L21
- Fusco-Femiano et al. (2004) Fusco-Femiano R., Orlandini M., Brunetti G., Feretti L., Giovannini G., Grandi P., Setti G., 2004, ApJ, 602, L73
- Fusco-Femiano et al. (2007) Fusco-Femiano R., Landi R., Orlandini M., 2007, ApJ, 654, L9
- Gastaldello et al. (2015) Gastaldello F., et al., 2015, ApJ, 800, 139
- Guo et al. (2014a) Guo X., Sironi L., Narayan R., 2014a, ApJ, 794, 153
- Guo et al. (2014b) Guo X., Sironi L., Narayan R., 2014b, ApJ, 797, 47
- Kang & Ryu (2016) Kang H., Ryu D., 2016, ApJ, 823, 13
- Kang et al. (2012) Kang H., Ryu D., Jones T., 2012, ApJ, 756, 97
- Kang et al. (2014) Kang H., Petrosian V., Ryu D., Jones T., 2014, ApJ, 788, 142
- Lindner et al. (2014) Lindner R., et al., 2014, ApJ, 786, 49
- Macario et al. (2011) Macario G., Markevitch M., Giacintucci S., Brunetti G., Venturi T., Murray S., 2011, ApJ, 728, 82
- Markevitch (2006) Markevitch M., 2006, in Wilson A., ed., ESA Special Publication Vol. 604, X-ray Universe 2005. p. 723
- Markevitch & Vikhlinin (2007) Markevitch M., Vikhlinin A., 2007, Phys. Rep., 443, 1
- Markevitch et al. (2002) Markevitch M., Gonzalez A., David L., Vikhlinin A., Murray S., Forman W., Jones C., Tucker W., 2002, ApJ, 567, L27
- Markevitch et al. (2005) Markevitch M., Govoni F., Brunetti G., Jerius D., 2005, ApJ, 627, 733
- Marriage et al. (2011) Marriage T., et al., 2011, ApJ, 737, 61
- Menanteau et al. (2010) Menanteau F., et al., 2010, ApJ, 723, 1523
- Menanteau et al. (2012) Menanteau F., et al., 2012, ApJ, 748, 7
- Million & Allen (2009) Million E., Allen S., 2009, MNRAS, 399, 1307
- Molnar & Broadhurst (2015) Molnar S., Broadhurst T., 2015, ApJ, 800, 37
- Ng et al. (2015) Ng K., Dawson W., Wittman D., Jee M., Hughes J., Menanteau F., Sifón C., 2015, MNRAS, 453, 1531
- Pinzke et al. (2013) Pinzke A., Oh S., Pfrommer C., 2013, MNRAS, 435, 1061
- Planck Collaboration et al. (2014) Planck Collaboration et al., 2014, A&A, 571, A29
- Press & Schechter (1974) Press W., Schechter P., 1974, ApJ, 187, 425
- Rephaeli & Gruber (2002) Rephaeli Y., Gruber D., 2002, ApJ, 579, 587
- Rephaeli et al. (1999) Rephaeli Y., Gruber D., Blanco P., 1999, ApJ, 511, L21
- Rossetti & Molendi (2004) Rossetti M., Molendi S., 2004, A&A, 414, L41
- Russell et al. (2010) Russell H., Sanders J., Fabian A., Baum S., Donahue M., Edge A., McNamara B., O’Dea C., 2010, MNRAS, 406, 1721
- Russell et al. (2011) Russell H., et al., 2011, MNRAS, 417, L1
- Russell et al. (2012) Russell H., et al., 2012, MNRAS, 423, 236
- Shimwell et al. (2015) Shimwell T., Markevitch M., Brown S., Feretti L., Gaensler B., Johnston-Hollitt M., Lage C., Srinivasan R., 2015, MNRAS, 449, 1486
- Vazza et al. (2015) Vazza F., Eckert D., Brüggen M., Huber B., 2015, MNRAS, 451, 2198
- Vazza et al. (2016) Vazza F., Brüggen M., Wittor D., Gheller C., Eckert D., Stubbe M., 2016, MNRAS, 459, 70
- Vikhlinin et al. (2001) Vikhlinin A., Markevitch M., Murray S., 2001, ApJ, 551, 160
- Wik et al. (2009) Wik D., Sarazin C., Finoguenov A., Matsushita K., Nakazawa K., Clarke T., 2009, ApJ, 696, 1700
- Wik et al. (2011) Wik D., Sarazin C., Finoguenov A., Baumgartner W., Mushotzky R., Okajima T., Tueller J., Clarke T., 2011, ApJ, 727, 119
- Zhang et al. (2015) Zhang C., Yu Q., Lu Y., 2015, ApJ, 813, 129
- de Gasperin et al. (2014) de Gasperin F., van Weeren R., Brüggen M., Vazza F., Bonafede A., Intema H., 2014, MNRAS, 444, 3130
- van Weeren et al. (2010) van Weeren R., Röttgering H., Brüggen M., Hoeft M., 2010, Science, 330, 347
- van Weeren et al. (2011a) van Weeren R., Brüggen M., Röttgering H., Hoeft M., 2011a, MNRAS, 418, 230
- van Weeren et al. (2011b) van Weeren R., Hoeft M., Röttgering H., Brüggen M., Intema H., van Velzen S., 2011b, A&A, 528, A38
- van Weeren et al. (2016) van Weeren R., et al., 2016, ApJ, 818, 204