CNRS, IPAG, F-38000 Grenoble, France 3333institutetext: Department of Physics and Astronomy, The University of Leicester, University Road, Leicester, LE1 7RH, United Kingdom 3434institutetext: Nicolaus Copernicus Astronomical Center, ul. Bartycka 18, 00-716 Warsaw, Poland 3535institutetext: Institut für Physik und Astronomie, Universität Potsdam, Karl-Liebknecht-Strasse 24/25, D 14476 Potsdam, Germany 3636institutetext: Universität Erlangen-Nürnberg, Physikalisches Institut, Erwin-Rommel-Str. 1, D 91058 Erlangen, Germany 3737institutetext: DESY, D-15738 Zeuthen, Germany 3838institutetext: Obserwatorium Astronomiczne, Uniwersytet Jagielloński, ul. Orla 171, 30-244 Kraków, Poland 3939institutetext: Centre for Astronomy, Faculty of Physics, Astronomy and Informatics, Nicolaus Copernicus University, Grudziadzka 5, 87-100 Torun, Poland 4040institutetext: Department of Physics, University of the Free State, PO Box 339, Bloemfontein 9300, South Africa 4141institutetext: Heisenberg Fellow (DFG), ITA Universität Heidelberg, Germany 4242institutetext: GRAPPA, Institute of High-Energy Physics, University of Amsterdam, Science Park 904, 1098 XH Amsterdam, The Netherlands 4343institutetext: University of Durham, Department of Physics, South Road, Durham DH1 3LE, UK 4444institutetext: Iowa State University, Ames, USA
A search for very high-energy flares from the microquasars GRS 1915+105, Circinus X-1, and V4641 Sgr using contemporaneous H.E.S.S. and RXTE observations
Abstract
Context. Microquasars are potential -ray emitters. Indications of transient episodes of -ray emission were recently reported in at least two systems: Cyg X-1 and Cyg X-3. The identification of additional -ray-emitting microquasars is required to better understand how -ray emission can be produced in these systems.
Aims. Theoretical models have predicted very high-energy (VHE) -ray emission from microquasars during periods of transient outburst. Observations reported herein were undertaken with the objective of observing a broadband flaring event in the -ray and X-ray bands.
Methods. Contemporaneous observations of three microquasars, GRS 1915+105, Circinus X-1, and V4641 Sgr, were obtained using the High Energy Spectroscopic System (H.E.S.S.) telescope array and the Rossi X-ray Timing Explorer (RXTE) satellite. X-ray analyses for each microquasar were performed and VHE -ray upper limits from contemporaneous H.E.S.S. observations were derived.
Results. No significant -ray signal has been detected in any of the three systems. The integral -ray photon flux at the observational epochs is constrained to be cm-2 s-1, cm-2 s-1, and cm-2 s-1 for GRS 1915+105, Circinus X-1, and V4641 Sgr, respectively.
Conclusions. The -ray upper limits obtained using H.E.S.S. are examined in the context of previous Cherenkov telescope observations of microquasars. The effect of intrinsic absorption is modelled for each target and found to have negligible impact on the flux of escaping -rays. When combined with the X-ray behaviour observed using RXTE, the derived results indicate that if detectable VHE -ray emission from microquasars is commonplace, then it is likely to be highly transient.
Key Words.:
gamma rays: observations, H.E.S.S. - X-rays: binaries, RXTE - individual objects: GRS 1915+105, V4641 Sgr, Circinus X-1;
⋆ corresponding authors
1 Introduction
Microquasars are X-ray binaries that exhibit spatially resolved, extended radio emission. The nomenclature is motivated by a structural similarity with the quasar family of active galactic nuclei (AGN). Both object classes are believed to comprise a compact central object embedded in a flow of accreting material, and both exhibit relativistic, collimated jets. In the current paradigm, both microquasars and AGN derive their power from the gravitational potential energy that is liberated as ambient matter falls onto the compact object. Notwithstanding their morphological resemblance, microquasars and radio-loud AGN represent complementary examples of astrophysical jet production on dramatically disparate spatial and temporal scales. Indeed, conditions of accretion and mass provision that pertain to the supermassive () black holes that power AGN and of the stellar-mass compact primaries of microquasars are markedly different. In the latter, a companion star (or donor) provides the reservoir of matter for accretion onto a compact stellar remnant (or primary), which can be either a neutron star or a black hole. Partial dissipation of the resultant power output occurs in a disk of material surrounding the primary, producing the thermal and non-thermal X-ray emission, which is characteristic of all X-ray binary systems. Microquasars are segregated on the basis of associated non-thermal radio emission, indicative of synchrotron radiation in a collimated outflow, which carries away a sizeable fraction of the accretion luminosity (Fender et al., 2004b). In AGN, superficially similar jet structures are known to be regions of particle acceleration and non-thermal photon emission. The resulting radiation spectrum can extend from radio wavelengths into the very high-energy (VHE; GeV) -ray regime. Very high-energy -ray emission has been observed from many AGN in the blazar sub-class111 http://tevcat.uchicago.edu/, where the jet axis is aligned close to the observer line-of-sight, as well as from a few radio galaxies (e.g. M87, Aharonian et al., 2003; Cen A, Aharonian et al., 2009; NGC 1275, Aleksić et al., 2012) and starburst galaxies (e.g. M82, Acciari et al., 2009; NGC 253, Abramowski et al., 2012).
If similar jet production and efficient particle acceleration mechanisms operate in microquasars and AGNs, this might imply that the former object class are plausible sources of detectable VHE -ray emission as well, assuming that appropriate environmental conditions prevail. The primarily relevant environmental conditions include the density of nearby hadronic material, which provides scattering targets for inelastic proton scattering interactions; these interactions produce pions that produce -rays when they subsequently decay. The ambient magnetic field strength is also important and influences the rate at which electrons lose energy via synchrotron radiation. Synchrotron photons contribute to the reservoir of soft photons that are available for inverse Compton (IC) up-scattering into the VHE -ray regime. The argument for phenomenological parity between AGN and microquasars, possibly related to their structural resemblance, has been strengthened in recent years as the spectral properties of both radio and X-ray emission are remarkably similar for both stellar mass and supermassive black holes. In recent years these similarities led to the postulation of a so-called fundamental plane, which describes a three-dimensional, phenomenological correlation between the radio (5 GHz) and X-ray (2–10 keV) luminosities and the black hole mass (Merloni et al., 2003; Falcke et al., 2004). However, the fundamental plane does not appear to extend into the TeV band. To date, only one well-established microquasar has been observed to emit in the VHE -ray regime. This is the Galactic black hole Cygnus X-1, which was marginally detected (at the level) by the MAGIC telescope immediately prior to a keV X-ray flare observed by the INTEGRAL satellite, the Swift Burst Alert Telescope (BAT), and the RXTE All-Sky Monitor (ASM) (Albert et al., 2007; Malzac et al., 2008). Laurent et al. (2011) recently identified linear polarized soft -ray emission from Cygnus X-1 (see also Jourdain et al., 2012), thereby locating the emitter within the jets and identifying their capacity to accelerate particles to high energies (see however Romero et al., 2014). Further motivation for observing microquasars in the VHE band arises from the recent identification of the high-mass microquasar Cygnus X-3 as a transient high-energy (HE; 100MeV 100 GeV) -ray source by the Fermi (Fermi LAT Collaboration et al., 2009) and AGILE (Tavani et al., 2009) satellites. The identification of a periodic modulation of the HE signal is consistent with the orbital frequency of Cygnus X-3 and provides compelling evidence for effective acceleration of charged particles to GeV energies within the binary system (Fermi LAT Collaboration et al., 2009). Based on evidence from subsequent reobservations, the HE -ray flux from Cygnus X-3 appears to be correlated with transitions observed in X-rays in and out of the so-called ultra-soft state, which exhibits bright soft X-ray emission and low fluxes in hard X-rays and is typically associated with contemporaneous radio flaring activity (e.g. Corbel et al., 2012). Unfortunately, repeated observations of Cygnus X-3 using the MAGIC telescope did not yield a significant detection (Aleksić et al., 2010), despite the inclusion of data that were obtained simultaneously with the periods of enhanced HE emission detected using Fermi. However, the intense optical and ultraviolet radiation fields produced by the Wolf-Rayet companion star in Cygnus X-3 imply a large optical depth for VHE -rays due to absorption via pair production (e.g. Bednarek, 2010; Zdziarski et al., 2012). Accordingly, particle acceleration mechanisms akin to those operating in Cygnus X-3 may yield detectable VHE -ray fluxes in systems with fainter or cooler donors.
Mechanisms for -ray production in microquasars have been widely investigated, resulting in numerous hadronic (see e.g. Romero et al., 2003) and leptonic (see e.g. Atoyan & Aharonian, 1999; Georganopoulos et al., 2002; Bosch-Ramon et al., 2006; Dermer & Böttcher, 2006; Dubus et al., 2010) models, describing the expected fluxes and spectra of microquasars in the GeV-TeV band. In both scenarios, a highly energetic population of the relevant particles is required and, consequently, emission scenarios generally localize the radiating region within the jet structures of the microquasar. Leptonic models rely upon IC scattering of photons from the primary star in the binary system or photons produced through synchrotron emission along the jet to produce VHE -ray emission. In this latter scenario, they closely resemble models of extragalactic jets (Königl, 1981; Ghisellini & Maraschi, 1989), but typically invoke internal magnetic fields that are stronger by factors . Consideration of hadronic models is motivated by the detection of Doppler-shifted emission lines associated with the jets of the microquasar SS 433 (e.g. Margon, 1984), indicating that at least some microquasar jets comprise a significant hadronic component. Models of VHE -ray production by hadronic particles generally invoke electromagnetic cascades initiated by both neutral and charged pion decays (Romero et al., 2003; Aharonian & Atoyan, 1996; Romero et al., 2005).
Electron-positron pair production, can absorb VHE -rays . In the case of 1 TeV -rays, the cross section for this process is maximised for ultraviolet target photons ( eV), where its value may be approximated in terms of the Thomson cross section as (e.g. Gould & Schréder, 1967). In high-mass systems, the companion star is expected to produce a dense field of these target photons to interact with the -rays (e.g. Protheroe & Stanev, 1987; Moskalenko, 1995; Böttcher & Dermer, 2005; Dubus, 2006). This process can be very significant and probably contributes to the observed orbital modulation in the VHE -ray flux from LS 5039 (Aharonian et al., 2006c). In contrast, the ultraviolet spectrum of low-mass microquasars is likely dominated by the reprocessing of X-ray emission in the cool outer accretion flow (van Paradijs & McClintock, 1994; Gierliński et al., 2009), although jet emission might also be significant (Russell et al., 2006). Regardless of their origin, the observed optical and ultraviolet luminosities of low-mass X-ray binaries (LMXBs) are generally orders of magnitude lower than those of high-mass systems (Russell et al., 2006), and the likelihood of strong -ray absorption is correspondingly reduced.
However, microquasars may only become visible in the TeV band during powerful flaring events. These transient outbursts, characterised by the ejection of discrete superluminal plasma clouds, are usually observed at the transition between low- and high-luminosity X-ray states (Fender et al., 2004b). Monitoring black-hole X-ray binaries with radio telescopes and X-ray satellites operating in the last decade enabled a classification scheme of such events to be established (Homan & Belloni, 2005). Hardness-intensity diagrams (HIDs) plot the source X-ray intensity against X-ray colour (or hardness) and have subsequently been extensively used to study the spectral evolution of black-hole outbursts. At the transition from the so-called low-hard state to the high-soft states through the hard-to-soft intermediate states, the steady jet associated with the low-hard state is disrupted. These transient ejections, produced once the accretion disk collapses inwards, are more relativistic than the steady low-hard jets (Fender et al., 2004b). Internal shocks can develop in the outflow, possibly accelerating particles that subsequently give rise to radio optically thin flares observed from black-hole systems; this phenomenological description is also extensible to neutron stars, although in that case jet radio power is lower by a factor 5–30 (Migliari & Fender, 2006).
Outburst episodes have also been observed in cases in which the source remained in the hard state without transition to the soft state (Homan & Belloni, 2005). The detection (at the level) by the MAGIC telescope of the high-mass, black-hole binary Cygnus X-1 took place during an enhanced keV flux low-hard state as observed with the INTEGRAL satellite, the Swift BAT, and the RXTE ASM (Malzac et al., 2008). However, although the source X-ray spectrum remained unchanged throughout the TeV flare, such a bright hard state was unusually long when compared with previous observations of the source.
Here we report on contemporaneous observations with H.E.S.S. and RXTE of the three microquasars V4641 Sgr, GRS 1915+105, and Circinus X-1. Information on the targets, the H.E.S.S. and RXTE observations, and the corresponding trigger conditions are detailed in Sect. 2. Analysis results are reported in Sect. 3 and discussed in Sect. 4. In the appendix, detailed information on the X-ray analysis is reported, which in particular includes HIDs corresponding to the time of observations for the three studied sources.
2 Targets and observations
2.1 Observations
The H.E.S.S. Imaging Atmospheric Cherenkov Telescope (IACT) array is situated on the Khomas Highland plateau of Namibia (23 south, east), at an elevation of 1800 m above sea level, and is capable of detecting a Crab-like source close to the zenith at the 5 level within minutes under good observational conditions (Aharonian et al., 2006a). The point source sensitivity of H.E.S.S. enables it to detect a -ray flux above 1 TeV, at the 5 level within 25 hours, which, together with a low-energy threshold (100 GeV), makes H.E.S.S. an invaluable instrument for studying the VHE -ray emission from microquasars. A fifth and larger telescope (commissioned in 2013) will allow the energy threshold to be lowered and will further increase the sensitivity of the instrument. For the analysis presented here, H.E.S.S. observations were carried out using the full, original four-telescope array. Owing to the diverse morphologies of the three binary systems, unique observational trigger criteria were established for each target employing various combinations of the observed X-ray state and radio flaring activity. Details are provided in subsequent paragraphs.
The Rossi X-ray Timing Explorer (RXTE) was a space-based X-ray observatory launched on 30 December 30 1995 and decommissioned on 5 January 2012. The primary mission of RXTE was to provide astrophysical X-ray data with high timing resolution. This observatory occupied a circular low-earth orbit with an orbital period of minutes and carried three separate X-ray telescopes. The Proportional Counter Array (PCA) on board RXTE comprised five copointing xenon and propane Proportional Counter Units (PCUs), which were nominally sensitive in the energy range keV with an energy resolution of at 6 keV (Zhang et al., 1993). For studies of rapidly varying sources like X-ray binaries, the PCA timing resolution of s can prove invaluable. However, rapid timing measurements also require a bright source to provide sufficient counting statistics within such short time bins. The High Energy X-ray-Timing Experiment (HEXTE) comprised two independent clusters of four phoswich scintillation detectors, which were sensitive to photons in the keV energy range and had an energy resolution of keV at 60 keV. The maximum timing resolution of HEXTE was s. The All-Sky Monitor (ASM) was a wide field-of-view instrument that monitored of the sky over the course of each minute orbit. This instrument consisted of three identical scanning shadow cameras and was designed to provide near-continuous monitoring of bright X-ray sources. Nominally, the ASM was sensitive in the energy range from keV and had a rectangular field of view spanning .
Contemporaneous X-ray (RXTE) and VHE -ray (H.E.S.S.) observations were performed at the epochs listed in Table 2. In the following, we briefly review the observational characteristics of the target microquasars, GRS 1915+105, Circinus X-1, and V4641 Sgr. Established system parameters that characterise the three target microquasars are collated in Table 1.
| GRS 1915+105 | Circinus X-1 | V4641 Sgr | |
|---|---|---|---|
| [d] | (1) | 16.6 (2) | 2.82 (3) |
| (1) | (5) | (10) | |
| (4) | |||
| (6) | (8) | (10) | |
| (6) | (9) | (3) | |
| [kpc] | (6,7) | (9) | (10) |
| Target | RXTE ObsId | RXTE Observations (MJD) | H.E.S.S. Observations (MJD) |
|---|---|---|---|
| GRS 1915+105 | 90108-01-01-00 | 53123.091 53123.109 | 53123.067 53123.150 |
| 90108-01-02-00 | 53124.074 53124.094 | 53124.079 53124.162 | |
| 90108-01-03-00 | 53125.130 53125.149 | 53125.083 53125.148 | |
| 90108-01-04-00 | 53126.114 53126.129 | 53126.109 53126.132 | |
| 90108-01-05-00 | 53127.097 53127.114 | 53127.106 53127.165 | |
| 90108-01-06-00 | 53128.150 53128.165 | 53128.149 53128.165 | |
| Cir X-1 | 90124-02-01-00 | 53174.749 53174.761 | 53174.748 53174.832 |
| 90124-02-02-00 | 53175.768 53175.780 | 53175.735 53175.822 | |
| 90124-02-03-00 | 53176.781 53176.793 | 53176.772 53176.858 | |
| V4641 Sgr | 90108-03-01-00 | 53193.904 53193.924 | Not Observed |
| 90108-03-02-00 | 53194.887 53194.908 | 53194.883 53194.926 | |
| 90108-03-03-00 | 53195.871 53195.892 | 53195.890 53195.931 |
2.2 GRS 1915+105
GRS 1915+105 is a dynamically established black-hole binary first identified by the WATCH all-sky monitor on board the GRANAT satellite (Castro-Tirado et al., 1994). Observations in the optical and near-infrared using the Very Large Telescope succeeded in identifying the stellar companion as a low-mass KM III giant (Greiner et al., 2001). GRS 1915+105 gained a measure of celebrity as the prototype Galactic superluminal source (Mirabel & Rodriguez, 1994).
In a detailed study of the X-ray light curves of GRS 1915+105, Belloni et al. (2000) succeeded in identifying 12 distinct variability classes, internally characterised by the duration and juxtaposition of three separate spectral states. Episodes of class behaviour, belonging to state C and lasting several days, are known as plateaux and are invariably terminated by flaring activity in the radio, infrared, and X-ray bands (Fender & Belloni, 2004). In contrast with the evidence for self-absorbed synchrotron radiation seen in the spectrally hard, low-luminosity state C, and often associated with continuous relativistic jets (Klein-Wolt et al., 2002), radio spectra obtained during the end-plateau flaring episodes indicate optically thin synchrotron emission (Fender et al., 1997; Eikenberry et al., 1998). Occasionally, these flaring episodes are linked to powerful discrete plasma ejections with instantaneous power output reaching erg s-1 (Mirabel & Rodriguez, 1994; Zdziarski, 2014). Modelling the emission from these discrete relativistic ejecta, Atoyan & Aharonian (1999) showed that inverse Comptonisation of emitted synchrotron photons into the GeV-TeV regime could produce significant and persistent -ray fluxes that remain detectable for several days.
Acero et al. (2009) and Saito et al. (2009) reported VHE -ray observations of GRS 1915+105; these authors derived integral flux upper limits of cm-2s-1 above 410 GeV and cm-2s-1 above 250 GeV, respectively.
For the analysis presented here, GRS 1915+105 was observed by H.E.S.S. between 28 April and 3 May 2004 in response to an apparent decrease in the 15 GHz radio flux, which was monitored by the Ryle Telescope during a day plateau state (Pooley, 2006), as shown in Figure 6, in which coloured markers indicate the H.E.S.S. observation epochs. On the basis of previously observed behaviour, it was thought likely that the observed radio evolution signalled the end of the plateau state and, therefore, that flaring activity would begin within the subsequent 24 hours. The RXTE observations of GRS 1915+105 comprised six individual pointings, contributing to accumulated PCA and HEXTE livetimes of ksec and s, respectively. Fifteen contemporaneous H.E.S.S. observations were obtained, constituting an overall livetime of 6.9 hours.
2.3 Circinus X-1
Circinus X-1 (hereafter Cir X-1) has been extensively studied since its initial identification (Margon et al., 1971), revealing a somewhat confusing collection of complex observational characteristics.
Repeated observation of type I X-ray bursts (Tennant et al., 1986a, b; Linares et al., 2010) definitively identifies the compact primary in Cir X-1 as a low magnetic field (G) neutron star. Further sub-classification as a Z or atoll source (see, for example, Done et al., 2007, for an explanation of the distinction between these two classes) is not possible since Cir X-1 exhibits several confusing spectral and timing properties, subsets of which are characteristic of both source types (see e.g. Shirey et al., 1999a; Oosterbroek et al., 1995). Accordingly, established paradigms for disk-jet coupling in X-ray binaries with neutron star primaries (e.g. Migliari & Fender, 2006) cannot be reliably employed.
At radio wavelengths, the jets of Cir X-1 display notable structure on arcsecond scales, appearing as a bright core with significant extension along the axial direction of the arcminute jets (Fender et al., 1998). In fact, the observed extension is rather asymmetric with a ratio of at least two between the observed fluxes of the two opposing jets. Interpreted as pure relativistic aberration, this asymmetry implies a jet velocity . Cir X-1 has also been observed to eject condensations of matter with apparently superluminal velocities (Fender et al., 2004a). These observations imply a physical velocity for the ejecta with a maximum angle between the velocity vector and the line of sight .These results identify Cir X-1 as a microblazar, a Galactic, small-scale analog of the blazar class of AGN, several of which are known sources of VHE -rays.
Definitive classification of the donor star in Cir X-1 is somewhat problematic. The low apparent magnitude of the detected optical counterpart implies a dereddened luminosity consistent with a low-mass or sub-giant companion, implying that Cir X-1 is a LMXB with a high orbital eccentricity (e.g. Johnston et al., 1999). Nonetheless, recent near-infrared (Clark et al., 2003) and I-band optical (Jonker et al., 2007) observations reveal emission features that are consistent with a mid-B supergiant, suggesting a more moderate eccentricity .
Observations of Cir X-1 in the X-ray band reveal a long-term evolution of the average source brightness. Fluxes rose monotonically from near-undetectable in the early 1970s to a peak value of Crab (keV) at the turn of the millennium, before returning over a period of years to their pre-rise levels (Parkinson et al., 2003). Various X-ray spectra, obtained during epochs of both high and low flux, display evidence of complex and variable emission and absorption processes.
A previous analysis of H.E.S.S. observations of Cir X-1 was presented by Nicholas & Rowell (2008), who derived a preliminary upper limit to the -ray flux above 1 TeV of cm-2s-1 corresponding to a detector livetime of 28 hours.
The H.E.S.S. observations of Cir X-1 reported here began on 18 June 2004 and were scheduled to coincide with the periastron passage of the binary components. The previous observation of regular radio flares during this orbital interval were thought to provide a good chance of observing during a period of outburst with the associated possibility that superluminal ejections might occur. The RXTE observations of Cir X-1 comprised three individual pointings, corresponding to orbital phase intervals , and (using the radio flare ephemeris of Nicolson (2007)), and contributing to an accumulated PCA livetime of s. A data set comprising 12 contemporaneous H.E.S.S. observations yielded a combined livetime of 5.4 hours.
2.4 V4641 Sgr
V4641 Sgr is the optical designation of the habitually weak X-ray source SAX J1819.3-2525 (XTE J1819-254), which was independently identified using the BeppoSAX (in ’t Zand et al., 1999) and RXTE (Markwardt et al., 1999a) satellites. Optical spectroscopic measurements (Orosz et al., 2001; Lindstrøm et al., 2005) strongly suggest a late B- or early A-type companion with an effective temperature K. The mass of the compact primary, (MacDonald et al., 2014), categorises V4641 Sgr as a firm black hole candidate.
V4641 Sgr is probably best known for its exhibition of rapid and violent outbursts. Perhaps the most spectacular of these events was the super-Eddington flare detected by the RXTE ASM in September 1999. The observed X-ray fluxes (keV) increased sharply, reaching Crab within eight hours before fading again to below 0.1 Crab in under two hours (Revnivtsev et al., 2002). Powerful contemporaneous flares were also observed at hard X-ray (McCollough et al., 1999), optical (Stubbings & Pearce, 1999), and radio (Hjellming et al., 2000) wavelengths. In fact, Very Large Array (VLA) radio observations obtained within a day of the X-ray flare resolved a bright jet-like radio structure arcsec in length (Hjellming et al., 2000). Assuming the most likely hypothesis, i.e., that the ejection is coincident with some phase of the X-ray flare, proper motions in the range arcsec day-1 are derived. At the minimum distance kpc, the implied lower limit to the apparent velocity of the ejecta is , which is comparable with the extragalactic jets seen in blazars. Indeed, the remarkably high apparent velocities imply that V4641 Sgr may be a microblazar with a relativistic jet moving close to the line of sight (; from Orosz et al. (2001)). Subsequent, weaker broadband outbursts have also been observed, suggesting recurrent activity on a timescale years (e.g. Hjellming, 2000; Rupen et al., 2002, 2003; Swank, 2004).
Observations of V4641 Sgr with H.E.S.S. were initiated on 7 July 7 2004 (MJD 53193) in response to the source brightening rapidly in the radio (Rupen et al., 2004b), optical (Revnivtsev et al., 2004), and X-ray (Swank, 2004) bands. The resultant RXTE exposure comprised three observations, each contributing to an accumulated PCA livetime of ksec. Two pairs of 30 minute H.E.S.S. observations were obtained contemporaneously with the final two RXTE pointings. In total, the four separate exposures constitute an overall livetime of 1.76 hours.
3 Analysis and results
X-ray data reduction with the FTOOLS 5.3.1 software suite employed the data selection criteria regarding elevation, offset, electron contamination, and proximity to the South Atlantic Anomaly recommended by the RXTE Guest Observer Facility website222http://heasarc.nasa.gov/docs/xte/xhp_proc_analysis.html. For each observation, the PCA STANDARD2 data were extracted from all available PCUs. For all observations, HEXTE Archive mode data for both clusters were extracted following the recommended procedures for time filtering and background estimation. Spectral analysis was carried out using the XSPEC 12.6.0 package (Arnaud, 1996). Spectral fits for GRS 1915+105 use both PCA and HEXTE data, including an energy range of keV. For bright X-ray sources, such as GRS 1915+105, statistical errors on the number of counts per spectral bin become insignificant relative to dominant uncertainties in the instrument response. Accordingly, a 1% systematic error was added to all PCA channels. The remaining sources, Cir X-1 and V4641 Sgr, were not significantly detected by HEXTE and therefore only PCA data in the keV range were considered to ensure good data quality. These targets were sufficiently faint that the spectral bin uncertainties were statistically dominated and the addition of a systematic error component was not required. In the case of GRS 1915+105, power density spectra (PDS) were derived using the ftool powspec. For each RXTE pointing of GRS 1915+105, individual PDS were extracted from s intervals comprising bins. The resulting spectra were then averaged to produce a PDS for the total light curve with errors estimated using the standard deviation of the average of the power in each frequency bin. The overall PDS were logarithmically rebinned and normalised to represent the squared fractional RMS in each frequency bin (see e.g. Lewin et al., 1988). Corrections for instrument deadtime (see, for example, Revnivtsev et al., 2000) were applied (although this was found to have a negligible effect in the frequency range under consideration) and the expected white noise level was subtracted (Leahy et al., 1983). Similar temporal analyses for the remaining targets proved unfeasible because of insufficient count statistics at all but the lowest frequencies.
The -ray analysis followed the standard point-source procedure described in Aharonian et al. (2006b). The reflected background model (see, for example, Berge et al., 2007) was used to derive overall results in conjunction with both the hard and standard event selection cuts described by Aharonian et al. (2006b). Hard cuts (image size photoelectrons) tend to enhance the signal of sources with power-law spectral slopes that are harder in comparison to the dominant cosmic ray background. Standard cuts (image size photoelectrons) provide less sensitivity in such cases but allow a lower energy threshold. No significant detection was obtained for any of the three targets. Upper limits to the VHE -ray flux above the instrumental threshold energy were therefore derived at the 99% confidence level using the profile likelihood method (Rolke et al., 2005).
3.1 GRS 1915+105
As illustrated by the PCA and ASM light curves shown in Figure 1, the X-ray count rate was stable to within during each observation and varied by no more than between observations. Indeed, the long-term RXTE ASM light curve in Figure 1 (top panel) clearly indicates that the H.E.S.S. observation epochs occurred during an extended and relatively faint plateau in the keV flux.
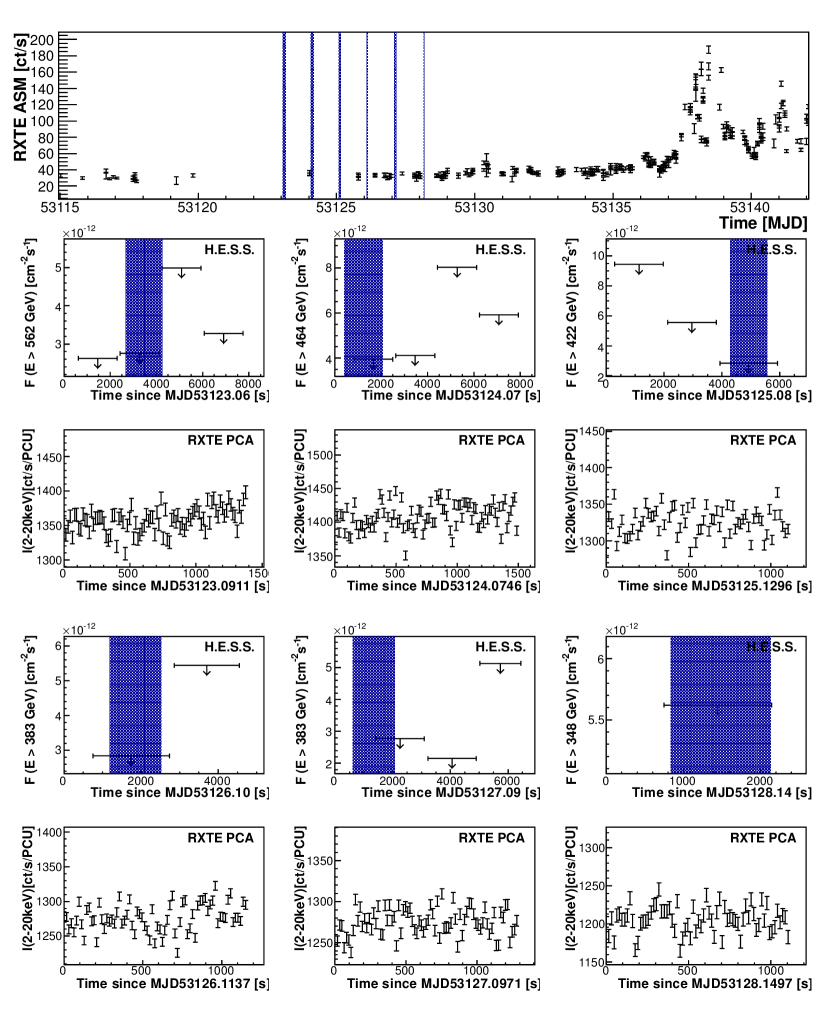
The keV X-ray spectra shown in Figure 8 also exhibit remarkable stability between observations. The individual spectra are dominated by a hard non-thermal component and strongly suggest class (in state C) behaviour (e.g. Zdziarski et al., 2001; Trudolyubov, 2001), which is confirmed by the location of the observations in the HID of Figure 5, according to the classification of Belloni et al. (2000). Figure 6 shows the contextual X-ray and 15 GHz radio light curves of GRS 1915+105 during a two-month period that brackets the H.E.S.S. observation epochs. It is evident from the figure that H.E.S.S. observed the target during and extended radio-loud plateau (80 mJy; for historical flux comparison, a three-year monitoring campaign is presented in Pooley (2006)). The plateau ended approximately ten days later with a combined radio and X-ray flaring episode. The assertion of radio-loud behaviour at the H.E.S.S. observation epochs is supported by the quasi-periodic oscillation (QPO) analysis presented in Figure 7. For a detailed discussion see Appendix A.1.
In summary, the combined spectral and temporal analyses indicate a robust association of the contemporaneous H.E.S.S. observation with the radio-loud state, and the presence of steady, mildly relativistic jets at the time of observation may be confidently inferred.
The contemporaneous H.E.S.S. observations did not yield a significant VHE -ray detection. The significances corresponding to the total H.E.S.S. exposure are computed using Eq. 17 from Li & Ma (1983) and are listed in Table 3. Figure 1 plots runwise 99% confidence level upper limits to the integral VHE -ray flux above the instrumental threshold energy and illustrates the overlap between the RXTE and H.E.S.S. observations. Integral flux upper limits, which correspond to the overall H.E.S.S. exposure, are listed in Table 4.
| Target | Image Cuts | [events] | [events] | Excess [events] | Significance [] | |
|---|---|---|---|---|---|---|
| GRS 1915+105 | Standard | 471 | 7127 | 0.073 | -51.6 | -2.2 |
| Hard | 36 | 783 | 0.060 | -10.9 | -1.6 | |
| Cir X-1 | Standard | 385 | 5959 | 0.068 | -20.1 | -1.0 |
| Hard | 45 | 648 | 0.056 | 9.1 | 1.4 | |
| V4641 Sgr | Standard | 161 | 2373 | 0.067 | 1.2 | 0.1 |
| Hard | 11 | 275 | 0.055 | -4.2 | -1.11 |
| Target | Cuts | [s] | [∘] | [GeV] | [ph cm-2s-1] |
|---|---|---|---|---|---|
| GRS 1915+105 | Standard | 24681 | 40.6 | 562 | |
| Hard | 24681 | 40.6 | 1101 | ||
| Cir X-1 | Standard | 19433 | 43.6 | 562 | |
| Hard | 19433 | 43.6 | 1101 | ||
| V4641 Sgr | Standard | 6335 | 8.4 | 237 | |
| Hard | 6335 | 8.4 | 422 |
3.2 Cir X-1
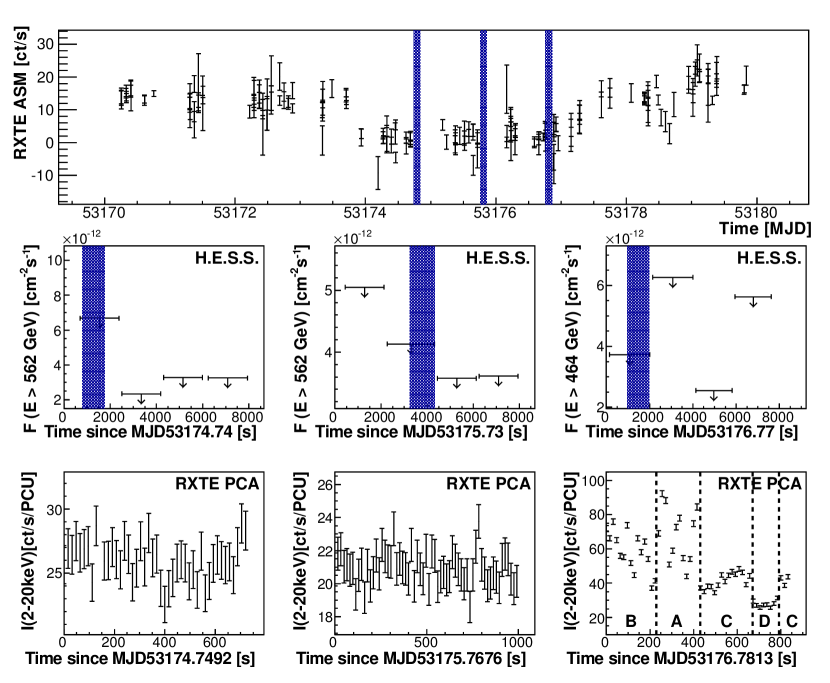
The ASM light curve shown in Figure 2 reveals that the H.E.S.S. observation epochs occurred during an extended day dip in the keV X-ray flux. Additionally, it should be noted that the observations reported here were obtained during an extremely faint episode in the secular X-ray flux evolution of Cir X-1 (Parkinson et al., 2003), which is also evident from the HID presented in Figure 9. As a consequence, the measured X-ray fluxes are significantly lower than most others reported for this source. As illustrated in Figure 2, the individual PCA light curves obtained during the first two pointings are characterised by a relatively low count rate, which remains approximately constant throughout each observation. In marked contrast, the third observation exhibits clear variability with count rates doubling on timescales of s.
A detailed analysis of the obtained spectra (see Appendix A.2) reveals that the observed flux variability is accompanied by marked variations in spectral shape. These can be interpreted as hinting towards a strong mass transfer during the periastron passage and subsequent dramatic evolution of the local radiative environment.
H.E.S.S. observations obtained contemporaneously with the RXTE pointings yield a non-detection that is evident from the significances listed in Table 3. Figure 2 plots runwise 99% confidence level upper limits to the integral VHE -ray flux above the instrumental threshold energy and illustrates complete overlap between the RXTE and H.E.S.S. observations. Integral flux upper limits, which correspond to the overall H.E.S.S. exposure, are listed in Table 4.
3.3 V4641 Sgr
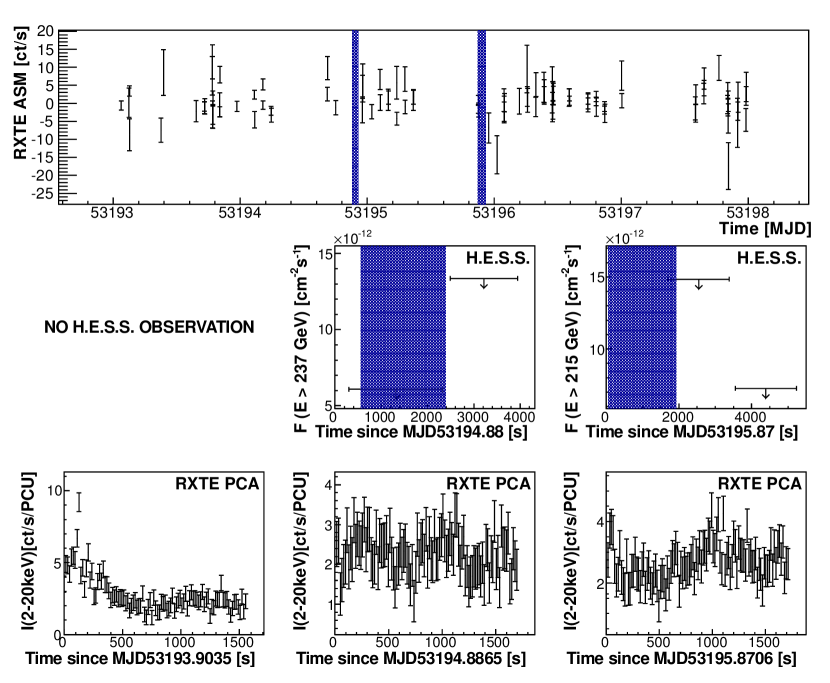
Figure 3 shows RXTE PCA light curves derived from three pointed observations. The individual light curves indicate various degrees of X-ray variability with the clearest evidence for flaring visible as a sharp -fold count rate fluctuation during the first observation. In marked contrast, the second observation is uniformly faint with the probability of constant count rate and, hence, this observation is consistent with a period of steady, low-level emission. Subsequently, the third observation reveals a reemergence of mild variability () with -fold count rate fluctuations occurring on timescales of s.
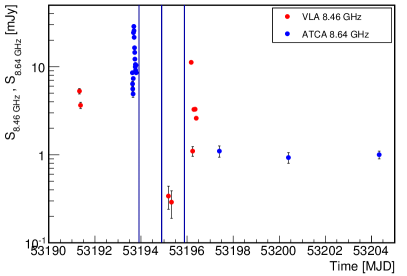
Radio data shown on Figure 11 right were obtained using the VLA and Australia Telescope Compact Array (ATCA) between MJD 53190 and MJD 53208. They indicate rapid variability with peak flux densities of mJy observed on MJD 53193 (Rupen et al., 2004b; Senkbeil & Sault, 2004; Rupen et al., 2004a). An optically thin radio spectrum () observed on MJD 53191 was interpreted by Rupen et al. (2004b) as the signature of a decaying radio flare. Radio observations were triggered by an optical alert from VSNET (MJD 53190) in combination with a RXTE PCA measurement during a Galactic bulge scan (MJD 53189) that revealed a 2-10 keV X-ray flux equivalent to 8.2 mCrab. For comparison, the August 2003 flare of V4641 Sgr reached 66 mCrab, while quiescent fluxes are typically ¡ 0.5 mCrab (Swank, 2004). As shown in Figure 11 right, the dedicated RXTE PCA observation and H.E.S.S. observations took place between two radio flares, which is consistent with the X-ray variability evolution illustrated in Figure 3.
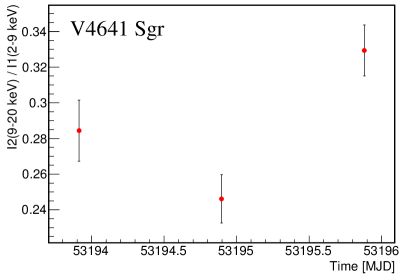
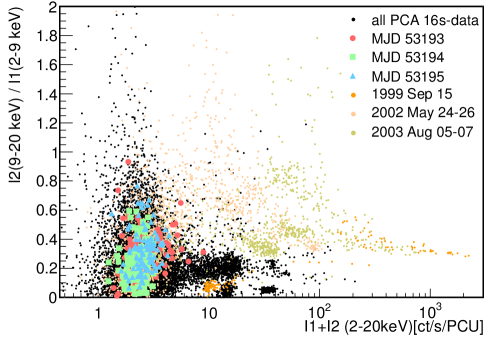
While V4641 Sgr is evidently the most X-ray-faint binary in the studied sample, it simultaneously exhibits the hardest spectrum, as shown by the hardness values in Figure 11 (left-hand panel). Furthermore, the evolution of the hardness is consistent with contemporaneous observations of rapid flux evolution in the radio band (Senkbeil & Sault, 2004)333 http://www.ph.unimelb.edu.au/~rsault/astro/v4641/ (Figure 11). To help place the H.E.S.S. and RXTE observations in a historical context, the HID for V4641 Sgr in Figure 12 displays the entire archival RXTE PCA data set for this target, and compares the X-ray characteristics corresponding to the H.E.S.S. observation periods (different symbols are used to indicate observations obtained on each day in the range MJD 53193-5) with three flaring episodes observed with RXTE. On 15 September 1999 (orange markers in Figure 12), a 1500s RXTE observation revealed a source flux evolution that is characterised by rapid, large-amplitude variability before reverting to a soft, low intensity state after s. An optical flare that preceded the RXTE observations likely corresponds with the onset of the short 10-hour outburst, which Wijnands & van der Klis (2000) associated with a low accretion event. Historically, flaring episodes exhibited by V4641 Sgr are often short, unpredictable, and relatively faint, which implies that many may go unnoticed.
Data corresponding to two longer outbursts, spanning the periods 24-26 May 2002 and 5-7 August 2003, are also illustrated in Figure 12. In the coordinates of the HID, both episodes are topologically similar to the 1999 outburst, but shifted towards fainter harder regions.
Evidently, the X-ray fluxes that correspond with H.E.S.S. observation epochs indicated in Figure 12 are substantially fainter than any of these historically remarkable outbursts.
In summary, in view of the various multiwavelength data, it seems likely that V4641 Sgr underwent a period of mild activity that spanned the H.E.S.S. observation epochs.
The contemporaneous H.E.S.S. data are consistent with non-detection with the corresponding -ray significances listed in Table 3. Technical issues prevented -ray data corresponding to the first RXTE observation from being obtained. Simultaneous -ray observations were obtained corresponding to the second RXTE exposure, which showed no indications of X-ray variability. Although the source began to show increased X-ray activity during the third RXTE observation, the degree of overlap with the corresponding H.E.S.S. observations was minimal. At radio, optical, and X-ray energies, V4641 Sgr exhibits rapid variability on timescales minutes or less (e.g. Uemura et al., 2005; Maitra & Bailyn, 2006). Optimistically, the compelling evidence for mild broadband flaring admits the possibility that the H.E.S.S. observations monitor a transient outburst event.
Integral flux upper limits above the instrumental threshold energy, which correspond to the overall H.E.S.S. exposure at the position of V4641 Sgr, are listed in Table 4.
4 Discussion
The principal aim of this investigation was to obtain contemporaneous X-ray and VHE -ray observations of three known superluminal microquasars during major flaring events. However, the results presented in 3 indicate that the interpretation of the VHE -ray non-detections cannot proceed under the assumption of energetic flaring or bulk superluminal ejections at the time of observation. Nonetheless, upper limits to the VHE -ray flux were derived and an analysis of the contemporaneous RXTE observations has helped to reveal the X-ray behaviour corresponding to the H.E.S.S. observation epochs. These data facilitate the straightforwards derivation of constraints on the -ray luminosity of the target binary systems. In Table 5 the calculated flux upper limits were used to infer the maximum -ray luminosities above the target-specific, instrumental threshold energy for each target binary system by assuming the maximum source distance estimate presented in Table 1.
| Target | Maximum Distance Estimate | Luminosity above | |
|---|---|---|---|
| [kpc] | [GeV] | [erg s-1] | |
| GRS 1915+105 | 10.6 | 562 | |
| Cir X-1 | 10.2 | 562 | |
| V4641 Sgr | 6.9 | 237 |
Analysis of the contemporaneous X-ray and radio observations conclusively places GRS 1915+105 in a radio-loud plateau state at the time of observation. In contrast with the superluminal flaring episodes, this state is characterised by the production of continuous, mildly relativistic radio jets with an estimated power of erg s-1 (Klein-Wolt et al. (2002), assuming a distance of 11 kpc). Theoretically, it seems unlikely that bright VHE -ray emission would be expected from the compact self-absorbed jets, which are typical of the plateau state of GRS 1915+105. For example, a leptonic emission model developed by Bosch-Ramon et al. (2006) to simulate the broadband emission of microquasar jets in the low-hard state predicts VHE -ray luminosities erg s-1 that are consistent with the H.E.S.S. non-detection. Notwithstanding the plausibility of VHE -ray emission in the plateau state, a comparison of the estimated jet power with the maximum -ray luminosity listed in Table 5 reveals that the jet power conversion efficiency is constrained to be for -ray production above 562 GeV. For comparison, corresponding efficiency estimates for -ray production were derived for the steady, compact jets of other microquasars that were observed in appropriate states. The published MAGIC upper limit on the VHE -ray luminosity of Cygnus X-3 during its hard state implies a somewhat larger maximum conversion efficiency of 0.07% (Aleksić et al., 2010) and a similar value is obtained from MAGIC upper limits on the steady VHE emission from Cygnus X-1 (Albert et al., 2007). These efficiencies are inferred from the directly observed jet power, and should be distinguished from the higher jet powers that were indirectly derived from the observation of radio-emitting bubbles inflated by microquasar jets (see e.g. Gallo et al., 2005 for Cyg X-1, and Pakull et al., 2010, Soria et al., 2010 for S26 in NGC 7793).
We presented an analysis of the entire H.E.S.S. data set for GRS 1915+105 (Acero et al., 2009) and we derived an upper limit to the -ray flux above 0.41 TeV of cm-2s-1, corresponding to a detector livetime of 24.1 hours. The somewhat higher upper limits presented in 3.1 utilise a more limited data set and are therefore consistent with the previously published value. None of the H.E.S.S. observations of GRS 1915+105 coincide with bright flaring episodes at longer wavelengths.
Observations of Cir X-1 were obtained during an extended dip in the X-ray flux, at phase intervals close to the periastron passage of the binary components. Spectral analysis of the RXTE data showed some evidence for a recent increase in mass transfer, producing strong signatures of X-ray absorption. It was hoped that H.E.S.S. observations would coincide with one of the quasi-regular radio flares, which often accompany periastron passage in Cir X-1.
The ephemeris of Nicolson (2007) predicts the onset of a radio flare h before the first RXTE observation. Unfortunately, despite the undoubted occurrence of quasi-periodic radio flares from Cir X-1 near periastron, a robust correlation between the observed X-ray and radio behaviour is yet to be identified. Although rapid brightening of the X-ray continuum might indicate accompanying radio flares, evidence for a definitive association is far from clear (Soleri et al., 2007; Tudose et al., 2008). Recent radio observations of Cir X-1 (e.g. Fender et al., 2004a; Tudose et al., 2008) focus primarily on the ultrarelativistic ejection events that manifest as day episodes of flaring on timescales of a few hours. In principle, the lack of contemporaneous radio data admits the possibility of such persistent outbursts at the time of observation. By analogy with canonical black hole binaries, it is possible that the inferred variation in the mass accretion rate between the first and second RXTE observations also implies an evolution of the jet properties (Migliari & Fender, 2006), but this is far from clear in such an unusual system. Moreover, Tudose et al. (2008) report compelling evidence that prior to 2006, Cir X-1 underwent a year episode of unusual radio quiescence, suggesting that jet formation was somewhat suppressed during the epochs of H.E.S.S. observation. Accordingly, without strictly simultaneous radio data indicating otherwise, the most likely scenario is that no outflows were present. In this context the absence of a detectable -ray signal is not surprising.
As a confirmed high-mass black hole binary, V4641 Sgr is the studied target that most closely resembles the Cygnus X-1 and Cygnus X-3 systems. Moreover, the H.E.S.S. observations were obtained during a period of sporadic broadband flaring, and comparing these observations with the results of Albert et al. (2007), VHE -ray emission might have been expected. The detection of Cyg X-1 using the MAGIC telescopes appeared to coincide with the rising part of a strong X-ray flare. In contrast, radio spectra obtained close to the H.E.S.S. observational epochs are indicative of the decay following a flaring episode (Senkbeil & Sault, 2004). Assuming that the -ray emission mechanisms operating in Cyg X-1 also occur in V4641 Sgr, the absence of a significant H.E.S.S. detection might be viewed as evidence that production of GeV and TeV photons is a highly transient process. This would further suggest that -ray emission originates in a spatially compact region that is at most a few light hours in size.
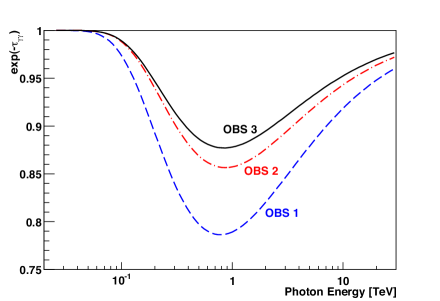
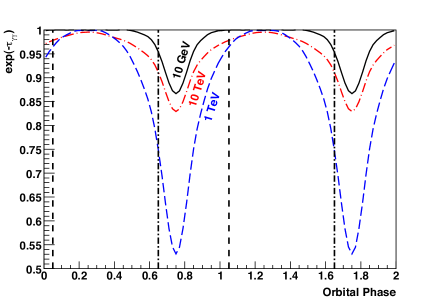
Absorption of -rays by pair production is expected to be negligible in GRS 1915+105, since the donor star is too cool and faint to produce a strong ultraviolet photon field. The same is true of Cir X-1 if the conventional assumption of a low-mass companion is adopted. For completeness, Figure 4 plots the level of -ray absorption predicted by a numerical implementation of the model presented by Dubus (2006), assuming that the companion star in Cir X-1 is in fact a mid-B supergiant as proposed by Jonker et al. (2007). The separate curves are representative of the three orbital phase intervals corresponding to the H.E.S.S. observation epochs, and were derived using the system parameters derived by Jonker et al. (2007) in conjunction with typical values for the temperature ( K) and radius ( R⊙) of a mid-B supergiant. It is evident that some non-negligible absorption is expected, particularly during the first observation interval. Nonetheless, it seems unlikely that the expected levels of attenuation () would suppress an otherwise detectable -ray flux sufficiently to yield the low significances listed in Table 3.
The situation with regard to -ray absorption is clearer in the case of V4641 Sgr, since the companion has been spectroscopically identified as a late B- or early A-type star. Using the system parameters derived by Orosz et al. (2001) and assuming a circularised orbit, the model presented by Dubus (2006) was used to predict the expected levels of -ray absorption as a function of orbital phase. As illustrated in Figure 4 (bottom panel), absorption might have an important effect during the first H.E.S.S. observation interval, although as with Cir X-1 the predicted levels of absorption () would not attenuate a bright -ray signal so far below the detection threshold. During the second H.E.S.S. observation interval, when X-ray data show marginal indications of source activity, the predicted absorption due to pair production on the stellar radiation field is negligible. We note however that, as in the case of Cir X-1, the relative inclination of the jets from V4641 Sgr with respect to the accretion disk may be low (Schulz et al., 2006) and, therefore, further absorption of GeV – TeV -ray photons could occur via interaction with the disk thermal photon field (see e.g. Carraminana, 1992).
It should also be noted that all the confirmed VHE -ray binaries lie at distances of kpc. In contrast, the targets reported here have maximum distances in the range kpc, resulting in flux dilution factors that are greater by one order of mangnitude. Obviously, this has strong implications for the detectability of any emitted -ray signal.
5 Conclusions
Contemporaneous VHE -ray and X-ray observations of GRS 1915+105, Cir X-1, and V4641 Sgr were obtained using H.E.S.S. and RXTE. Analysis of the resultant H.E.S.S. data did not yield a significant detection for any of the target microquasars. However, X-ray binaries are dynamic systems and as such are likely to exhibit evolution of their radiative properties, both as a function of orbital phase and also in response to non-deterministic properties. It follows that the non-detections presented in this work do not indicate that the target binary systems do not emit detectable VHE -ray emission at phases other than those corresponding to the H.E.S.S. observations.
GRS 1915+105 appears to have been observed during an extended plateau state, the archival multiwavelength data suggesting the presence of continuous, mildly relativistic radio jets at the time of observation. The RXTE observations of Cir X-1 yield data that are consistent with strongly varying obscuration of the X-ray source shortly after periastron passage, but these data are not indicative of bright flaring during the H.E.S.S. observation epochs. Conversely, V4641 Sgr appears to have been observed during an episode of mild, transient flaring, although rapid source variability, combined with the limited duration of the strictly simultaneous H.E.S.S. and RXTE exposure, complicates interpretation.
Microquasars continue to be classified as targets of opportunity for IACTs, requiring a rapid response to any external trigger to maximise the likelihood of obtaining a significant detection. These conditions are realised with the commissioning of the H.E.S.S. 28 m telescope, which aims to lower the energy threshold from 100 GeV to about 30 GeV (Parsons et al. (2015); Holler et al. (2015a); Holler et al. (2015b)) while simultaneously enabling very rapid follow-up observations (Hofverberg et al., 2013). To exploit these new opportunities and an increasing understanding of the behaviour of microquasars, the triggering strategies for TeV follow-up observations have evolved significantly in recent years. In the future, alternative observational strategies, including continuous monitoring of candidate microquasars in the VHE -ray band, may become possible using dedicated sub-arrays of the forthcoming Cherenkov Telescope Array (CTA Consortium, 2011).
Irrespective of the non-detections presented herein, the tantalising observations of Cygnus X-3 at GeV energies and Cygnus X-1 by the MAGIC telescope ensures that the motivations for observing microquasars using IACTs remain compelling. Indeed, by further constraining the -ray emission properties of microquasars, subsequent observations will inevitably yield an enhanced understanding of astrophysical jet production on all physical scales. More optimistically, the detection of additional -ray-bright microquasars would greatly facilitate a comprehensive characterisation of the particle acceleration and radiative emission mechanisms that operate in such systems.
Acknowledgements.
The support of the Namibian authorities and of the University of Namibia in facilitating the construction and operation of H.E.S.S. is gratefully acknowledged, as is the support by the German Ministry for Education and Research (BMBF), the Max Planck Society, the German Research Foundation (DFG), the French Ministry for Research, the CNRS-IN2P3 and the Astroparticle Interdisciplinary Programme of the CNRS, the U.K. Science and Technology Facilities Council (STFC), the IPNP of the Charles University, the Czech Science Foundation, the Polish Ministry of Science and Higher Education, the South African Department of Science and Technology and National Research Foundation, and by the University of Namibia. We appreciate the excellent work of the technical support staff in Berlin, Durham, Hamburg, Heidelberg, Palaiseau, Paris, Saclay, and in Namibia in the construction and operation of the equipment.References
- Abramowski et al. (2012) Abramowski, A., Acero, F., Aharonian, F., et al. 2012, ApJ, 757, 158
- Acciari et al. (2009) Acciari, V. A., Aliu, E., Arlen, T., et al. 2009, Nature, 462, 770
- Acero et al. (2009) Acero, F., Aharonian, F., Akhperjanian, A. G., & HESS Collaboration. 2009, A&A, 508, 1135
- Aharonian et al. (2003) Aharonian, F., Akhperjanian, A., Beilicke, M., et al. 2003, A&A, 403, L1
- Aharonian et al. (2009) Aharonian, F., Akhperjanian, A. G., Anton, G., et al. 2009, ApJ, 695, L40
- Aharonian et al. (2006a) Aharonian, F., Akhperjanian, A. G., Bazer-Bachi, A. R., et al. 2006a, A&A, 457, 899
- Aharonian et al. (2006b) Aharonian, F., Akhperjanian, A. G., Bazer-Bachi, A. R., et al. 2006b, A&A
- Aharonian et al. (2006c) Aharonian, F., Akhperjanian, A. G., Bazer-Bachi, A. R., et al. 2006c, A&A, 460, 743
- Aharonian & Atoyan (1996) Aharonian, F. A. & Atoyan, A. M. 1996, A&A, 309, 917
- Albert et al. (2007) Albert, J., Aliu, E., Anderhub, H., et al. 2007, ApJ, 665, L51
- Aleksić et al. (2012) Aleksić, J., Alvarez, E. A., Antonelli, L. A., et al. 2012, A&A, 539, L2
- Aleksić et al. (2010) Aleksić, J., Antonelli, L. A., Antoranz, P., et al. 2010, ApJ, 721, 843
- Arnaud (1996) Arnaud, K. A. 1996, in ASP Conf. Ser. 101: Astronomical Data Analysis Software and Systems V, ed. G. H. Jacoby & J. Barnes, 17
- Atoyan & Aharonian (1999) Atoyan, A. M. & Aharonian, F. A. 1999, MNRAS, 302, 253
- Bednarek (2010) Bednarek, W. 2010, MNRAS, 406, 689
- Belloni et al. (2000) Belloni, T., Klein-Wolt, M., Méndez, M., van der Klis, M., & van Paradijs, J. 2000, A&A, 355, 271
- Belloni et al. (1997) Belloni, T., Mendez, M., King, A. R., van der Klis, M., & van Paradijs, J. 1997, ApJ, 488, L109+
- Belloni et al. (2002) Belloni, T., Psaltis, D., & van der Klis, M. 2002, ApJ, 572, 392
- Berge et al. (2007) Berge, D., Funk, S., & Hinton, J. 2007, A&A, 466, 1219
- Bosch-Ramon et al. (2006) Bosch-Ramon, V., Romero, G. E., & Paredes, J. M. 2006, A&A, 447, 263
- Böttcher & Dermer (2005) Böttcher, M. & Dermer, C. D. 2005, ApJ, 634, L81
- Carraminana (1992) Carraminana, A. 1992, A&A, 264, 127
- Castro-Tirado et al. (1994) Castro-Tirado, A. J., Brandt, S., Lund, N., et al. 1994, ApJS, 92, 469
- Clark et al. (2003) Clark, J. S., Charles, P. A., Clarkson, W. I., & Coe, M. J. 2003, A&A, 400, 655
- Coppi (2000) Coppi, P. S. 2000, in Bulletin of the American Astronomical Society, Vol. 32, 1217
- Corbel et al. (2012) Corbel, S., Dubus, G., Tomsick, J. A., et al. 2012, MNRAS, 421, 2947
- CTA Consortium (2011) CTA Consortium. 2011, Exper. Astron., 32, 193
- Dermer & Böttcher (2006) Dermer, C. D. & Böttcher, M. 2006, ApJ, 643, 1081
- Done et al. (2007) Done, C., Gierliński, M., & Kubota, A. 2007, A&A Rev., 15, 1
- Dubus (2006) Dubus, G. 2006, A&A, 451, 9
- Dubus et al. (2010) Dubus, G., Cerutti, B., & Henri, G. 2010, MNRAS, 404, L55
- Eikenberry et al. (1998) Eikenberry, S. S., Matthews, K., Morgan, E. H., Remillard, R. A., & Nelson, R. W. 1998, ApJ, 494, L61+
- Falcke et al. (2004) Falcke, H., Körding, E., & Markoff, S. 2004, A&A, 414, 895
- Fender & Belloni (2004) Fender, R. & Belloni, T. 2004, ARA&A, 42, 317
- Fender et al. (1998) Fender, R., Spencer, R., Tzioumis, T., et al. 1998, ApJ, 506, L121
- Fender et al. (2004a) Fender, R., Wu, K., Johnston, H., et al. 2004a, Nature, 427, 222
- Fender et al. (2004b) Fender, R. P., Belloni, T. M., & Gallo, E. 2004b, MNRAS, 355, 1105
- Fender et al. (1997) Fender, R. P., Pooley, G. G., Brocksopp, C., & Newell, S. J. 1997, MNRAS, 290, L65
- Fermi LAT Collaboration et al. (2009) Fermi LAT Collaboration, Abdo, A. A., Ackermann, M., et al. 2009, Science, 326, 1512
- Gallo et al. (2005) Gallo, E., Fender, R., Kaiser, C., et al. 2005, Nature, 436, 819
- Georganopoulos et al. (2002) Georganopoulos, M., Aharonian, F. A., & Kirk, J. G. 2002, A&A, 388, L25
- Ghisellini & Maraschi (1989) Ghisellini, G. & Maraschi, L. 1989, ApJ, 340, 181
- Gierliński et al. (2009) Gierliński, M., Done, C., & Page, K. 2009, MNRAS, 392, 1106
- Gould & Schréder (1967) Gould, R. J. & Schréder, G. P. 1967, Physical Review, 155, 1404
- Greiner et al. (2001) Greiner, J., Cuby, J. G., McCaughrean, M. J., Castro-Tirado, A. J., & Mennickent, R. E. 2001, A&A, 373, L37
- Heinz et al. (2015) Heinz, S., Burton, M., Braiding, C., et al. 2015, The Astrophysical Journal, 806, 265
- Hjellming (2000) Hjellming, R. M. 2000, The Astronomer’s Telegram, 61, 1
- Hjellming et al. (2000) Hjellming, R. M., Rupen, M. P., Hunstead, R. W., et al. 2000, ApJ, 544, 977
- Hofverberg et al. (2013) Hofverberg, P., Kankanyan, R., Panter, M., et al. 2013, Proceedings of the 33rd ICRC
- Holler et al. (2015a) Holler, M., Balzer, A., Chalmé-Calvet, R., de Naurois, M., & Zaborov, D. 2015a, in Proceedings of the 34th ICRC
- Holler et al. (2015b) Holler, M., Berge, D., van Eldik, C., et al. 2015b, in Proceedings of the 34th ICRC
- Homan & Belloni (2005) Homan, J. & Belloni, T. 2005, Ap&SS, 300, 107
- Iaria et al. (2001) Iaria, R., Di Salvo, T., Burderi, L., & Robba, N. R. 2001, ApJ, 561, 321
- in ’t Zand et al. (1999) in ’t Zand, J., Heise, J., Bazzano, A., et al. 1999, IAU Circ., 7119, 1
- Johnston et al. (1999) Johnston, H. M., Fender, R., & Wu, K. 1999, MNRAS, 308, 415
- Jonker et al. (2007) Jonker, P. G., Nelemans, G., & Bassa, C. G. 2007, MNRAS, 374, 999
- Jourdain et al. (2012) Jourdain, E., Roques, J. P., Chauvin, M., & Clark, D. J. 2012, ApJ, 761, 27
- Kalberla et al. (2005) Kalberla, P. M. W., Burton, W. B., Hartmann, D., et al. 2005, A&A, 440, 775
- Klein-Wolt et al. (2002) Klein-Wolt, M., Fender, R. P., Pooley, G. G., et al. 2002, MNRAS, 331, 745
- Königl (1981) Königl, A. 1981, ApJ, 243, 700
- Laurent et al. (2011) Laurent, P., Rodriguez, J., Wilms, J., et al. 2011, Science, 332, 438
- Leahy et al. (1983) Leahy, D. A., Darbro, W., Elsner, R. F., et al. 1983, ApJ, 266, 160
- Lewin et al. (1988) Lewin, W. H. G., van Paradijs, J., & van der Klis, M. 1988, Space Science Reviews, 46, 273
- Li & Ma (1983) Li, T.-P. & Ma, Y.-Q. 1983, ApJ, 272, 317
- Linares et al. (2010) Linares, M., Watts, A., Altamirano, D., et al. 2010, ApJ, 719, L84
- Lindstrøm et al. (2005) Lindstrøm, C., Griffin, J., Kiss, L. L., et al. 2005, MNRAS, 363, 882
- MacDonald et al. (2014) MacDonald, R. K. D., Bailyn, C. D., Buxton, M., et al. 2014, The Astrophysical Journal, 784, 2
- Maitra & Bailyn (2006) Maitra, D. & Bailyn, C. D. 2006, ApJ, 637, 992
- Malzac et al. (2008) Malzac, J., Lubiński, P., Zdziarski, A. A., et al. 2008, A&A, 492, 527
- Margon (1984) Margon, B. 1984, ARA&A, 22, 507
- Margon et al. (1971) Margon, B., Lampton, M., Bowyer, S., & Cruddace, R. 1971, ApJ, 169, L23
- Markoff et al. (2005) Markoff, S., Nowak, M. A., & Wilms, J. 2005, ApJ, 635, 1203
- Markwardt et al. (1999a) Markwardt, C. B., Swank, J. H., & Morgan, E. H. 1999a, IAU Circ., 7257, 2
- Markwardt et al. (1999b) Markwardt, C. B., Swank, J. H., & Taam, R. E. 1999b, ApJ, 513, L37
- McCollough et al. (1999) McCollough, M. L., Finger, M. H., & Woods, P. M. 1999, IAU Circ., 7257, 1
- Merloni et al. (2003) Merloni, A., Heinz, S., & di Matteo, T. 2003, MNRAS, 345, 1057
- Migliari & Fender (2006) Migliari, S. & Fender, R. P. 2006, MNRAS, 366, 79
- Mirabel & Rodriguez (1994) Mirabel, I. F. & Rodriguez, L. F. 1994, Nature, 371, 46
- Moskalenko (1995) Moskalenko, I. V. 1995, Space Sci. Rev., 72, 593
- Muno et al. (1999) Muno, M. P., Morgan, E. H., & Remillard, R. A. 1999, ApJ, 527, 321
- Murdin et al. (1980) Murdin, P., Jauncey, D. L., Lerche, I., et al. 1980, A&A, 87, 292
- Nicholas & Rowell (2008) Nicholas, B. & Rowell, G. 2008, in American Institute of Physics Conference Series, Vol. 1085, American Institute of Physics Conference Series, ed. F. A. Aharonian, W. Hofmann, & F. Rieger, 245–248
- Nicolson (2007) Nicolson, G. D. 2007, The Astronomer’s Telegram, 985, 1
- Oosterbroek et al. (1995) Oosterbroek, T., van der Klis, M., Kuulkers, E., van Paradijs, J., & Lewin, W. H. G. 1995, A&A, 297, 141
- Orosz et al. (2001) Orosz, J. A., Kuulkers, E., van der Klis, M., et al. 2001, ApJ, 555, 489
- Pakull et al. (2010) Pakull, M., Soria, R., & Motch, C. 2010, Nature, 466, 209
- Parkinson et al. (2003) Parkinson, P. M. S., Tournear, D. M., Bloom, E. D., et al. 2003, ApJ, 595, 333
- Parsons et al. (2015) Parsons, R. D., Gajdus, M., & Murach, T. 2015, in Proceedings of the 34th ICRC
- Pooley (2006) Pooley, G. 2006, in VI Microquasar Workshop: Microquasars and Beyond, 9
- Protheroe & Stanev (1987) Protheroe, R. J. & Stanev, T. 1987, ApJ, 322, 838
- Reid et al. (2014) Reid, M. J., McClintock, J. E., Steiner, J. F., et al. 2014, The Astrophysical Journal, 796, 2
- Revnivtsev et al. (2000) Revnivtsev, M., Gilfanov, M., & Churazov, E. 2000, A&A, 363, 1013
- Revnivtsev et al. (2002) Revnivtsev, M., Gilfanov, M., Churazov, E., & Sunyaev, R. 2002, A&A, 391, 1013
- Revnivtsev et al. (2004) Revnivtsev, M., Khamitov, I., Burenin, R., et al. 2004, The Astronomer’s Telegram, 297, 1
- Rolke et al. (2005) Rolke, W. A., López, A. M., & Conrad, J. 2005, Nuclear Instruments and Methods in Physics Research A, 551, 493
- Romero et al. (2005) Romero, G. E., Christiansen, H. R., & Orellana, M. 2005, ApJ, 632, 1093
- Romero et al. (2003) Romero, G. E., Torres, D. F., Kaufman Bernadó, M. M., & Mirabel, I. F. 2003, A&A, 410, L1
- Romero et al. (2014) Romero, G. E., Vieyro, F. L., & Chaty, S. 2014, A&A, 562, L7
- Rupen et al. (2002) Rupen, M. P., Dhawan, V., & Mioduszewski, A. J. 2002, IAU Circ., 7928, 2
- Rupen et al. (2004a) Rupen, M. P., Dhawan, V., & Mioduszewski, A. J. 2004a, The Astronomer’s Telegram, 303, 1
- Rupen et al. (2003) Rupen, M. P., Mioduszewski, A. J., & Dhawan, V. 2003, The Astronomer’s Telegram, 172, 1
- Rupen et al. (2004b) Rupen, M. P., Mioduszewski, A. J., & Dhawan, V. 2004b, The Astronomer’s Telegram, 296, 1
- Russell et al. (2006) Russell, D. M., Fender, R. P., Hynes, R. I., et al. 2006, MNRAS, 371, 1334
- Saito et al. (2009) Saito, T. Y., Zanin, R., Bordas, P., et al. 2009, in 31st ICRC (Łódź), 1233 (arXiv:0907.1017)
- Schulz et al. (2006) Schulz, N. S., Brandt, W. N., Galloway, D. K., Chakrabarty, D., & Heinz, S. 2006, in ESA Special Publication, Vol. 604, The X-ray Universe 2005, ed. A. Wilson, 201
- Schulz et al. (2008) Schulz, N. S., Kallman, T. E., Galloway, D. K., & Brandt, W. N. 2008, ApJ, 672, 1091
- Senkbeil & Sault (2004) Senkbeil, C. & Sault, B. 2004, The Astronomer’s Telegram, 302, 1
- Shirey et al. (1999a) Shirey, R. E., Bradt, H. V., & Levine, A. M. 1999a, ApJ, 517, 472
- Shirey et al. (1999b) Shirey, R. E., Levine, A. M., & Bradt, H. V. 1999b, ApJ, 524, 1048
- Soleri et al. (2006) Soleri, P., Belloni, T., & Casella, P. 2006, in VI Microquasar Workshop: Microquasars and Beyond, 43
- Soleri et al. (2007) Soleri, P., Tudose, V., Fender, R. P., & van der Klis, M. 2007, in Proceedings of ”Bursts, Pulses and Flickering: wide-field monitoring of the dynamic radio sky”. 12-15 June 2007, Kerastari, Tripolis, Greece., p.37
- Soria et al. (2010) Soria, R., Pakull, M., Broderick, J., & Corbel, S. 2010, MNRAS, 409, 541
- Steeghs et al. (2013) Steeghs, D., McClintock, J. E., Parsons, S. G., et al. 2013, The Astrophysical Journal, 768, 185
- Stubbings & Pearce (1999) Stubbings, R. & Pearce, A. 1999, IAU Circ., 7253, 1
- Swank (2004) Swank, J. 2004, The Astronomer’s Telegram, 295, 1
- Tavani et al. (2009) Tavani, M., Bulgarelli, A., Piano, G., et al. 2009, Nature, 462, 620
- Tennant et al. (1986a) Tennant, A. F., Fabian, A. C., & Shafer, R. A. 1986a, MNRAS, 221, 27P
- Tennant et al. (1986b) Tennant, A. F., Fabian, A. C., & Shafer, R. A. 1986b, MNRAS, 219, 871
- Trudolyubov (2001) Trudolyubov, S. P. 2001, ApJ, 558, 276
- Tudose et al. (2006) Tudose, V., Fender, R. P., Kaiser, C. R., et al. 2006, MNRAS, 372, 417
- Tudose et al. (2008) Tudose, V., Fender, R. P., Tzioumis, A. K., Spencer, R. E., & van der Klis, M. 2008, MNRAS, 390, 447
- Uemura et al. (2005) Uemura, M., Mennickent, R., Stubbings, R., et al. 2005, Information Bulletin on Variable Stars, 5626, 1
- Vadawale et al. (2001) Vadawale, S. V., Rao, A. R., & Chakrabarti, S. K. 2001, A&A, 372, 793
- van Oers & Markoff (2010) van Oers, P. & Markoff, S. 2010, in Proceedings of the International Astronomical Union, Vol. 6, Jets at all Scales, 294–298
- van Paradijs & McClintock (1994) van Paradijs, J. & McClintock, J. E. 1994, A&A, 290, 133
- Wijnands & van der Klis (2000) Wijnands, R. & van der Klis, M. 2000, ApJ, 528, L93
- Zdziarski (2014) Zdziarski, A. A. 2014, MNRAS, 444, 1113
- Zdziarski et al. (2001) Zdziarski, A. A., Grove, J. E., Poutanen, J., Rao, A. R., & Vadawale, S. V. 2001, ApJ, 554, L45
- Zdziarski et al. (2003) Zdziarski, A. A., Lubinski, P., Gilfanov, M., & Revnivtsev, M. 2003, MNRAS, 342, 355
- Zdziarski et al. (2012) Zdziarski, A. A., Sikora, M., Dubus, G., et al. 2012, MNRAS, 421, 2956
- Zhang et al. (1993) Zhang, W., Giles, A. B., Jahoda, K., et al. 1993, in Society of Photo-Optical Instrumentation Engineers (SPIE) Conference Series, Vol. 2006, Society of Photo-Optical Instrumentation Engineers (SPIE) Conference Series, ed. O. H. Siegmund, 324–333
- Ziolkowski (2015) Ziolkowski, J. 2015, submitted to MNRAS
Appendix A Modelling and determination of the system X-ray states
A.1 GRS 1915+105
Figure 5 shows the HID derived from the entire archival RXTE PCA data set for GRS 1915+105. Hardness is defined as the ratio of fluxes measured in the 2-9 keV and 9-20 keV bands, while intensity is defined as the sum of the band-limited fluxes in units of counts per second. The background has been subtracted and the light curves are sampled in 16 s intervals. These definitions are used consistently for the three HIDs presented in this paper. In the case of GRS 1915+105, the H.E.S.S. observation took place in a low-hard state (LHS; symbols for MJD 53123-8 in top-left sector of Figure 5), in which compact jets are expected to be present and characterised by a potentially radio-loud X-ray variability class (belonging to state C following the classification of Belloni et al. (2000)). For comparison, the orange points in Figure 5 correspond with data obtained on 17 December 1997. These data were studied by Soleri et al. (2006) who associated them with a hard-intermediate state (HIMS) to soft-intermediate state (SIMS) transition.
The power density spectra shown in Figure 7 show the presence of low frequency QPOs: following the approach of Belloni et al. (2002), a Lorentzian decomposition of the observed power spectra was performed using two broad continuum components and several narrower QPO peaks. Crucially, the characteristic frequency ( (see Belloni et al. 2002)) of the higher frequency continuum component never exceeds Hz during our observations. This is far below the characteristic cut-off frequencies associated with previous observations of the radio-quiet state (e.g. Trudolyubov 2001). Radio-quiet observations (Belloni et al. 1997; Trudolyubov 2001) exhibit significant band-limited white noise extending to high frequencies Hz, while in radio-loud case such noise is either absent or exhibits an exponential cut-off at Hz (Trudolyubov 2001). Consequently, the absence of band limited noise at high frequencies is consistent with a radio-loud state C.
Figure 8 illustrates the spectral analysis performed for each GRS 1915+105 RXTE observation. The simple model described by Vadawale et al. (2001) has been adopted: a continuum model comprising a disk black-body (DiskBB444http://heasarc.gsfc.nasa.gov/xanadu/xspec/manual/XspecModels.html) component, a hybrid thermal and a non-thermal Comptonisation component (CompST), and a separate power law (Powerlaw) to model the high-energy emission. Interstellar absorption was modelled using the Wabs model in XSPEC with the equivalent hydrogen column fixed to a value of cm-2 (Belloni et al. 1997; Markwardt et al. 1999b; Muno et al. 1999). A constant multiplicative factor was introduced to account for the normalisation of HEXTE relative to the PCA. The addition of a Gaussian component with centroid energy fixed at 6.4 keV was found to significantly improve the resultant model fit.
As demonstrated by the reduced values listed in Table 6, the fitted model provides an adequate description of the RXTE data, and the derived model parameters correspond closely to those obtained by Vadawale et al. (2001) during earlier episodes of radio-loud -state behaviour, supporting the attribution of this state to the epochs of H.E.S.S. observation. However, insufficient event statistics prevent the inference of robust conclusions regarding the origin of the X-rays that were observed in this study. A more sophisticated and physically well-motivated model, describing an X-ray corona (EQPAIR from Coppi (2000)) gives a similar goodness-of-fit, after accounting for a larger parameter count. Physically, the power-law component could result from Comptonisation by energetic electrons in a corona or could be generated by synchrotron radiation at the base of a jet. The former scenario is discussed in a number of papers (e.g. Zdziarski et al. (2003)), while the latter was studied by van Oers & Markoff (2010) in the context of a similar plateau state of GRS1915+105. They applied a leptonic jet model (Markoff et al. 2005) to X-ray, IR, and radio data. Although their model provided statistically convincing broadband fits, this was only achievable when adopting extreme parameter values. The power law with that was derived in this study (Table 6) cannot be extrapolated down to UV band without generating an inconsistency in subsequently inferred bolometric luminosity. It should be interpreted as a phenomenological approximation of a high-energy tail, which itself might only be partially accounted for by SSC radiation.
A similar plateau state of GRS 1915+105 (October 1997) was studied by Klein-Wolt et al. (2002), who attributed the observed radio emission to quasi-continuous ejecta forming the compact jet.
| Component | Parameter | OBS 1 | OBS 2 | OBS 3 |
|---|---|---|---|---|
| DiskBB | [keV] | |||
| DiskBB | Norm | |||
| CompST | [keV] | |||
| CompST | ||||
| Powerlaw | ||||
| Gaussian | [keV] | 6.4* | ||
| Gaussian | [keV] | |||
| Gaussian | W [eV] | 66.44 | 87.76 | 70.44 |
| (NDF) | 0.82 (77) | 0.96 (78) | 0.99 (80) | |
| Component | Parameter | OBS 4 | OBS 5 | OBS 6 |
| DiskBB | [keV] | |||
| DiskBB | Norm | |||
| CompST | [keV] | |||
| CompST | ||||
| Powerlaw | ||||
| Gaussian | [keV] | 6.4* | ||
| Gaussian | [keV] | |||
| Gaussian | W [eV] | 91.15 | 91.78 | 86.93 |
| (NDF) | 1.12 (80) | 1.19 (83) | 0.82 (80) | |
In Figure 6, the 15 GHz radio surface brightness and the X-ray hardness and intensity corresponding with the epochs of H.E.S.S. observation are illustrated in a broader historical context (Pooley 2006)555 http://www.mrao.cam.ac.uk/~guy/ . The H.E.S.S. observations started approximately one week before the end of a long radio-loud plateau and were triggered by a transient dip in radio flux whilst the plateau end was not yet reached. The plateau ended about two days after the last H.E.S.S. observation, followed by a radio and X-ray flare ten days later.
In summary, GRS 1915+105 remained in a radio-loud state with steady, mildly relativistic jets at the time of H.E.S.S. observations without clear signs of a state transition.
A.2 Cir X-1
The HID for Cir X-1 is shown in Figure 9. An extensive study, examining ten days out of the 16.55 orbital period was performed by Shirey et al. (1999a) in 1997; the corresponding RXTE data are indicated with orange symbols on figure 9. The study focused on the toroidally distributed data plotted in the lower right part of the HID. Shirey et al. (1999a), studied the spectral and temporal X-ray evolution of Cir X-1 along three distinct branches (horizontal, normal, flaring) in the HID. This evolution occurred during a half-day period, approximately one day after periastron and was repeated few days later. Such behaviour is typical of a ”Z source”.
In Shirey et al. (1999a), the periastron passage corresponds to the data at low flux and hardness (dipping episode, lower-left part of the cycle). Data contemporaneous to the H.E.S.S. observations (MJD 53174-6) are indicated by symbols and exhibit low X-ray intensity and hardness values. They span two days starting 19 hours after the periastron, which coincides with the orbital range explored by Shirey et al. (1999a), but in a much fainter X-ray luminosity context.
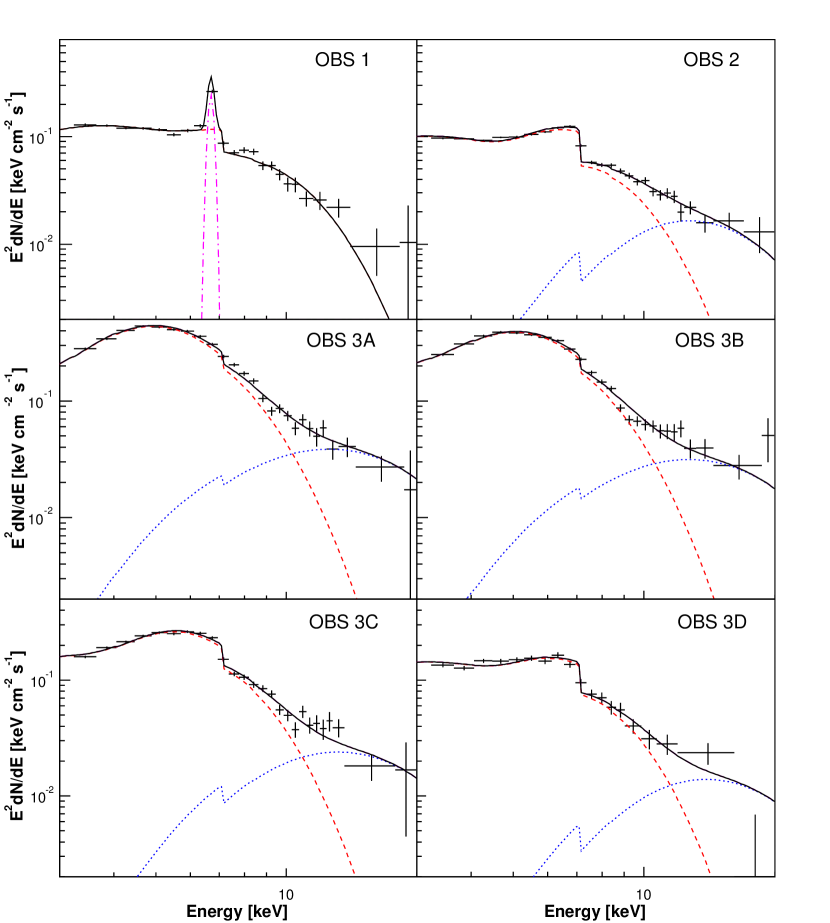
Inspection of the keV PCA spectra shown in Figure 10 reveals that the observed flux variability is accompanied by marked variations in spectral shape. For the third observation, individual spectra were extracted from the four regions (A to D) shown in Figure 2 (bottom-right panel), segregated on the basis of average keV count rates. Fitting of the spectral data from the third observation employed a similar approach to that of Shirey et al. (1999b) with the unabsorbed continuum modelled using a disk black-body component (DiskBB in XSPEC) at low energies in combination with a single temperature black body (Bbody) that dominates above keV.
Previous observations of Cir X-1 during periastron dips (e.g. Shirey et al. 1999b; Schulz et al. 2008) reveal the evidence of strong, complex, and variable intrinsic X-ray absorption. Consequently, diagnosis of the system behaviour during the third RXTE observation is critically dependent upon whether the observed variability represents a genuine change in the underlying continuum emission or is simply an artefact of varying absorption. Accordingly, two components are used to separately simulate intrinsic and extrinsic X-ray absorption characteristics. The bipartite intrinsic absorption is treated using a partial covering model (Pcfabs), while a simple photoelectric model (Wabs) simulates the absorbing effect of the interstellar medium. Adopting a weighted average of the neutral hydrogen data of Kalberla et al. (2005) calculated using the nH ftool, a fixed effective hydrogen column with was assumed for the Wabs component. This assumption is consistent with an estimate of the surrounding interstellar medium density used by Tudose et al. (2006) to model the evolution of the radio nebula of Cir X-1.
In order to constrain the origin of the observed spectral variability, a joint fit was performed using the complete best-fitting model. Initially, the continuum and extrinsic absorption components (DiskBB, Bbody, Wabs) were constrained to be equal for all individual spectra, while the component related to intrinsic absorption (Pcfabs) was allowed to vary independently. Although this model provides a reasonable fit to the observational data (), allowing the normalisation of the Bbody component to vary between observations improves the fit quality somewhat, yielding . The parameters that result from fitting this more relaxed model are listed in Table 7. A statistical comparison of the alternative model fits using the F test yields a probability that the observed improvement in fit quality would be obtained even if the more restrictive model was correct. This marginal evidence for variation of the Bbody component normalisation might indicate rapid fluctuations of the X-ray continuum above keV. However, the available data cannot exclude an alternative scenario in which apparent changes in the fitted Bbody parameters arise purely from imperfect modelling of substantial variations in the intrinsic X-ray absorption with no requirement for genuine evolution of the underlying continuum.
Table 8 lists the parameters of the spectral fits obtained from the first and second observations. A similar continuum model to that obtained from the third observation also provides a good fit () to the spectrum obtained during the second observation. In contrast, the spectrum obtained during the first observation is more appropriately described by a single, heavily absorbed disk black-body component with large correlated residuals around keV statistically favouring the addition of a Gaussian line component. This continuum variability is consistent with the results of Shirey et al. (1999a) who found that significant variation of the continuum parameters could occur on timescales of a few hours.
Overall, the RXTE data reinforce the accepted paradigm of enhanced mass transfer during the periastron passage of the compact primary with the strong and variable intrinsic absorption attributed to obscuration by a turbulent accretion flow (see e.g. Oosterbroek et al. 1995; Murdin et al. 1980; Iaria et al. 2001). A marked disparity between best-fitting model components and parameters of the first and second observations implies a dramatic evolution of the local radiative environment. A decrease in continuum luminosity accompanied by a similar reduction of the intrinsic absorption column suggests a significant decrease in the mass transfer rate. Subsequent fluctuation in the inferred magnitude of the absorption column during the third observation is indicative of dispersion or reorganisation of the recently accreted material.
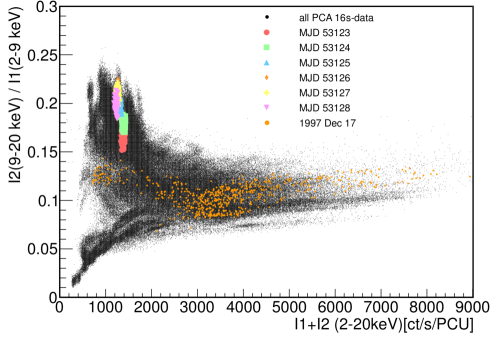
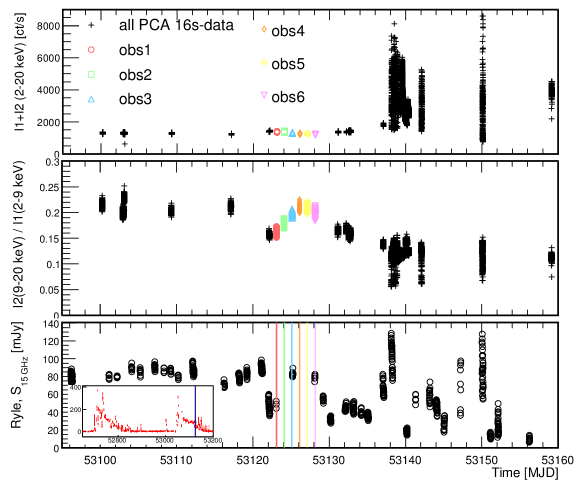
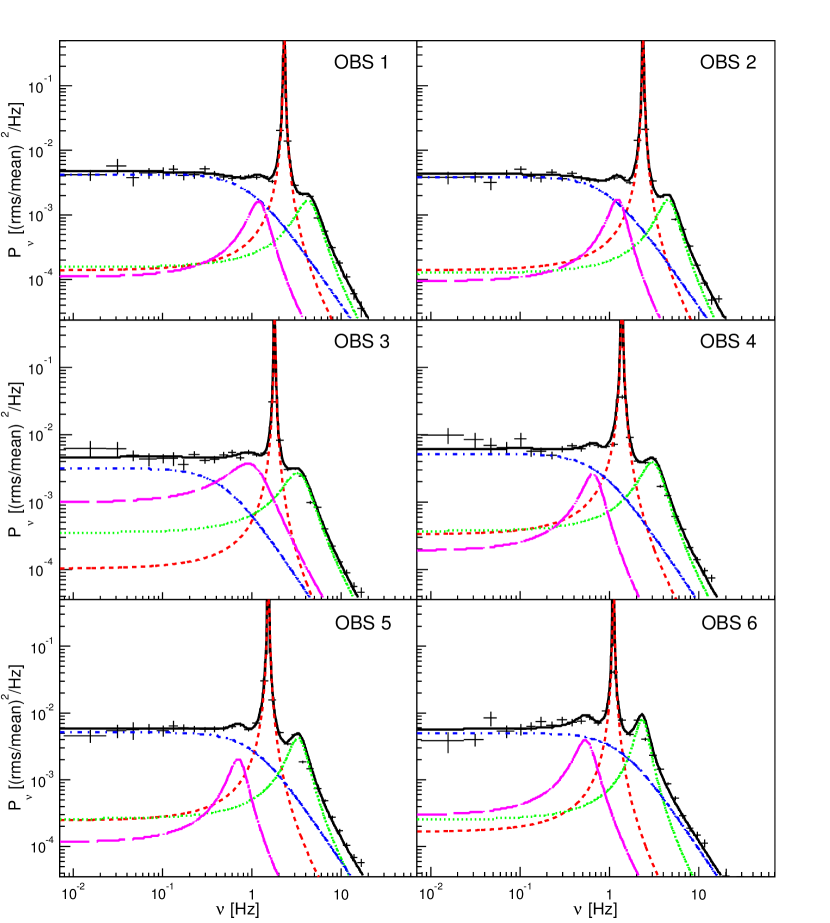
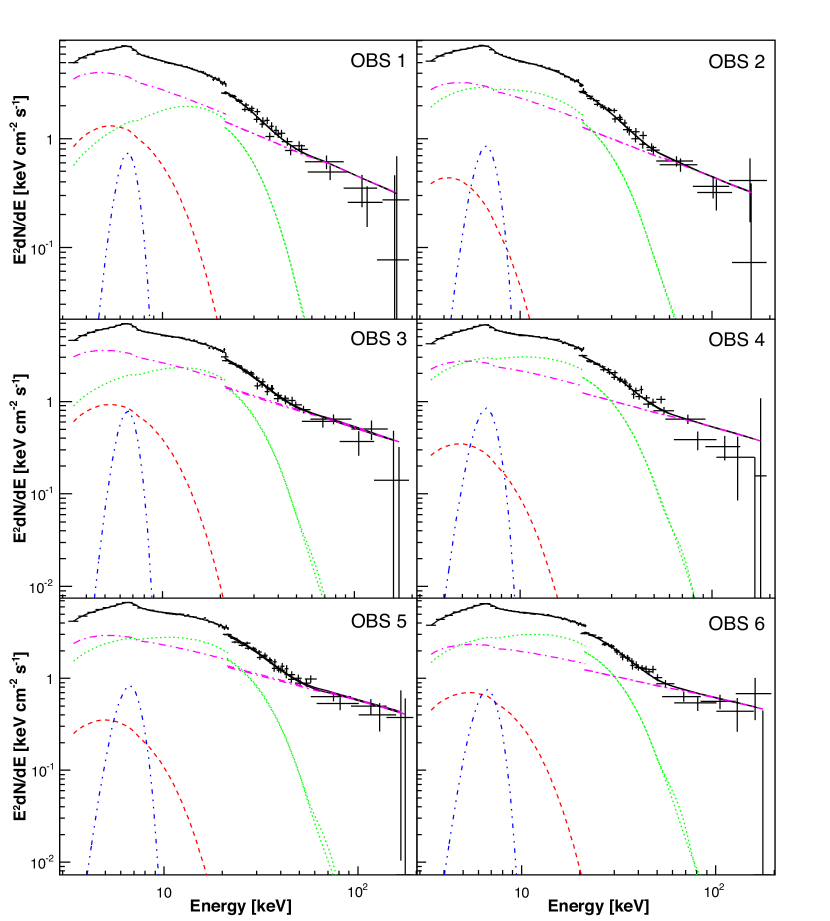
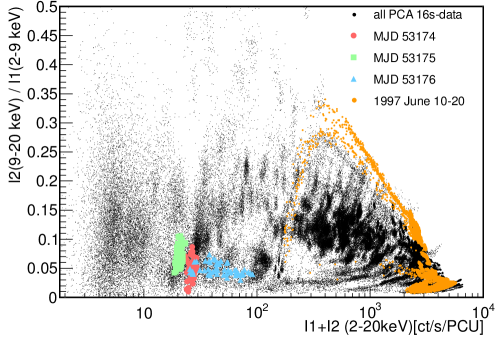
| Component | Parameter | OBS 3A | OBS 3B | OBS 3C | OBS 3D |
|---|---|---|---|---|---|
| DiskBB | [keV] | Joint fit | |||
| Norm | |||||
| Bbody | [keV] | Joint fit | |||
| Norm | |||||
| Pcfabs | [] | ||||
| CvrFract | |||||
| (NDF) | 1.27 (145) | Joint fit | |||
| Model flux | [erg cm-2s-1] | ||||
| Component | Parameter | OBS 1 | OBS 2 |
| () | () | ||
| DiskBB | [keV] | * | |
| Norm | * | ||
| Bbody | [keV] | - | |
| Norm | - | ||
| Pcfabs | [] | ||
| CvrFract | |||
| Gaussian | [keV] | - | |
| [keV] | - | ||
| Norm | - | ||
| (NDF) | 1.07 (34) | 1.22 (36) | |
| Model flux | [erg cm-2s-1] |