Evidence for the magnetar nature of 1E 161348–5055 in RCW 103
Abstract
We report on the detection of a bright, short, structured X-ray burst coming from the supernova remnant RCW 103 on 2016 June 22 caught by the Swift/Burst Alert Telescope (BAT) monitor, and on the follow-up campaign made with Swift/X-Ray Telescope, Swift/UV/Optical Telescope and the optical/near infrared (NIR) Gamma-ray Burst Optical and Near-infrared Detector. The characteristics of this flash, such as duration and spectral shape, are consistent with typical short bursts observed from soft gamma repeaters. The BAT error circle at 68 per cent confidence range encloses the point-like X-ray source at the centre of the nebula, 1E 161348–5055. Its nature has been long debated due to a periodicity of 6.67 h in X-rays, which could indicate either an extremely slow pulsating neutron star, or the orbital period of a very compact X-ray binary system. We found that 20 min before the BAT trigger, the soft X-ray emission of 1E 161348–5055 was a factor of 100 higher than measured 2 yr earlier, indicating that an outburst had already started. By comparing the spectral and timing characteristics of the source in the 2 yr before the outburst and after the BAT event, we find that, besides a change in luminosity and spectral shape, also the 6.67 h pulsed profile has significantly changed with a clear phase shift with respect to its low-flux profile. The UV/optical/NIR observations did not reveal any counterpart at the position of 1E 161348–5055. Based on these findings, we associate the BAT burst with 1E 161348–5055, we classify it as a magnetar, and pinpoint the 6.67 h periodicity as the magnetar spin period.
keywords:
— X-rays: general — X-rays: individual: 1E 161348-50551 Introduction
RCW 103 is a shell supernova remnant (SNR) of 9 arcmin apparent diameter, expanding at around 1100 km s-1, with an estimated age between 1350 and 3050 yr (Carter et al. 1997), and at a distance of 3.3 kpc (Caswell et al. 1975). Frank et al. (2015) gave a detailed, spatially resolved, account of the X-ray emission of the SNR, that can be modelled with an absorbed, non-equilibrium ionization state (NEI) plane shock model, with an average temperature of 0.58 keV and an absorbing column density = 0.95 1022 cm-2. The relative abundance of the most important metals (Ne, Mg, Si, S, and Fe) is generally found to be half the equivalent solar value, reflecting the stronger contribution of the metal-poor circumstellar medium emission with respect to the expected metal-rich ejecta.
The compact soft X-ray source 1E 161348–5055 (hereafter 1E 1613), which is the neutron star (NS) born from the core-collapse supernova explosion, lies nearly at the centre of the SNR. The association between the central compact object (CCO) and the SNR is proved by a depression of 1 arcmin in the Hi emission of the SNR, which is positionally and kinematically coincident with the location of the CCO (Reynoso et al. 2004). However, the CCO has no confirmed counterpart at other wavelengths.
The X-ray luminosity of 1E 1613 can vary by more than one order of magnitude on a time-scale of years in the range 1033–1035 erg s-1 (De Luca et al. 2006). The X-ray spectrum is rather soft, and it can be well described either by the sum of two blackbodies with temperatures of 0.5 keV (and corresponding emitting radius, of few hundred metres) and 1.0 keV ( tens of metres), respectively, or by the sum of a soft black-body of 0.5 keV and a steep power-law of photon index 3 (De Luca et al. 2006; Esposito et al. 2011). One of its most enigmatic features is a periodicity of 6.67 h found in a long XMM-Newton observation of the source (De Luca et al. 2006). It is debated if the periodicity refers to the rotational period of an extremely slow, and peculiar, NS, or it is an orbital modulation of an accreting compact X-ray binary system. In the first hypothesis the NS should have an extreme magnetic field ( 1013–1015 G) as is typical of the so-called magnetar systems. This could possibly explain the very long spin period because of a large spin-down due to the interaction with a fossil disc formed from the debris of the supernova (SN) explosion. In the latter case the system would be a quite odd example of a very young low-mass X-ray binary system, even if the requirement of an extreme magnetic field is probably still needed (De Luca et al. 2006; Li 2007; Pizzolato et al. 2008; Bhadkamkar & Ghosh 2009; Ikhsanov et al. 2013).
In this paper, we report on the recent discovery of a bright X-ray flash observed on 2016 June 22 with the Swift/Burst Alert Telescope (BAT) instrument (D’Aì et al. 2016) from the RCW 103 region. The position of the hard X-ray source responsible for the X-ray flash, labelled SGR 1617-5103, is compatible with the position of 1E 1613 (D’Aì et al. 2016; Stamatikos et al. 2016). We present a detailed spectral and timing study of the X-ray emission of 1E 1613 before and after the BAT trigger, finding the CCO in an outburst state. We also report on the search for a transient UV/optical/NIR counterpart with the Gamma-Ray Optical and Near-infrared Detector (GROND; Schady et al. 2016) and Swift/UV/Optical Telescope (UVOT) to the outbursting source, finding only upper limits at the position of the CCO. We propose the identification of SGR 1617–5103 with 1E 1613 and we discuss the implications of this discovery for constraining the nature of 1E 1613.
2 OBSERVATIONS, DATA REDUCTION, AND ANALYSIS
The Swift (Gehrels et al. 2004) satellite was launched in 2004 with the primary goal of detecting gamma-ray bursts. The scientific payload of Swift comprises three different instruments: BAT (Barthelmy et al. 2005), a coded mask telescope sensitive to photons in the 15–350 keV range and with a 2 sr field of view, the X-ray Telescope (XRT; Burrows et al. 2005), that covers the soft X-ray range (0.3–10 keV) with a field of view 23.6 arcmin and the UV/Optical telescope (UVOT; Roming et al. 2005), that with different filters can cover the 1270–6240 Å wavelength range on a 17 17 arcmin2 field of view. Swift/X-Ray Telescope (XRT) can perform X-ray observations in imaging mode with a 2.5 s frame-time (Photon Counting mode, PC) or in Windowed Timing (WT) mode at a higher timing resolution of 1.8 ms.
We performed data extraction and reduction using the heasoft software (v. 6.19) developed and maintained by the NASA High Energy Astrophysics Science Archive Research Center (heasarc). We used xspec v. 12.9.0 for spectral analysis. Spectra are re-binned to a minimum of 20 counts per energy channel to allow use of statistics. Errors on spectral parameters are given at 90 % confidence level ( = 2.706). Luminosities are given assuming isotropic emission and a distance of 3.3 kpc.
2.1 BAT analysis and results
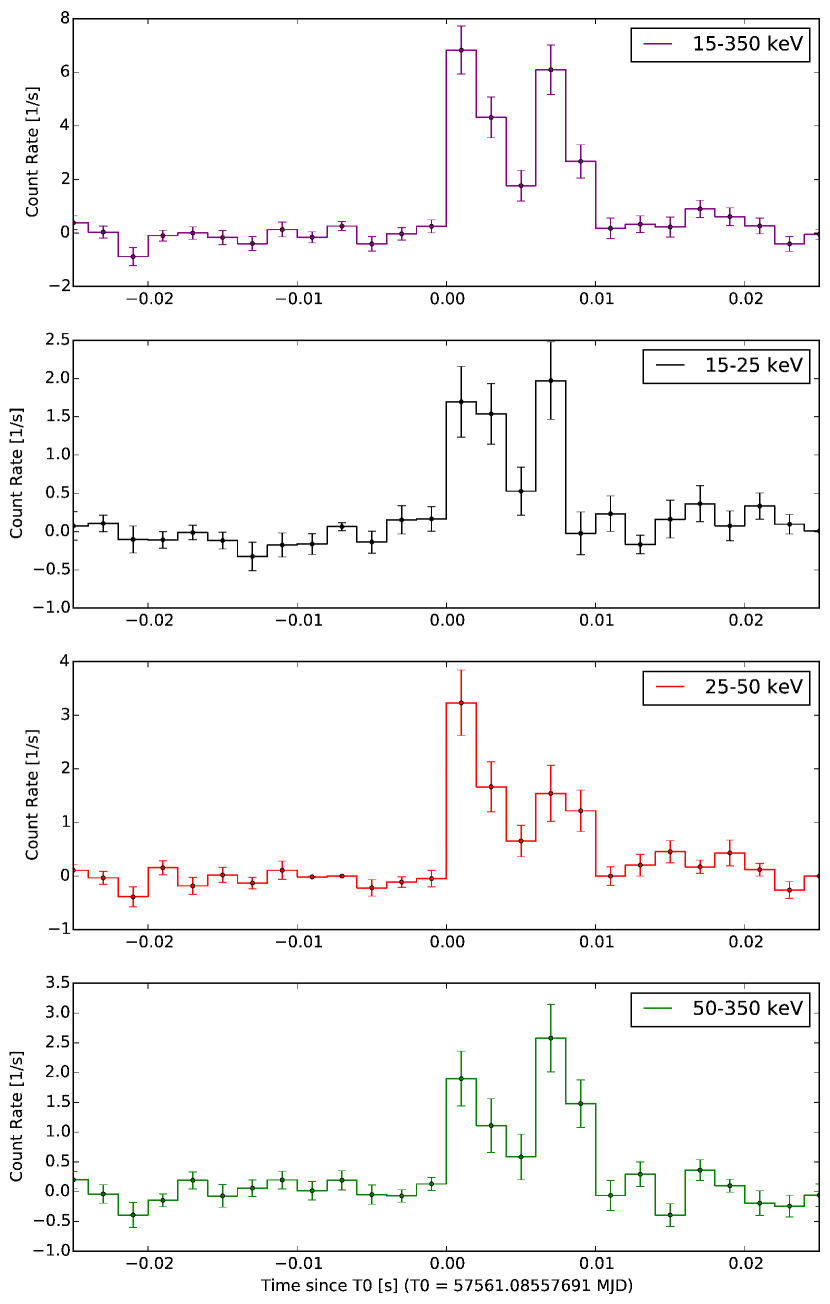
BAT triggered on SGR 1617–5103 at 02:03:13.845 ut on 2016 June 22 ( = 57561.08557691 MJD). The BAT mask-weighted light curve shows a structured short pulse with (the time over which a burst emits from 5% of its total measured counts to 95%) of 8.0 4.5 ms. In Fig. 1 we show the burst profile in some energy-selected bands with a time resolution of 2 ms. The profile is consistent with a single double-peaked burst or, possibly, with two consecutive, very close, shorter bursts.
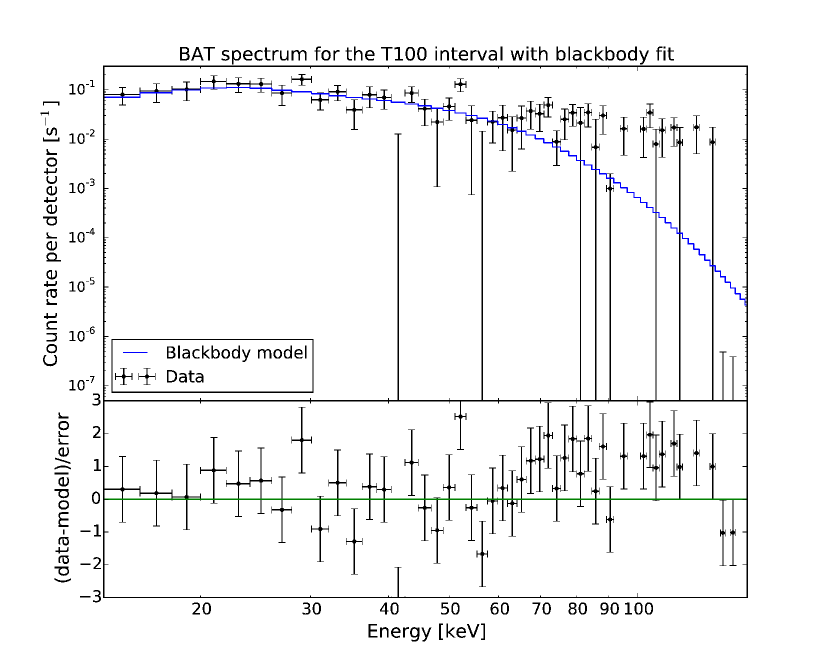
We fitted the time-averaged BAT spectrum from to +10 ms using a power-law model. The spectral fit shows a power-law photon index of 2.38 0.21 and a fluence (15–150 keV) of , with a reduced chi-squared () of 1.55 for 57 degrees of freedom (dof). A blackbody model provides a significantly better description of the data, with a of 1.18 for 57 dof (Fig. 2). The blackbody temperature is = 10.3 1.3 keV, the blackbody radius is 1.2 0.2 km, and the corresponding fluence (15–150 keV) is 1.51 0.24 10-8 erg cm-2, which translates for a distance of 3.3 kpc into an isotropic total energy release of (2.0 0.3) 1037 erg. A time-resolved fit from to +5 ms and from +5 to +10 ms, is consistent for both intervals with a thermal blackbody emission of temperature = 8.7 1.7 and = 10 keV, and a blackbody radius 1.7 and 0.9 km for the first and second peak, respectively.
The BAT ground-calculated position is RA, Dec. = 244.∘385, –51.∘047, with an uncertainty of 2.0, 1.7, and 1.2 arcmin for 95, 90 and 68 per cent containment, respectively. The partial coding was 71 per cent.
2.2 XRT analysis and results
Swift/XRT observed RCW 103 both in PC and WT modes. In this work we will focus only on the X-ray emission coming from the central object inside the RCW 103 nebula, so we extracted the high-level scientific products using a circular region of 20-pixel radius (1 pixel = 2.36 arcsec) at the most accurate coordinates of 1E 1613 (RA = 244.400958, Dec. = –51.040167; De Luca et al. 2008). Photon arrival times were corrected to the Solar system barycentre using these coordinates with the barycorr tool. For observations in PC mode, when the count rate inside this region was 0.5 counts s-1 (cps), we adopted an annular extraction region of 3–5 pixels inner radius, depending on the source brightness, and 20 pixel outer radius to take into account pile-up effects. Light curves are corrected for vignetting, bad columns, and point spread function (PSF) extraction regions using the xrtlccorr tool.
Swift/XRT has regularly observed the field of RCW 103 since the start of the mission. Esposito et al. (2011) examined the observations spanning the period 2006–2011, finding that 1E 1613 had an average 1–10 keV flux of 1.7 10-12 erg cm-2 s-1, modulated at the 6.675 h (24030 s) period. For the aims of the present work, we examined all observations performed after 2014 January, in order to have a statistically robust benchmark of the quiescent state of 1E 1613 before the BAT trigger. Swift monitored the RCW 103 nebula with a visit of few ks per month till 2016 June, while starting from 2016 June 22, after the detection of the BAT X-ray burst, Swift began an intense observing campaign, collecting a total of 63.4 ks exposure time between 2016 June 22 and 2016 July 12. We present in Table 1 a summary of all the observations analysed for this work.
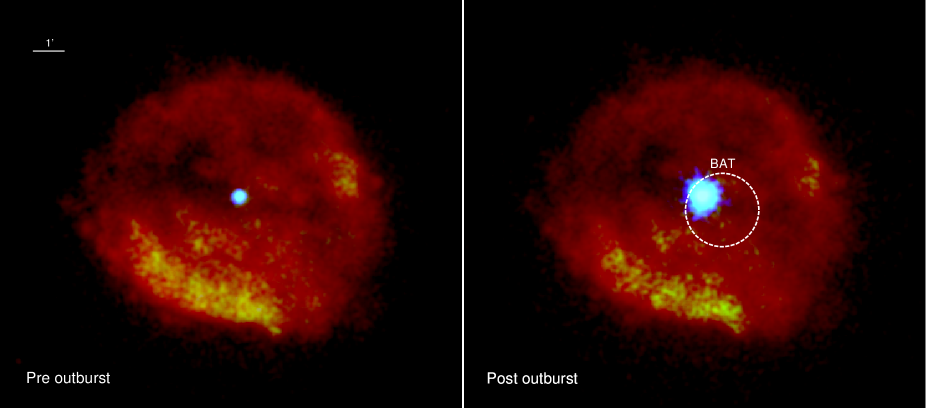
In Fig. 3 we show a false-colour image of the field of RCW 103 in three energy bands (0.5–1.5, 1.5–2.5, and 2.5–10.0 keV), obtained by stacking all the PC mode observations of Table 1 before (left-hand panel) and after (right-hand panel) the BAT trigger. The right-hand image shows the BAT error circle, at the 68% confidence level, of the short X-ray burst of June 22, that is consistent with the position of 1E 1613. It is clear that this source brightened after June 22, whereas no other new point-like source, and no extended brightening of any part of the nebula appears as a possible, alternative, soft X-ray counterpart candidate of the BAT burst.
We show the 2–10 keV 1E 1613 light curve in Fig. 4, where each point is the time-averaged count rate in one observation identification number (ObsID, see Table 1). In the period 2014 January – 2016 May the source flux remained at an approximate constant low flux level with an observed average flux of 2.7 10-12 erg cm2 s-1 for the entire period (the unabsorbed flux is 8.2 10-12 erg cm2 s-1). It is important to note that the observation, ObsID 00030389032, was performed about 20 min before BAT detected the short burst, and in this observation the source was already about two orders of magnitude brighter than in all previous observations (the closest being the ObsID 00030389030 performed on May 16). All the observations performed after June 22 clearly show 1E 1613 in a brighter state, confirming an ongoing outburst state. Both the quiescent and the active state emission are modulated at the 6.67 hr periodicity (see Section 2.3), which accounts for most of the variance observed in all the ObsIDs (see last column in Table 1). However, we note that the average rates during June 22 are significantly higher with respect to the following days, and they are not due to periodic modulation but imply an intrinsically brighter state. The light curve suggests an almost exponential decay on the day BAT detected the burst, and a fit of the light curve with observations performed between June 22 and 23 results in a decay time of 1.3 0.3 d.

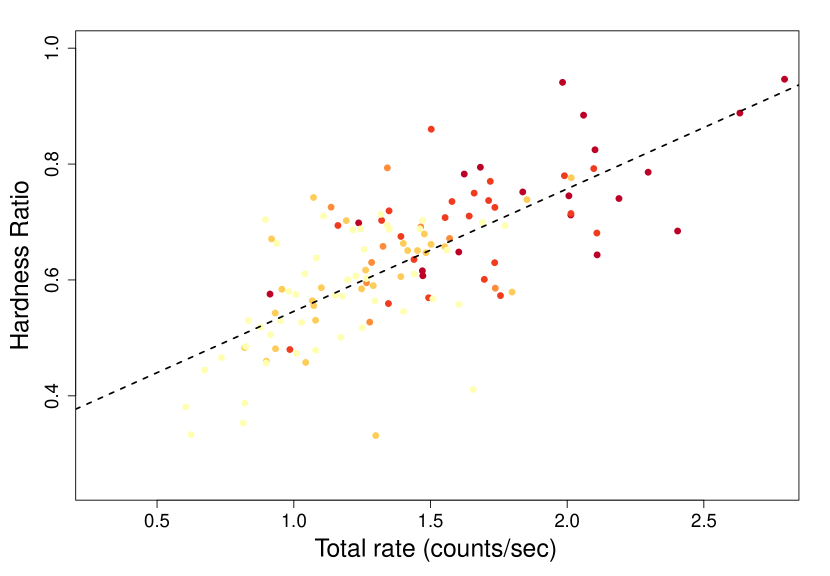
We then extracted two energy-filtered light curves in the 1.0–3.0 and 3.0–10.0 keV bands using all PC mode observations with a bin size of 1 ks after the burst event to study the spectral hardness ratio as a function of the total rate and time. We found that the total rate is significantly correlated with the spectral hardness (Pearson correlation coefficient 0.7 0.1 at 95 per cent confidence level), while there is insignificant evolution as a function of time, besides the relative higher brightness and corresponding higher hardness ratio values in the first day of the outburst as shown in Fig. 5.
| ObsID (mode) | – | Exposure | Mean rate | |
| (tt) | (s) | (10-2 cps) | (cps) | |
| Pre-outburst observations | ||||
| 00030389004–00030389030 | 2014-01-15 07:17:00 2016-05-16 15:37:54 | 44480 | 2.9 | 3.2 |
| June 22 observations | ||||
| 00030389032 (PC) | 2016-06-22 01:31:47–2016-06-22 01:42:54 | 644 | 204 | 34 |
| 00700791000 (WT) | 2016-06-22 02:05:00–2016-06-22 03:40:49 | 2222 | 161 | 27 |
| 00700791001 (WT) | 2016-06-22 04:37:34–2016-06-22 12:46:52 | 4278 | 101 | 32 |
| 00700791001 (PC) | 2016-06-22 08:14:10–2016-06-22 13:15:26 | 2163 | 95 | 21 |
| 00700791002 (PC) | 2016-06-22 14:31:46–2016-06-23 01:49:31 | 6398 | 68 | 28 |
| Late-time outburst observations | ||||
| 00700791003 (PC) | 2016-06-23 03:34:40–2016-06-23 11:35:35 | 4932 | 73 | 26 |
| 00700791004 (PC) | 2016-06-24 15:55:27–2016-06-24 20:42:54 | 4260 | 60 | 29 |
| 00700791005 (PC) | 2016-06-25 04:29:35–2016-06-25 09:27:27 | 3551 | 56 | 18 |
| 00700791006 (PC) | 2016-06-26 02:48:57–2016-06-27 00:01:53 | 3529 | 50 | 15 |
| 00700791007 (PC) | 2016-06-27 10:47:59–2016-06-27 14:26:54 | 4924 | 43 | 18 |
| 00700791008 (PC) | 2016-06-28 01:03:52–2016-06-28 15:32:13 | 4652 | 51 | 24 |
| 00700791009 (PC) | 2016-06-30 02:29:07–2016-06-30 04:04:34 | 737 | 29 | 12 |
| 00700791010 (PC) | 2016-07-02 07:23:01–2016-07-02 13:51:53 | 4472 | 55 | 19 |
| 00700791011 (PC) | 2016-07-04 13:24:56–2016-07-04 19:40:44 | 2090 | 41 | 21 |
| 00700791012 (PC) | 2016-07-06 14:42:44–2016-07-06 23:15:54 | 3079 | 46 | 16 |
| 00700791013 (PC) | 2016-07-08 05:12:33–2016-07-08 10:13:53 | 4170 | 44 | 17 |
| 00700791014 (PC) | 2016-07-10 11:13:18–2016-07-11 00:01:53 | 3901 | 45 | 20 |
| 00700791015 (PC) | 2016-07-12 09:33:02–2016-07-12 06:27:54 | 3421 | 50 | 23 |
We extracted a time-averaged spectrum for all observations between 2014 January 15 and 2016 May 16 (quiescent spectrum, PRE), and a time-averaged spectrum for all the PC mode observations after June 22 (late-time outburst spectrum, POST). We verified that no statistically significant spectral change occurred along the 3-week long Swift/XRT follow-up on a week-averaged time interval. We studied observations taken on June 22 individually to determine short-term intrinsic rapid spectral and luminosity variations.
Because 1E 1613 is embedded in the SNR nebula, we modelled the nebular emission as an additive component to the total spectrum, adopting the pshock component following Frank et al. (2015). The pshock model is a constant temperature, plane-parallel shock plasma model, characterized by the following parameters: the plasma temperature (), the abundance of the most diffuse elements (Abund), the lower and upper limit on the ionization time-scale ( and , where = and is the electron density in the post-shock region) and a normalization value, =EM/, related to the angular diameter distance to the source expressed in cm () and the emission measure (EM=). In our fits we froze the value to its default ( = 0). Finally, we choose a background region outside the RCW 103 nebula in a zone free of other contaminating sources.
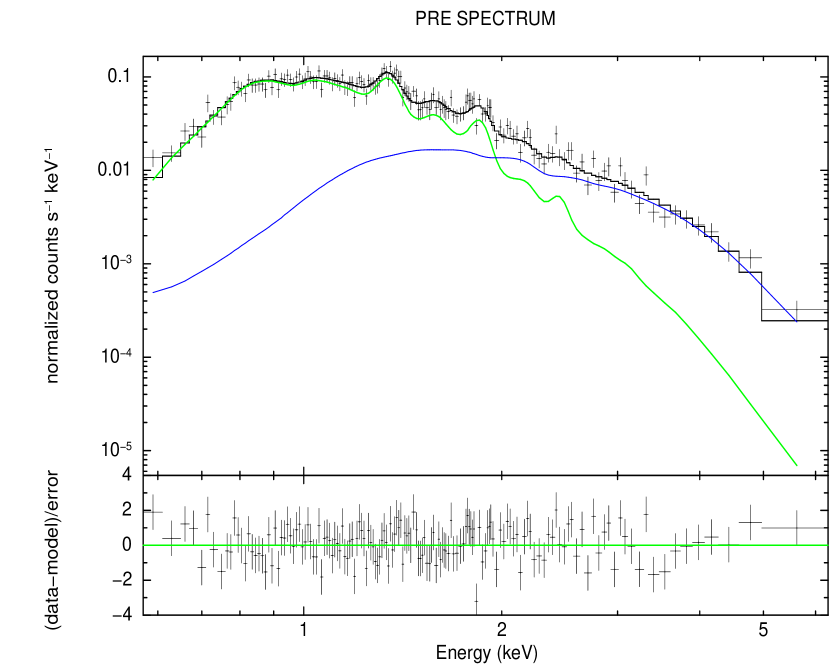
For the quiescent spectrum, the emission from 1E 1613 is modelled with a blackbody. Both the nebular and compact components are absorbed by interstellar matter [we used phabs, with Asplund et al. (2009) abundances and Verner et al. (1996) cross-sections]. The values for the nebular emission are consistent with the values reported in Frank et al. (2015), while the compact emission is well described by a soft thermal component of 0.58 0.05 keV temperature, whose corresponding emitting radius is 0.44 km. The for this model is 0.98 (175 dof). We report spectral best-fitting parameters and errors in the left-hand column of Table 2 and data, best-fitting model and residuals of this best fit in the left panel of Fig. 6. We verified that this spectral decomposition is solid against different extraction regions. By taking different extraction radii, the only spectral parameter that must be allowed to vary to obtain satisfactory fits ( 1) is the pshock normalization value.
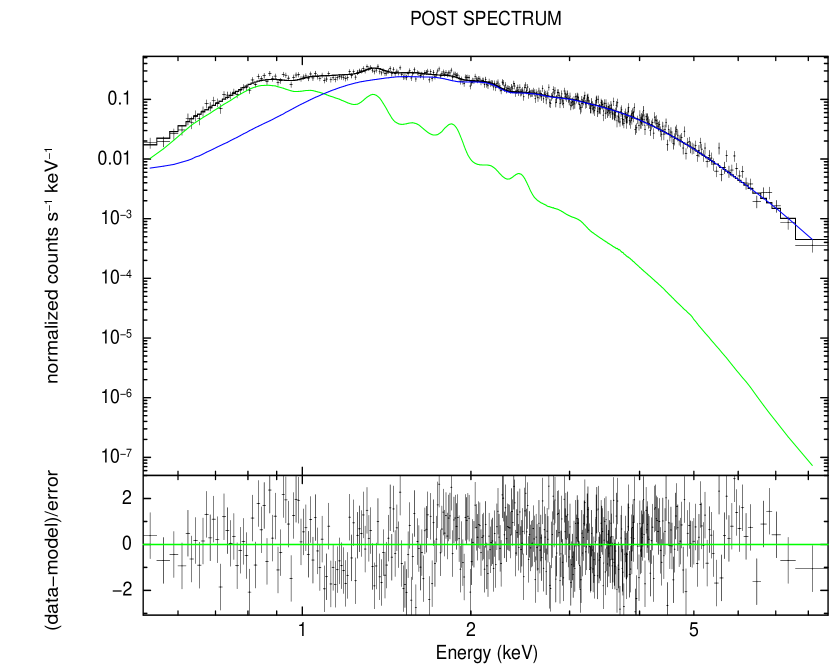
With respect to the quiescent spectrum, the late-time (from June 23 to July 12) time-averaged outburst spectrum shows a change both in luminosity and in spectral shape, the most evident aspect being the presence of an excess of flux at harder X-ray energies. To better constrain these changes, we performed first a fit of the post-outburst spectrum fixing the values of the pshock component to the best-fitting values of the pre-outburst spectrum; in a second step, we made a combined fit of the pre- and post-outburst spectra with the values of the pshock component tied together for the two spectra. In both cases, we allowed the pshock normalization free to vary to take into account the different extraction regions. We assumed that the nebular emission is not able to promptly respond and be modified by the CCO X-ray outburst, also because the extraction radius used to build the source spectrum is 2.5 light years at a distance of 3.3 kpc. We then modelled the post-outburst hard excess component, applying to the compact thermal emission a convolution Comptonized kernel (simpl model in xspec, Steiner et al. 2009), that upscatters a fraction of the blackbody photons (simpl parameter) into a power law of photon index . The luminosity of the compact emission (simpl*bbody component) increased by a factor of 20 (0.5–10 keV range), while the blackbody temperature is consistent with its pre-outburst value. About 10 per cent of the photons are up-scattered, giving rise to the hard X-ray excess. We report the spectral best-fitting parameters and errors for the different fits in Table 2 and data, best-fitting model and residuals of the pre- and post-outburst spectra in Fig. 6. We note that both methods, with frozen, or with tied pshock parameters, lead to very similar results.
Alternatively, a statistically similar fit can be obtained by removing the simpl component and adding a power law. In this case, we obtained a best-fitting photon index of 0.9, a power-law luminosity of 0.77 0.13 1034 erg s-1, while the bbody temperature is 0.64 0.10 keV and its luminosity is (5.7 0.3) 1034 erg s-1.
| Parameter | Units | PRE | POST | COMBINED FIT (PRE) | COMBINED FIT (POST) |
|---|---|---|---|---|---|
| 1022 cm-2 | 1.23 | 1.03 0.06 | 1.19 | ||
| pshock | keV | 0.58 0.12 | 0.58 | 0.58 | |
| pshock | 0.47 | 0.47 | 0.7 | ||
| pshock | 1011 s cm-3 | 2.4 | 2.4 | 2.2 | |
| pshock | 10-2 | 2.428 | 2.4390.004 | 1.6 | 2.6 0.1 |
| pshock Flux | 10-11 erg s-1 | 4.5 1.2 | 4.7 1.0 | 4.4 0.2 | 4.9 0.9 |
| simpl | 2.5 1.5 | 2.6 1.5 | |||
| simpl | 0.11 | 0.12 | |||
| bbody | keV | 0.58 0.05 | 0.62 | 0.52 0.05 | 0.62 |
| bbody | km | 0.44 0.15 | 1.84 0.15 | 0.6 0.2 | 1.84 0.20 |
| bbody | 1034 erg s-1 | 0.27 0.09 | 6.5 0.2 | 0.35 0.1 | 6.3 0.1 |
| simpl*bbody Flux | 10-11 erg s-1 | 5.0 0.1 | 5.1 0.1 | ||
| /dof | 171/175 | 492/410 | 680 / 586 | ||
 |
 |
On June 22, Swift had probably observed 1E 1613 very close to the start, or the peak, of its outburst and observations on this day also registered the highest luminosity values during the whole outburst. In Table 3, we show the best-fitting spectral results for each ObsID, adopting the same model of the late-time outburst spectrum with the pshock and values frozen to the POST best-fitting values of Table 2.
Because of the low statistics, the fit could not well constrain all the parameters, where the main uncertainties affect the shape of the hard X-ray tail. However, there is a clear indication that the X-ray emission softened passing from ObsID 00030389032 to ObsID 00700791000 and the source luminosity rapidly decreased from 3 1035 to 1 1035 erg s-1 in the following observations.
We note that, although Swift/XRT pointed towards 1E 1613 just 100 s after the burst, it collected data for only few seconds and, because of an Earth limb constraint, almost all the data for this ObsID were taken at a later time starting at 03:04:46 ut June 22, about 1 h after the burst, so that this luminosity drop happened in less than 80 min, in a temporal window where BAT detected the X-ray burst.
| Parameter | Units | 00030389032 | 00700791000 | 00700791001 | 00700791002 |
|---|---|---|---|---|---|
| simpl | 1.4 | 3.1 | 3.9 | 1.15 | |
| simpl | 0.55 | 0.53 | 0.18 | 0.41 | |
| bbody | keV | 0.69 | 0.58 | 0.58 | 0.60 |
| bbody | km | 3.1 2.5 | 3.0 1.7 | 2.7 0.6 | 2.6 0.7 |
| bbody | 1034 erg s-1 | 28 2 | 13 4 | 9.7 0.6 | 11 3 |
| /dof | 33/31 | 137/135 | 201/197 | 145/157 |
2.3 XRT timing analysis
We searched for periodicities in the Swift/XRT data. For the set of observations spanning the pre-outburst period, we clearly detected through folding search and also through a Lomb-Scargle periodogram the known periodicity at 6.675 h. Because of the short time frame after the June 22 event, no clear detection was possible in this time span. To obtain a time-resolved view of the changes in the folded profile, we choose = 55804.0 MJD as reference epoch and = 24030.42 s as folding period (Esposito et al. 2011). We show in Fig. 7 the resulting folded profiles using 32 phase bins. The pre-outburst profile can satisfactorily be described by a simple sine function (upper panel) with an amplitude of 0.50 0.03. The shape and the phase position of the maximum agree with the same profile obtained for the 2006–2011 observations (see fig. 4 in Esposito et al. 2011). In the middle panel of Fig.7 we show the pulse profile for the June 22 observations (excluding obsID 00030389032, because of its relative small exposure and exceptional brightness). Although the folded profile is only sparsely covered, the shape suggests the presence of two antipodal peaks. In the late-time observations, from June 23 to July 12, the profile returns to being single peaked, but it is significantly more structured and with a clear shift in phase ( 0.3) with respect to the pre-outburst profile (see lower panel of Fig. 7). We also note a decrease in the pulsed fraction from 50 to 40 per cent from the pre- to the post-outburst observations. Finally, we studied the spectral hardness as a function of the phase by choosing as reference hard and soft bands the 1–3 and the 3–10 keV ranges. We clearly observed that the profile peaks are significantly harder, in agreement with the general pattern already shown in Fig. 5.

2.4 UVOT analysis
The Swift/UVOT began settled observations of the field around 1E 1613 95 s after the BAT trigger. During the first day of the outburst on June 22, we collected data using all UVOT filters with various exposure times as summarized in Table 4, thus covering the region in the 1700–6800 Å band (Kuin et al. 2015). In the summed images of the , , , and uvw1 filters we detected a source at a distance of 3.5 arcsec which falls partly within the aperture used for the photometry (Fig. 8). This source was also reported in the IR data south of the Chandra position by De Luca et al. (2008), therefore, we masked its emission in all filters (except in the uvw2 band, where there is no excess) to derive our upper limits.
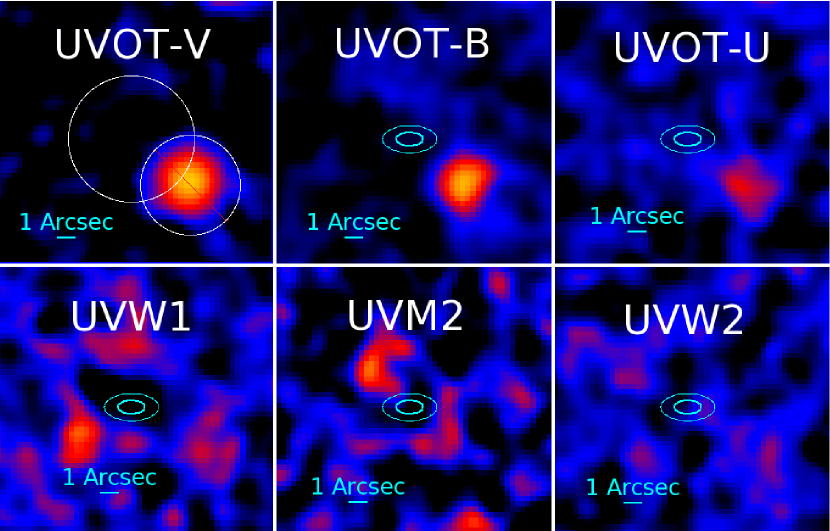
Since 2006 has been monitoring RCW 103, so we extended our analysis to the full available /UVOT data set to derive deeper limits. All UVOT data from 2006 to the present time have been summed and re-sampled at higher resolution (see Table 4). Though the UVOT PSF is only 2.8 arcsec, the re-sampling of more than 40 exposures brings out some finer details. The main result is that both the individual exposures and the summed UVOT images show no evidence for a source at the Chandra position, though possible sources are found at distances larger than 2 arcsec in the and uvw1 (Fig. 8). These were masked for deriving the deeper UV-optical limits at the Chandra position as reported in Table 4. For a more immediate comparison with the IR Hubble Space Telescope () and Very Large Telescope () data analysed in De Luca et al. (2008), we also show the error circles of their Chandra position in Fig. 8. In the summed images of different filters we observe different emission patterns, including sources that have a significance just above 3-, but which appear in only one filter. We interpret this as either being due to a mixed population of hot and cool stars where different stars dominate the emission in the different filters, or due to local variations in interstellar extinction. The uvm2 band is centred on the 2200 Å interstellar dust feature, and some of the differences seen with the uvw1 and uvw2 bands which have lower and higher wavelengths than the uvm2 might be due to differences in the dust column. The deepest UV limits are consistent with the conclusions of De Luca et al. (2008) that a possible binary companion could only be of spectral type later than M. Detected 3 upper limits in the UVOT filters are shown in the last column of Table 4.
2.5 GROND Analysis
GROND (Greiner et al. 2008) began observing the BAT error circle of Swift trigger 700791 at 02:18:19 ut, after a short technical delay, 905 s after the GRB trigger and 308 s after receipt of the BAT position. We obtained 45 min of observations after the trigger, and a second epoch observation 15 d later.
Reduction and analysis were performed within a custom pipeline calling upon iraf tasks (Tody 1993), following the methods described in detail in Krühler et al. (2008) and Yoldaş et al. (2008). Optical observations were calibrated against tabulated GROND zeropoints, whereas the NIR images were calibrated against on-chip comparison stars from the Two Micron All Sky Survey (2MASS) catalogue (Skrutskie et al. 2006).
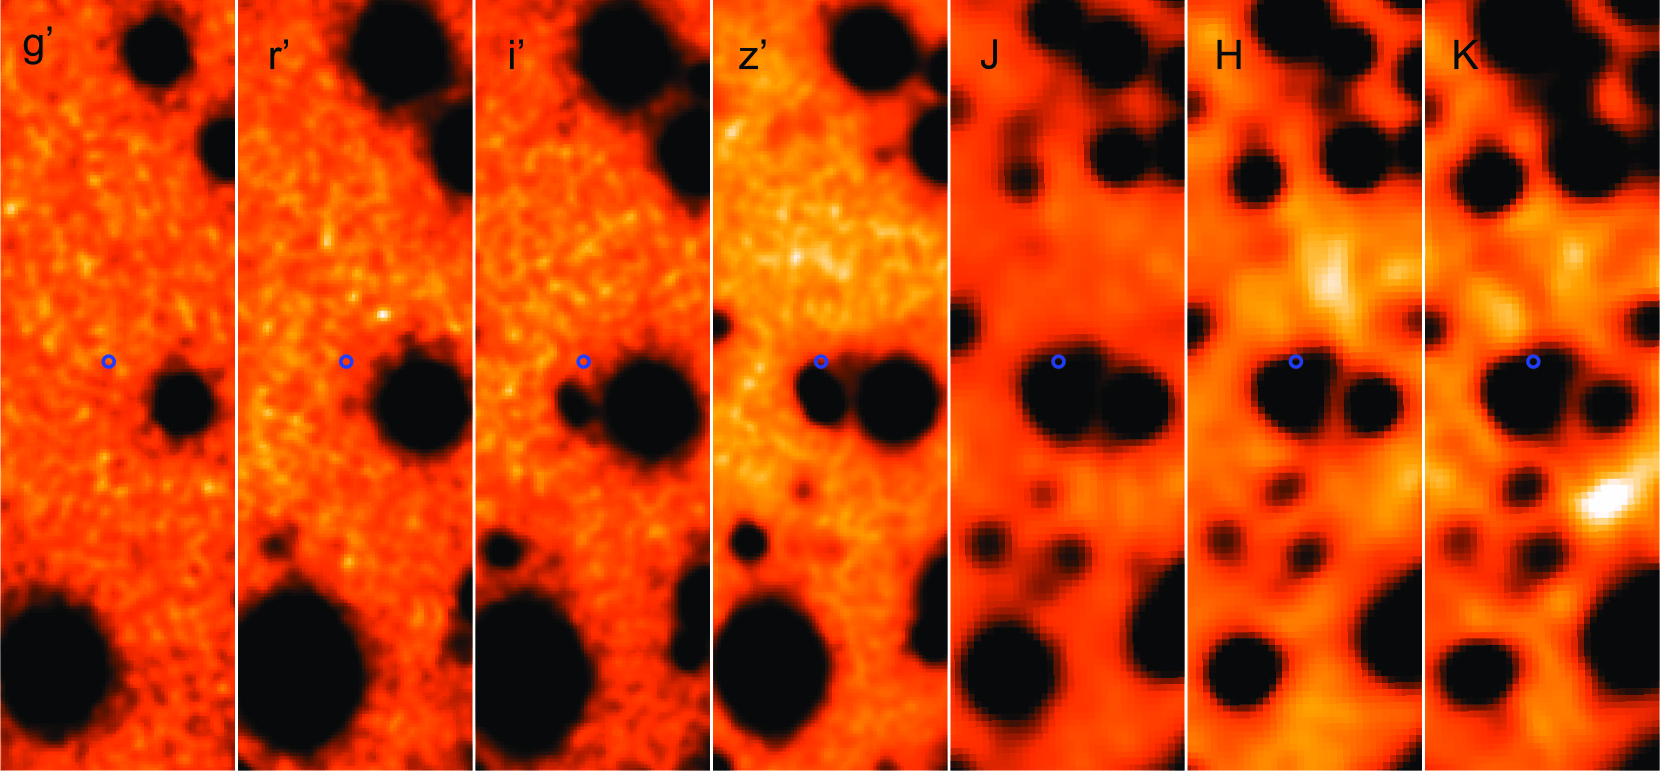
Our observations do not reveal any source inside the Swift/XRT error circle, nor in the Chandra error circle (De Luca et al. 2008) and no NIR flashes at the Chandra position are detected in 1-min images. In comparison to the deep infrared images of that publication, we detect the bright complex of multiple sources to the south of the error circle starting in the band. We show in Fig. 9 the field around 1E 1613, for each examined band. Source in De Luca et al. (2008) is detected in our imaging starting in the band. None of these sources is seen to vary between our observation epochs. No source is detected at the precise position of 1E 1613, especially not the sources - of De Luca et al. (2008), in any GROND band at any time with 3 upper limits on the magnitudes (AB system) for the stacked images of June 22 as reported in Table 4.
| Filter | Central | Exposures (s) | 3 upper limits | ||
|---|---|---|---|---|---|
| Å (UVOT)/ (GROND) | 2016-06-22 | 2006–2016 | 2016-06-22 | 2006–2016 | |
| Swift/UVOT | |||||
| white | 3471 | 1227 | 17635 | 22.65 | 24.08 |
| v | 5468 | 1629 | 4069 | 20.39 | 20.83 |
| b | 4392 | 1082 | 3237 | 21.14 | 21.52 |
| u | 3465 | 808 | 30202 | 21.60 | 23.56 |
| uvw1 | 2600 | 393 | 62597 | 21.38 | 24.51 |
| uvm2 | 2246 | 2030 | 49138 | 22.66 | 24.69 |
| uvw2 | 1928 | 6828 | 49177 | 23.46 | 24.53 |
| GROND optical bands | |||||
| g′ | 0.45869 | 1780.2 | 23.10 | ||
| r′ | 0.62198 | 1780.2 | 23.10 | ||
| i′ | 0.76407 | 1780.2 | 22.39 | ||
| z′ | 0.89896 | 1780.2 | 22.75 | ||
| GROND NIR bands | |||||
| J | 1.23992 | 960.0 | 19.79 | ||
| H | 1.64684 | 840.0 | 18.91 | ||
| K | 2.17055 | 960.0 | 18.70 | ||
Using the best-fitting from the X-ray spectral fit and adopting the Galactic ratio, we infer = 5.8 mag. Using = 0.12 , our -band upper limit corresponds to flux limit of 2 10-13 erg cm-2 s-1 or a -band luminosity limit of 3 1032 erg s-1. Using an X-ray flux at the time of the GROND observation of 3 1035 erg s-1 (interpolated between the Swift/XRT observations), this implies a flux ratio of 1000. We note that the -band flux limits are substantially smaller than the 1035 erg s-1 optical flares seen from Swift J195509.6+261406, speculated to stem from a magnetar (Stefanescu et al. 2008; Castro-Tirado et al. 2008).
3 Discussion
We have reported on the characteristics of the Swift/BAT bright X-ray burst coming from the direction of the RCW 103 nebula observed on 2016 June 22. At the same time, we have also presented spectral and timing results concerning the X-ray activation of the CCO at the centre of the RCW 103 nebula, 1E 1613, and the rapid follow-up in NIR, optical, and UV bands in our search for a possible counterpart at these wavelengths. The long-term X-ray history of this source has already established flux variations of about two orders of magnitude on a years-long time-scale (Gotthelf et al. 1999; De Luca et al. 2006). The last outburst of this source happened between 1999 and 2001, when the source reached an intensity possibly similar to the one observed here (Garmire et al. 2000), and then began a slow return to its pre-outburst luminosity on a years-long time-scale (see fig. 2 in De Luca et al. 2006).
This time we had the chance to closely monitor the start of the outburst and its short-term evolution, because Swift was triggered by the detection of an X-ray burst in the direction of 1E 1613. As the characteristics of this burst (duration, spectral shape, and total fluence) are typical of soft gamma repeaters (SGR; whereas for the same reasons an association with a type-I X-ray burst is ruled out), and, at the same time, 1E 1613 showed a dramatic change in flux, spectral shape and folded profile, we shall consider 1E 1613 as the source originating the burst detected by BAT and take this as evidence for associating this peculiar CCO with the class of the magnetars (Duncan & Thompson 1992; Thompson & Duncan 1993, 1995). We note that a very similar line of evidence was sufficient to grant the magnetar status to a relatively low ( 5 1013 G) magnetic field pulsar, PSR J1846–0258, in Kes 75 (Gavriil et al. 2008).
This discovery makes the small group of CCO objects rather inhomogeneous based on the values of their inferred magnetic fields. CCO sources with -field estimates show rather low values ( 1011 G; Halpern & Gotthelf 2010; Gotthelf et al. 2013) compared to typical values found in young NSs in high-mass binaries. Gotthelf & Halpern (2008) coined the term of anti-magnetars, in antithesis to the supercritical -field values of magnetars, to designate the CCOs hosted in SNRs. Although 1E 1613 was not considered among the CCO sources listed in Halpern & Gotthelf (2010) because of its soft X-ray variability, it still fulfils all the other criteria for a CCO classification. It is most probably a classical high -field ( = 1014–1015 G) ) magnetar (De Luca et al. 2006), and, even considering a scenario where the initial spin-down was driven by an ejector phase of magnetized debris, the required dipole field would still be above 1012 G (Ikhsanov et al. 2013). This suggests that it can be difficult to generalize and assume all CCO objects as young and very low magnetised NSs (see e.g., Gaensler et al. 2001; Vink 2008; Gao et al. 2016, for magnetars hosted in a SNR environment), unless very ad hoc criteria are chosen.
We studied the soft X-ray evolution of the source in the first 3 weeks of the outburst thanks to the monitoring campaign of Swift. The X-ray light curve shows a clear peak just close to the time of the BAT trigger, with a steep decrease in the following hours, until a plateau is reached within 1 d from the X-ray burst. The flux evolution in the following weeks did not show any evident sign of fading, suggesting, as in the previous outburst, a possible slow decay to the pre-outburst luminosity levels. The initial steep decay, and the flatter evolution is similar to what observed in the case of other magnetars outbursts (see e.g. the decay of the SGR 1E 2259+58 in its 2002 June outburst; Woods et al. 2004), and, more generally, closely resembles the behaviour of transient magnetars like the SGR 1627–41, that shows similar flux variations on similar time-scales (Esposito et al. 2008). We tracked the most significant spectral changes using as a benchmark the time-averaged quiescent spectrum of 1E 1613 from the Swift/XRT observations taken about 2 yr prior to 2016 June 22. We did not choose to disentangle the 1E 1613 emission from the contribution of its nebula, because of the intrinsic bias and dependence of the results from the choice of the source and background extraction regions. Instead we modelled both components in a single fit to the data, using the results from the extensive work on the SNR emission made by Frank et al. (2015). In this way, we obtained a statistically acceptable description of the data, and we could constrain at much higher confidence the parameters determining the spectral state of the source. The 1E 1613 emission along all the outburst showed little variation in the time-averaged spectral shape, characterized by a soft thermal component of temperature 0.6 keV and a hard X-ray tail, carrying about 10% of the total source emission. The spectral shape in the first observation of June 22, 20 min earlier than the BAT burst, seems to be harder than the other late-time spectra, but we also note that observations performed a few hours after the BAT event showed a rapid return to the temperature of 0.6 keV that also characterized the pre-outburst spectrum. The outlined spectral characteristics such as peak thermal temperature, harder flux excess during the outburst, time-scale of flux variations are all in agreement with the general properties shown by transient magnetars see e.g. Kaspi et al. 2003; Scholz & Kaspi 2011; Scholz et al. 2012, or these general reviews: Rea & Esposito 2011; Mereghetti et al. 2015; Turolla et al. 2015.
We studied the timing characteristics of the pulsed profile of 1E 1613, comparing the profiles at different times. We remark that, given the short time-span of the observations during the outburst, we were not able to clearly detect the 6.67 h periodicity, however, it is evident that any reasonable change in its value cannot have any statistically significant effect on the folded profile.
A sort of bimodality in the pulsed profile was shown by the sparse observations of this source in the 1999–2005 years, where it was already found that when 1E 1613 was in a brighter state the profile was remarkably different, and more structured (De Luca et al. 2006). We have observed that this change is not gradual, but it happens on a very short time-scale at the time of the outburst peak (Fig. 7). The folded profile in outburst clearly shows that a significant phase change took place, and similarly to other magnetars where the same phenomenology is present (Kaspi et al. 2003; Woods et al. 2004; Dib et al. 2009; Woods et al. 2011), it could indicate a general re-arrangement of the magnetic field, which also caused the rapid dissipation of energy in the burst event.
Clearly, it is comparatively much more difficult to assess if the sudden change in the folded profile is also associated with a frequency glitch, as observed in many magnetars (Dib et al. 2008), as the fractional frequency shifts are generally less than a part in a million except in some exceptional cases (Palmer 2002). Future observations, spanning a longer time-frame, will hopefully set a constraint on this issue. Because of this characteristic change in the pulsed profile, commonly observed after a burst in magnetars (Mereghetti et al. 2015), we believe that the 6.675 h periodicity cannot be of orbital origin as had being speculated in Bhadkamkar & Ghosh (2009), but it must be associated with the NS spin period. Early suggestions for the presence of in the folded profile (Becker & Aschenbach 2002) are ruled out, as the spectral hardening appears strongly correlated with the total flux over the entire flux range, and it is not localized in the bottoms of the folded profile (Fig. 5). This finding makes 1E 1613 the slowest pulsar to our knowledge (the second being RX J0146.9+6121, with a spin period of 1380 s; Haberl et al. 1998), and also makes 1E 1613 a rather exceptional object among all the known magnetars, because the distribution of spin periods of these objects lies in only a decade of periods between 2 and 12 s (Olausen & Kaspi 2014). Because of this extreme slow spin, the present rotational energy stored in the NS would be 3.4 1037 erg (assuming a canonical moment of inertia 1045 g cm2), and this value is very close to the energy dissipated in the burst event ( 2 1037 erg), thus indicating that magnetic dissipation of an intense field must be the main, if not the only source responsible for the observed burst radiation.
If the spin period of the NS at its birth was similar to that of other magnetars, some mechanism must have furiously braked it down on a time-scale comparable with the SNR age, which is only 2000 yr. Within the magnetar scenario, De Luca et al. (2006) proposed that the braking could be provided by a propeller effect due to a reservoir of mass formed from the SNR material fallback (a fossil disc, see also Wang et al. 2006), continuously expelled at the magnetospheric radius of the NS. The only constraint which appears reasonable is that the NS initial period should have been longer than 0.3 s to avoid the disc disruption by the relativistic outflow of the newly born active radio pulsar. A magnetar with a magnetic field = 5 1015 G could reach the period observed in 1E 1613, after having expelled 3 10-5 M⊙, in less than the age of the SNR. It is interesting to note that Reynoso et al. (2004) found the presence of an Hi depression region around 1E 1613 of radius 64 arcsec, and a lack of evidence for a possible ionized Hii region. The missing mass was evaluated to be 0.3 M⊙, thus suggesting that a strong sweeping of material at the centre of the SNR might have taken place. Li (2007) has further explored this scenario through a Monte Carlo simulation of a population of 106 NS magnetars interacting with a fallback disc. The NS population differs in initial spin periods, axis orientations, -field, and mass of the fallback disc. He found that most of the magnetars ( 99 per cent) would be found 2500 yr after their birth in the ejector phase (when the radiative pressure from the NS keeps the surrounding plasma away from the light cylinder and the spin-down can only be provided by magnetic dipole emission), but that 0.6% could be found in the propeller phase (when the disc radius is between the magnetospheric and the light cylinder radius) and be effectively braked to periods 103 s as possibly happened for 1E 1613.
Alternatively, the 1E 1613 could be a binary system formed by a very low mass star and a magnetar with a spin (quasi-)synchronous with the orbital period (Pizzolato et al. 2008). In this scenario the torque needed to slow down the NS is provided by the interactions between the magnetic field and the surrounding material, similar to the case of white dwarfs in intermediate polars. However, the presence of a low-mass companion which could have survived the supernova explosion, is rather unlikely, given that such mass-lopsided system would have been prone to unbinding. In this context, it is relevant that De Luca et al. (2008) ruled out all but late M-type stars as possible companions, while Li (2007) showed that, even in the case of survival, an irradiation-induced wind would not be able to power the observed X-ray emission. In search of possible counterparts at other wavelengths, we have also shown the results from a rapid optical/NIR follow-up of 1E 1613 with GROND made 0.26 h after the BAT trigger and by Swift/UVOT in the optical/UV bands both at the time of the trigger and in the whole set of Swift observations of the source. No significant counterpart was detected in the stacked images consistent with the position of 1E 1613. We derived a series of upper limits on the magnitudes in the different bands from NIR to UV, thus supporting the absence of any irradiated close companion star, or distant accretion flow (Wang et al. 2007).
4 Acknowledgements
The authors are very grateful to Amy Y. Lien for her support in the
data reduction and analysis of the BAT data.
PAE, APB, NPMK, and JPO
acknowledge Swift funding from the UK Space Agency.
We
acknowledge contract ASI-INAF I/004/11/0.
Part of the funding for
GROND (both hardware as well as personnel) was generously granted from
the Leibniz-Prize to Professor G. Hasinger (DFG grant HA 1850/28-1).
This work made use of data supplied by the UK Swift Science Data
Centre at the University of Leicester.
This research has made use of
the XRT Data Analysis Software (XRTDAS) developed under the
responsibility of the ASI Science Data Center (ASDC), Italy.
References
- Asplund et al. (2009) Asplund M., Grevesse N., Sauval A. J., Scott P., 2009, ARA&A, 47, 481
- Barthelmy et al. (2005) Barthelmy S. D., Barbier L. M., Cummings J. R. e. a., 2005, Space Sci. Rev., 120, 143
- Becker & Aschenbach (2002) Becker W., Aschenbach B., 2002, in Becker W., Lesch H., Trümper J., eds, Neutron Stars, Pulsars, and Supernova Remnants X-ray Observations of Neutron Stars and Pulsars: First Results from XMM-Newton. p. 64
- Bhadkamkar & Ghosh (2009) Bhadkamkar H., Ghosh P., 2009, A&A, 506, 1297
- Burrows et al. (2005) Burrows D. N., Hill J. E., Nousek J. A., Kennea J. A., Wells A., Osborne 2005, Space Science Reviews, 120, 165
- Carter et al. (1997) Carter L. M., Dickel J. R., Bomans D. J., 1997, PASP, 109, 990
- Castro-Tirado et al. (2008) Castro-Tirado A. J., de Ugarte Postigo A., Gorosabel J., Jelínek M., 2008, Nature, 455, 506
- Caswell et al. (1975) Caswell J. L., Murray J. D., Roger R. S., Cole D. J., Cooke D. J., 1975, A&A, 45, 239
- D’Aì et al. (2016) D’Aì A., Evans P. A., Gehrels N., Gronwall C., Kennea J. A., Lien A. Y., Marshall F. E., Maselli A., Sakamoto T., Siegel M. H., 2016, The Astronomer’s Telegram, 9180
- D’Aì et al. (2016) D’Aì A., Gehrels N., Gronwall C., Kennea J. A., Lien A. Y., Marshall F. E., Maselli A., Sakamoto T., Siegel M. H., 2016, GRB Coordinates Network, 19547
- De Luca et al. (2006) De Luca A., Caraveo P. A., Mereghetti S., Tiengo A., Bignami G. F., 2006, Science, 313, 814
- De Luca et al. (2008) De Luca A., Mignani R. P., Zaggia S., Beccari G., Mereghetti S., Caraveo P. A., Bignami G. F., 2008, ApJ, 682, 1185
- Dib et al. (2008) Dib R., Kaspi V. M., Gavriil F. P., 2008, ApJ, 673, 1044
- Dib et al. (2009) Dib R., Kaspi V. M., Gavriil F. P., 2009, ApJ, 702, 614
- Duncan & Thompson (1992) Duncan R. C., Thompson C., 1992, ApJ, 392, L9
- Esposito et al. (2008) Esposito P., Israel G. L., Zane S., Senziani F., Starling R. L. C., 2008, MNRAS, 390, L34
- Esposito et al. (2011) Esposito P., Turolla R., de Luca A., Israel G. L., Possenti A., Burrows D. N., 2011, MNRAS, 418, 170
- Frank et al. (2015) Frank K. A., Burrows D. N., Park S., 2015, ApJ, 810, 113
- Gaensler et al. (2001) Gaensler B. M., Slane P. O., Gotthelf E. V., Vasisht G., 2001, ApJ, 559, 963
- Gao et al. (2016) Gao Z. F., Li X.-D., Wang N., Yuan J. P., Wang P., Peng Q. H., Du Y. J., 2016, MNRAS, 456, 55
- Garmire et al. (2000) Garmire G. P., Garmire A. B., Pavlov G., Burrows D. N., 2000, in AAS/High Energy Astrophysics Division #5 Vol. 32 of Bulletin of the American Astronomical Society, A High State in the Central Object of RCW103. p. 1237
- Gavriil et al. (2008) Gavriil F. P., Gonzalez M. E., Gotthelf E. V., Kaspi V. M., Livingstone M. A., Woods P. M., 2008, Science, 319, 1802
- Gehrels et al. (2004) Gehrels N., Chincarini G., Giommi P., Mason K. O., Nousek J. A., Wells A. A., White N. E., 2004, ApJ, 611, 1005
- Gotthelf & Halpern (2008) Gotthelf E. V., Halpern J. P., 2008, in Bassa C., Wang Z., Cumming A., Kaspi V. M., eds, 40 Years of Pulsars: Millisecond Pulsars, Magnetars and More Vol. 983 of American Institute of Physics Conference Series, CCO Pulsars as Anti-Magnetars: Evidence of Neutron Stars Weakly Magnetized at Birth. pp 320–324
- Gotthelf et al. (2013) Gotthelf E. V., Halpern J. P., Alford J., 2013, ApJ, 765, 58
- Gotthelf et al. (1999) Gotthelf E. V., Petre R., Vasisht G., 1999, ApJ, 514, L107
- Greiner et al. (2008) Greiner J., Bornemann W., Clemens C., Deuter M., 2008, PASP, 120, 405
- Haberl et al. (1998) Haberl F., Angelini L., Motch C., White N. E., 1998, A&A, 330, 189
- Halpern & Gotthelf (2010) Halpern J. P., Gotthelf E. V., 2010, ApJ, 709, 436
- Ikhsanov et al. (2013) Ikhsanov N. R., Kim V. Y., Beskrovnaya N. G., Pustil’nik L. A., 2013, Ap&SS, 346, 105
- Kaspi et al. (2003) Kaspi V. M., Gavriil F. P., Woods P. M., Jensen J. B., Roberts M. S. E., Chakrabarty D., 2003, ApJ, 588, L93
- Krühler et al. (2008) Krühler T., Küpcü Yoldaş A., Greiner J., Clemens C., McBreen S., Primak N., Savaglio S., Yoldaş A., Szokoly G. P., Klose S., 2008, ApJ, 685, 376
- Kuin et al. (2015) Kuin N. P. M., Landsman W., Breeveld A. A., Page M. J., Lamoureux H., James C., Mehdipour M., Still M., Yershov V., Brown P. J., Carter M., Mason K. O., Kennedy T., Marshall F., Roming P. W. A., Siegel M., Oates S., Smith P. J., De Pasquale M., 2015, MNRAS, 449, 2514
- Li (2007) Li X.-D., 2007, ApJ, 666, L81
- Mereghetti et al. (2015) Mereghetti S., Pons J. A., Melatos A., 2015, Space Sci. Rev., 191, 315
- Olausen & Kaspi (2014) Olausen S. A., Kaspi V. M., 2014, ApJS, 212, 6
- Palmer (2002) Palmer D. M., 2002, MmSAI, 73, 578
- Pizzolato et al. (2008) Pizzolato F., Colpi M., De Luca A., Mereghetti S., Tiengo A., 2008, ApJ, 681, 530
- Rea & Esposito (2011) Rea N., Esposito P., 2011, Astrophysics and Space Science Proceedings, 21, 247
- Reynoso et al. (2004) Reynoso E. M., Green A. J., Johnston S., Goss W. M., Dubner G. M., Giacani E. B., 2004, Publ. Astron. Soc. Australia, 21, 82
- Roming et al. (2005) Roming P. W. A., Kennedy T. E., Mason K. O., Nousek J. A., 2005, Space Sci. Rev., 120, 95
- Schady et al. (2016) Schady P., Kann D. A., Greiner J., 2016, The Astronomer’s Telegram, 9184
- Scholz & Kaspi (2011) Scholz P., Kaspi V. M., 2011, ApJ, 739, 94
- Scholz et al. (2012) Scholz P., Ng C.-Y., Livingstone M. A., Kaspi V. M., Cumming A., Archibald R. F., 2012, ApJ, 761, 66
- Skrutskie et al. (2006) Skrutskie M. F., Cutri R. M., Stiening R., Weinberg M. D., 2006, AJ, 131, 1163
- Stamatikos et al. (2016) Stamatikos M., Barthelmy S. D., Cummings J. R., D’Ai A., Gehrels N., Krimm H. A., Lien A. Y., Markwardt C. B., Malesani D., Palmer D. M., Sakamoto T., Ukwatta T. N., 2016, The Astronomer’s Telegram, 9183
- Stefanescu et al. (2008) Stefanescu A., Kanbach G., Słowikowska A., Greiner J., McBreen S., Sala G., 2008, Nature, 455, 503
- Steiner et al. (2009) Steiner J. F., Narayan R., McClintock J. E., Ebisawa K., 2009, PASP, 121, 1279
- Thompson & Duncan (1993) Thompson C., Duncan R. C., 1993, ApJ, 408, 194
- Thompson & Duncan (1995) Thompson C., Duncan R. C., 1995, MNRAS, 275, 255
- Tody (1993) Tody D., 1993, in Hanisch R. J., Brissenden R. J. V., Barnes J., eds, Astronomical Data Analysis Software and Systems II Vol. 52 of Astronomical Society of the Pacific Conference Series, IRAF in the Nineties. p. 173
- Turolla et al. (2015) Turolla R., Zane S., Watts A. L., 2015, Reports on Progress in Physics, 78, 116901
- Verner et al. (1996) Verner D. A., Ferland G. J., Korista K. T., Yakovlev D. G., 1996, ApJ, 465, 487
- Vink (2008) Vink J., 2008, Advances in Space Research, 41, 503
- Wang et al. (2006) Wang Z., Chakrabarty D., Kaplan D. L., 2006, Nature, 440, 772
- Wang et al. (2007) Wang Z., Kaplan D. L., Chakrabarty D., 2007, ApJ, 655, 261
- Woods et al. (2011) Woods P. M., Kaspi V. M., Gavriil F. P., Airhart C., 2011, ApJ, 726, 37
- Woods et al. (2004) Woods P. M., Kaspi V. M., Thompson C., Gavriil F. P., Marshall H. L., Chakrabarty D., Flanagan K., Heyl J., Hernquist L., 2004, ApJ, 605, 378
- Yoldaş et al. (2008) Yoldaş A. K., Krühler T., Greiner J., Yoldaş A., Clemens C., Szokoly G., Primak N., Klose S., 2008, in Galassi M., Palmer D., Fenimore E., eds, American Institute of Physics Conference Series Vol. 1000 of American Institute of Physics Conference Series, First Results of GROND. pp 227–231