The effects of cooling rate on particle rearrangement statistics: Rapidly cooled glasses are more ductile and less reversible
Abstract
Amorphous solids, such as metallic, polymeric, and colloidal glasses, display complex spatiotemporal response to applied deformations. In contrast to crystalline solids, during loading, amorphous solids exhibit a smooth crossover from elastic response to plastic flow. In this study, we investigate the mechanical response of binary Lennard-Jones glasses to athermal, quasistatic pure shear as a function of the cooling rate used to prepare them. We find several key results concerning the connection between strain-induced particle rearrangements and mechanical response. We show that more rapidly cooled glasses undergo more frequent and larger particle rearrangements than slowly cooled glasses. We find that the ratio of the shear to bulk moduli decreases with increasing cooling rate, which suggests that more rapidly cooled glasses are more ductile than slowly cooled samples. In addition, we characterized the degree of reversibility of particle motion during cyclic shear. We find that irreversible particle motion occurs even in the putative linear regime of stress versus strain. However, slowly cooled glasses, which undergo smaller rearrangements, are more reversible under cyclic shear than rapidly cooled glasses. Thus, we show that more ductile glasses are also less reversible.
pacs:
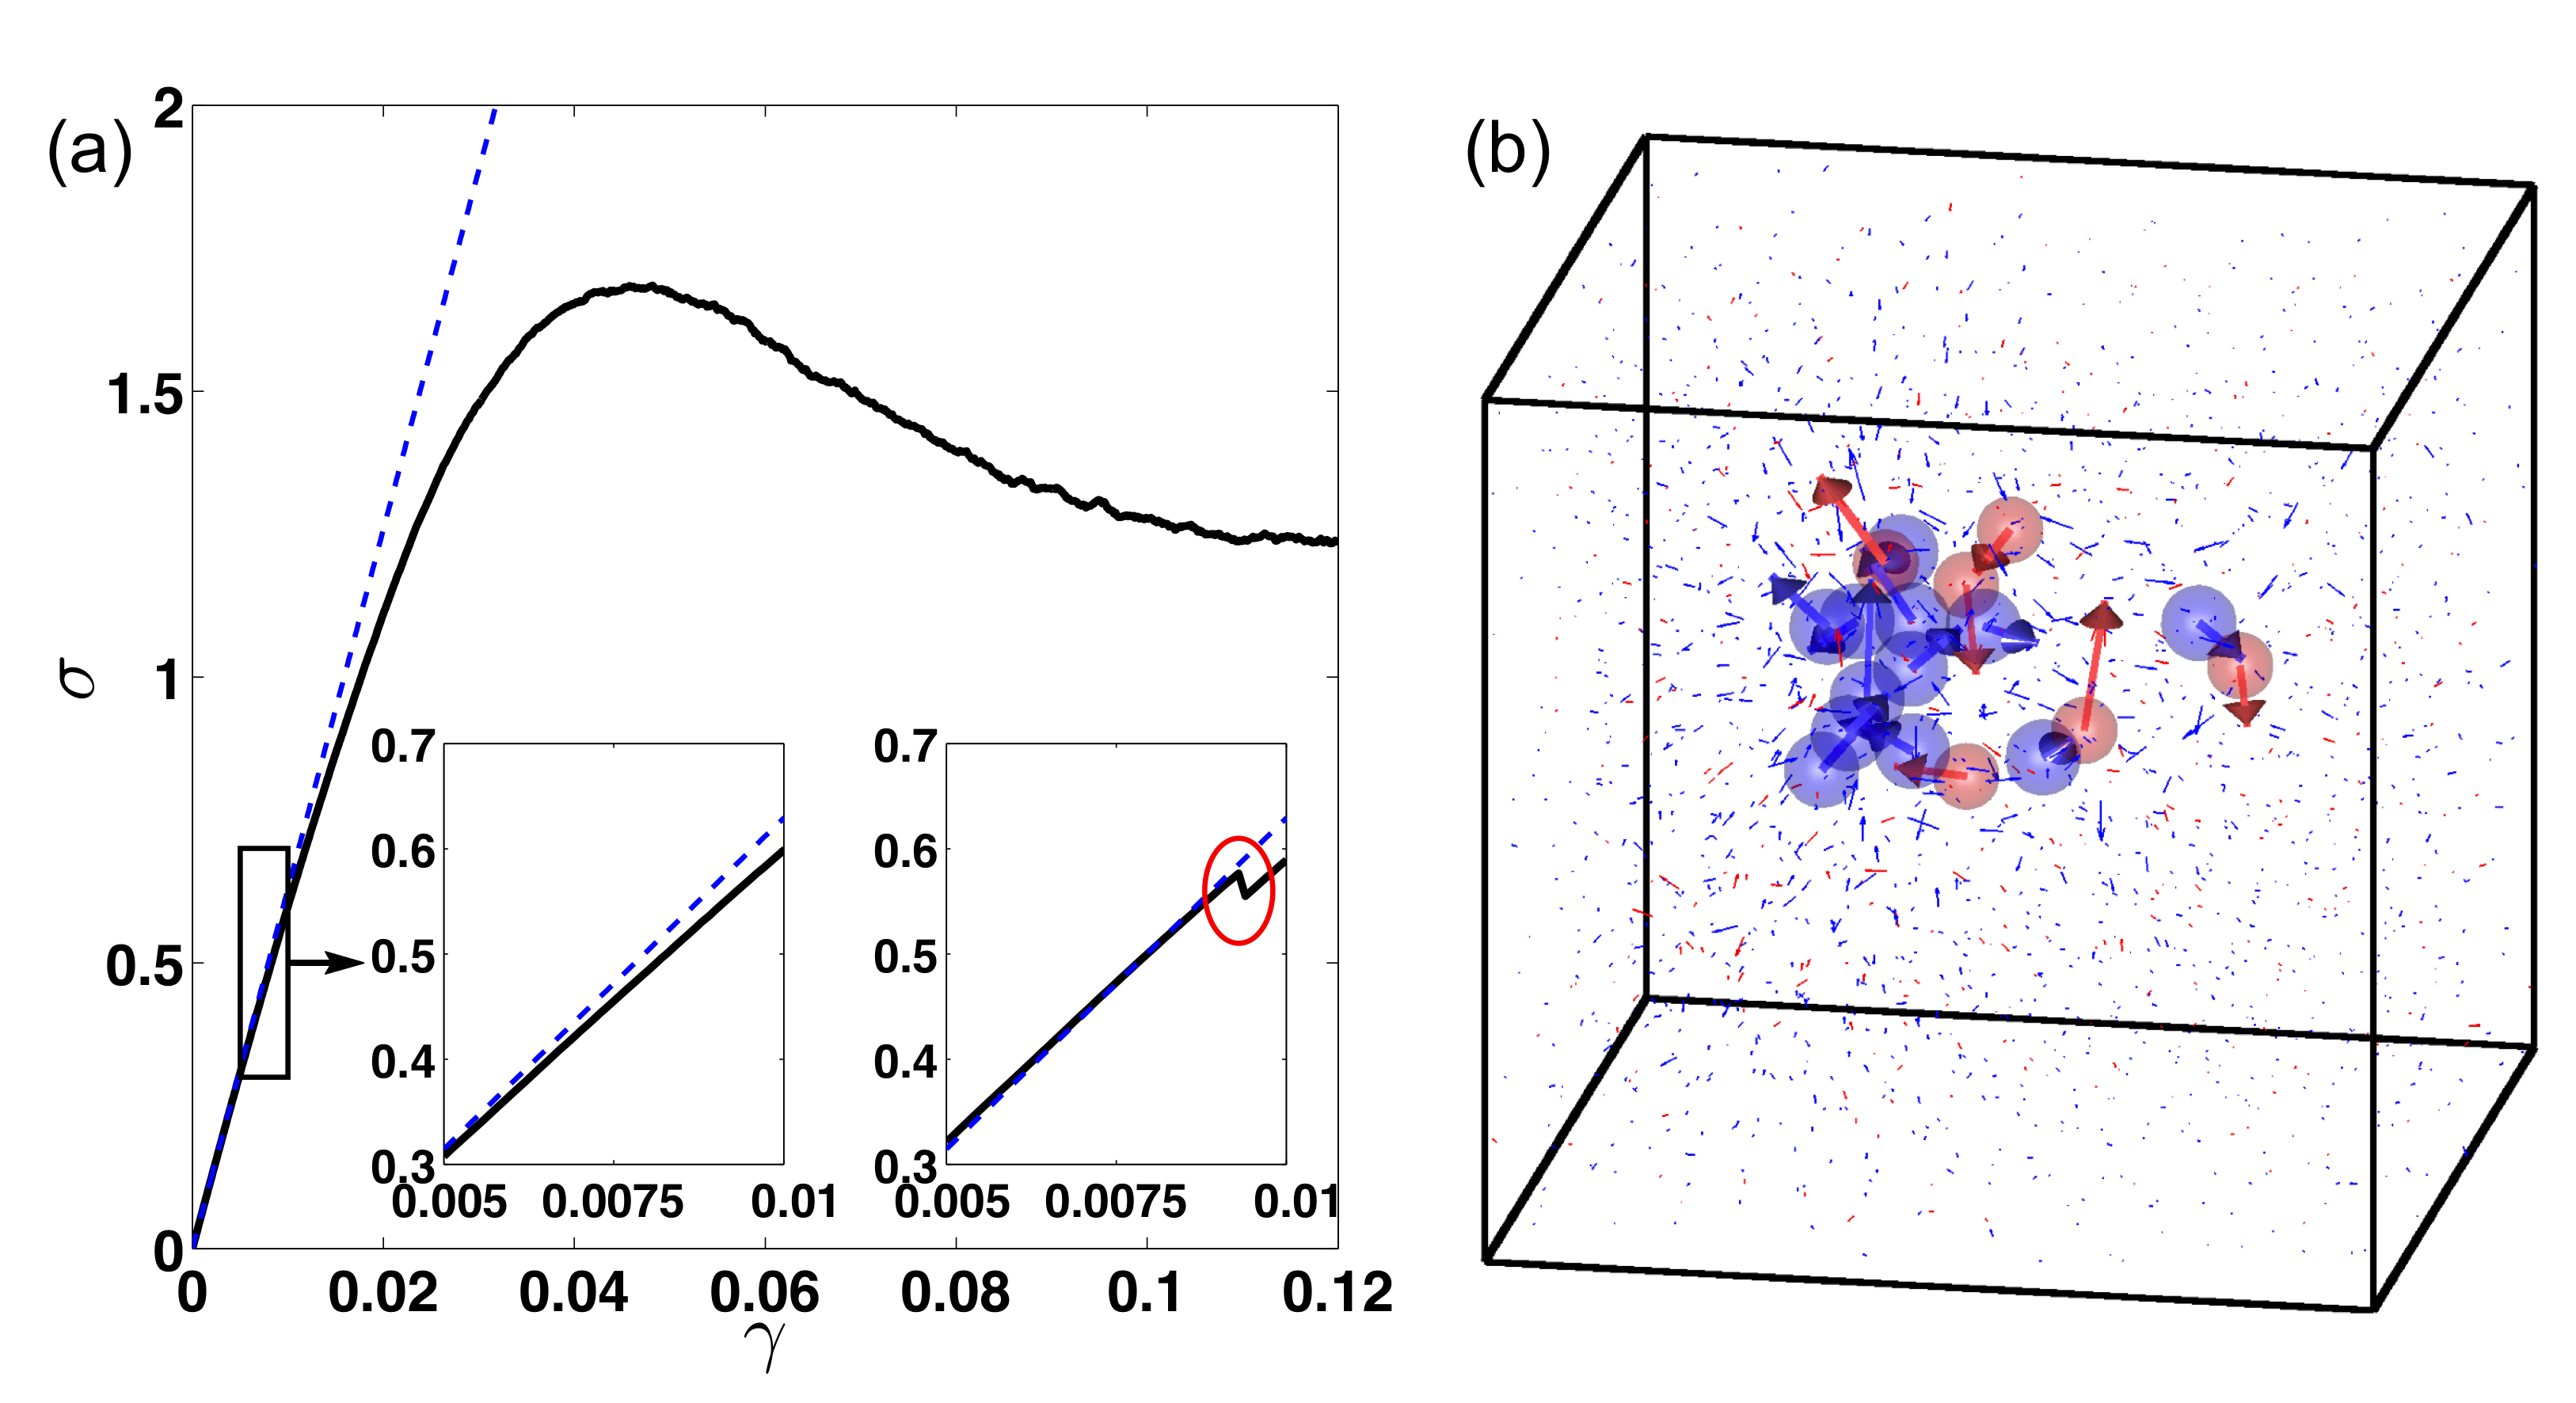
62.20.-x, 63.50.Lm 64.70.kj 64.70.peAmorphous solids, including metallic, polymeric, and colloidal glasses, possess complex mechanical response to applied deformations, such as plastic flow Falk and Langer (1998); Utz et al. (2000); Maloney and Lemaitre (2004); Sun et al. (2010), strain localization Spaepen (1977); Schall et al. (2007); Ju et al. (2011); Ding et al. (2014); Jensen et al. (2014), creep flow Ju et al. (2011); Atzmon and Ju (2014); Ju and Atzmon (2015), and fracture Chen et al. (2016); Antonaglia et al. (2014); Kumar et al. (2013). In crystalline materials, topological defects reflecting the symmetry of the crystalline phase govern the response to applied deformations. In amorphous solids without long-range positional order, it is more difficult to detect and predict changes from elastic response to irreversible behavior Ding et al. (2014); Gendelman et al. (2015), such as yielding Park et al. (2008); Regev et al. (2015) and flow Harmon et al. (2007); Sun et al. (2010). The typical response of the deviatoric stress to an applied (pure) shear strain for amorphous solids is depicted in Fig. 1 (a). The average stress increases roughly linearly with strain for small strains, indicating a putative elastic regime. At larger strains, the stress response softens and becomes anelastic, but it continues to increase with strain. For larger strains (i.e. near ), the shear stress reaches a peak (whose height depends on the thermal history of the glass) and then begins to decrease until it plateaus at a steady state value in the plastic flow regime Utz et al. (2000); Harmon et al. (2007). (For this system, we employed boundary conditions that prevent fracture.)
Several recent studies have suggested that amorphous solids do not possess a truly elastic response regime Park et al. (2008); Fujita et al. (2012); Dmowski et al. (2010); Schall et al. (2007); Jensen et al. (2014); Ju et al. (2011); Ding et al. (2012). For example, both a sublinear increase of the average stress with strain (left inset to Fig. 1 (a)) and rapid drops in stress over narrow strain intervals (right inset to Fig. 1 (a)) have been observed at strains below the nominal yield strain of Ding et al. (2012); Park et al. (2008); Fujita et al. (2012). The rapid drops in stress are caused by particle rearrangements (e.g. in Fig. 1 (b)), which are often referred to as shear transformation zones Argon and Kuo (1979); Falk and Langer (1998); Langer (2008). We will show below how the frequency and size of particle rearrangements determine the mechanical response of amorphous solids.
In this article, we build a conceptual framework for the mechanical response of amorphous solids by exploring the potential energy landscape and particle rearrangement statistics of binary Lennard-Jones glasses during athermal, quasistatic pure shear. The initial glasses are prepared over a wide range of cooling rates. The cooling rate determines the fictive temperature, which defines the average energy of the glass in the potential energy landscape Debenedetti and Stillinger (2001). The fictive temperature significantly affects mechanical properties, such as ductility Kumar et al. (2013, 2011), shear band formation Zemp et al. (2015), and the stress-strain relation Utz et al. (2000); Ashwin et al. (2013). Our key result is that more rapidly cooled glasses possess more frequent and larger potential energy drops during applied shear strain compared to more slowly cooled glasses. As a result, the ensemble-averaged (metabasin) curvature of the energy landscape is much smaller for rapidly cooled glasses. We connect the statistics of particle rearrangements to whether amorphous solids exhibit brittle or ductile mechanical response and characterize the degree of irreversibility of particle rearrangements in response to shear reversal. We find that more rapidly cooled glasses are more ductile and irreversible compared to slowly cooled glasses.
We performed constant number, pressure, and temperature (NPT) molecular dynamics (MD) simulations of binary Lennard-Jones mixtures containing large and small spherical particles by number (both with mass ) in a cubic box with volume and periodic boundary conditions. The particles interact pairwise via the Kob-Andersen, shifted-force potential, , where is the separation between particles and , for , and the energy and length parameters are given by , , , , , and Kob and Andersen (1995). Energy, temperature, pressure, and time scales are expressed in units of , , , and , respectively, where is Boltzmann’s constant Allen and Tildesley (1989).
We first equilibrate systems in the liquid regime at constant temperature and pressure using a Nosé-Hoover thermostat and barostat, a second-order simplectic integration scheme Plimpton (1995); Tuckerman et al. (2006), and time step . We cool systems into a glassy state at zero temperature using a linear cooling ramp, over a range of cooling rates from to , all of which are above the critical cooling rate. Thus, all of the zero-temperature samples are disordered. We then apply athermal, quasistatic pure shear at fixed pressure. (See an expanded discussion of the methods in the Supplemental Material.) To do this, we expand the box length and move all particles affinely in the -direction by a small strain increment and compress the box length and move all particles affinely in the -direction by the same strain increment . Following the applied pure shear strain, we minimize the total enthalpy of the system at fixed pressure , where is the total potential energy. We successively apply pure strain increments and minimize the enthalpy at fixed pressure after each increment to a total strain . We studied systems with , , , and particles to assess finite size effects.
We developed a method to unambiguously determine if a particle rearrangement occurs with an accuracy on the order of numerical precision, which allows us to detect rearrangements with sizes ranging over more than seven orders of magnitude. To identify particle rearrangement events, at each strain we compare the total potential energy per particle from simulations undergoing forward shear to the potential energy per particle obtained by first a forward shear step from strain to (and enthalpy minimization) followed by a backward shear step from back to (and enthalpy minimization). We find that the distribution of the magnitudes of the energy differences is bimodal with peaks near corresponding to numerical error and corresponding to distinct particle rearrangements. Thus, it is straightforward to identify particle rearrangements as those with , where the threshold clearly distinguishes numerical error from particle rearrangements. (See Supplemental Material.) We denote the total number of rearrangements in the strain interval to as . In addition, we calculate the total energy lost after each rearrangement over the strain interval : , where indicate the strains at which rearrangements occur.
In Fig. 2 (a) and (b), we plot the frequency of rearrangements and energy loss per rearrangement as a function of strain. Both the frequency and energy loss increase with strain for small strains ( for and for ) and then reach plateau values that are independent of strain. Both quantities are sensitive to cooling rate in the small strain regime: glasses quenched using more rapid cooling rates (i.e. ) incur more and larger particle rearrangements. For more slowly cooled glasses (i.e. ), the systems only begin losing energy (as measured from ) beyond a characteristic strain . In contrast, for rapidly cooled glasses, the energy loss is roughly proportional to strain for . At large strains , becomes independent of cooling rate and strain. Further, we find that , which is the product of and , is roughly independent of system size over the range of we consider.
The potential energy landscape, which in the case of pure shear is a function of the particle coordinates and strain , can provide key insights into the structure of configuration space and mechanical behavior of glassy materials Stillinger (1995); Debenedetti and Stillinger (2001). For example, recent studies have identified hierarchical sub- and metabasins in the energy landscape of supercooled liquids and glasses Debenedetti and Stillinger (2001); Harmon et al. (2007); Charbonneau et al. (2014) and studied the disappearance of energy minima and resulting particle rearrangements as a function of applied strain Malandro and Lacks (1999); Lacks and Osborne (2004); Debenedetti and Stillinger (2001). In Fig. 3, we show the total potential energy per particle versus strain for a single configuration (with average particle rearrangement statistics), as well as averaged over configurations, for two cooling rates ( and ). For the more rapidly cooled glass, the energy drops are relatively large and frequent. Rearrangements are frequent because there is an abundance of nearby minima in the potential energy landscape as a function of strain for rapidly cooled glasses Stillinger (1995). In addition, the large and frequent energy drops give rise to small metabasin curvature of the ensemble-averaged energy landscape.
In contrast, for slowly cooled glasses, we find that the energy drops are smaller and more rare, which implies that when systems are deeper in the energy landscape, energy minima are further separated as a function of strain and the curvatures of the energy metabasins are larger. Thus, these results provide evidence that the curvatures of the metabasins in the potential energy landscape decrease with increasing cooling rate Utz et al. (2000); Fan et al. (2014). In addition, our results are consistent with prior results, which show that the yield stress (or the ensemble-averaged ) increases with decreasing cooling rate Utz et al. (2000); Ashwin et al. (2013).
We next connect the statistics of the potential energy landscape to micro- and macro-scale mechanical properties of amorphous solids. As shown in Fig. 3, more rapidly cooled glasses undergo larger and more frequent particle rearrangements. We argue that larger and more frequent particle rearrangements help reduce stress accumulation during deformation and hence prevent catastrophic brittle failure Lewandowski et al. (2005); Zemp et al. (2015); Yu et al. (2012). This suggests that more rapidly quenched glasses are more ductile than slowly quenched glasses Kumar et al. (2013). To investigate this hypothesis, we measured the ratio of the shear to bulk modulus (Fig. 4) as a function of cooling rate. (The moduli and were obtained from the slope of for vanishingly small pure and compressive strains, respectively.) is a material property that has been shown to correlate strongly with the ductility/brittleness of a material Lewandowski et al. (2005); Schroers and Johnson (2004); Kumar et al. (2013); Shi et al. (2014). We find that both and decrease with increasing cooling rate, but decreases faster (inset to Fig. 4), and thus the ratio , and brittleness, decrease with increasing .
Whether a material is reversible or not under applied deformation is often inferred from the behavior of its stress-strain curve or other macroscopic measurements. For example, materials are typically deemed reversible in the regime where the stress-strain curve is linear, and irreversible in the regime where plastic flow occurs Taub and Spaepen (1981). Reversibility has been studied experimentally using enthalpy Harmon et al. (2007) and strain recovery Fujita et al. (2012), elastostatic compression Park et al. (2008), nanoindentation Atzmon and Ju (2014), and quality factor measurements Kanik et al. (2014). In simulations, reversibility has been studied using cyclic shear of model glasses Schreck et al. (2013); Regev et al. (2013, 2015); Fiocco et al. (2014); Priezjev (2016). Though the large elastic region (e.g. the linear stress-strain region in Fig. 1) is typically considered reversible, recent measurements have been identified irreversible events and anelasticity on the micro-scale in this ‘elastic’ region Park et al. (2008); Fujita et al. (2012); Dmowski et al. (2010); Schall et al. (2007); Jensen et al. (2014); Ju et al. (2011); Ding et al. (2012).
An important, fundamental open challenge is to determine the onset Schreck et al. (2013); Regev et al. (2013) of micro-scale irreversibility and understand its connection to irreversibility and plasticity on macroscopic scales. Above, we defined particle rearrangements as those that led to local irreversibility of the potential energy after a forward strain increment , followed by a backward strain increment . We now characterize the reversibility of particle motion following finite-sized strains using two measures. First, we define a measure of “state” irreversibility as
| (1) |
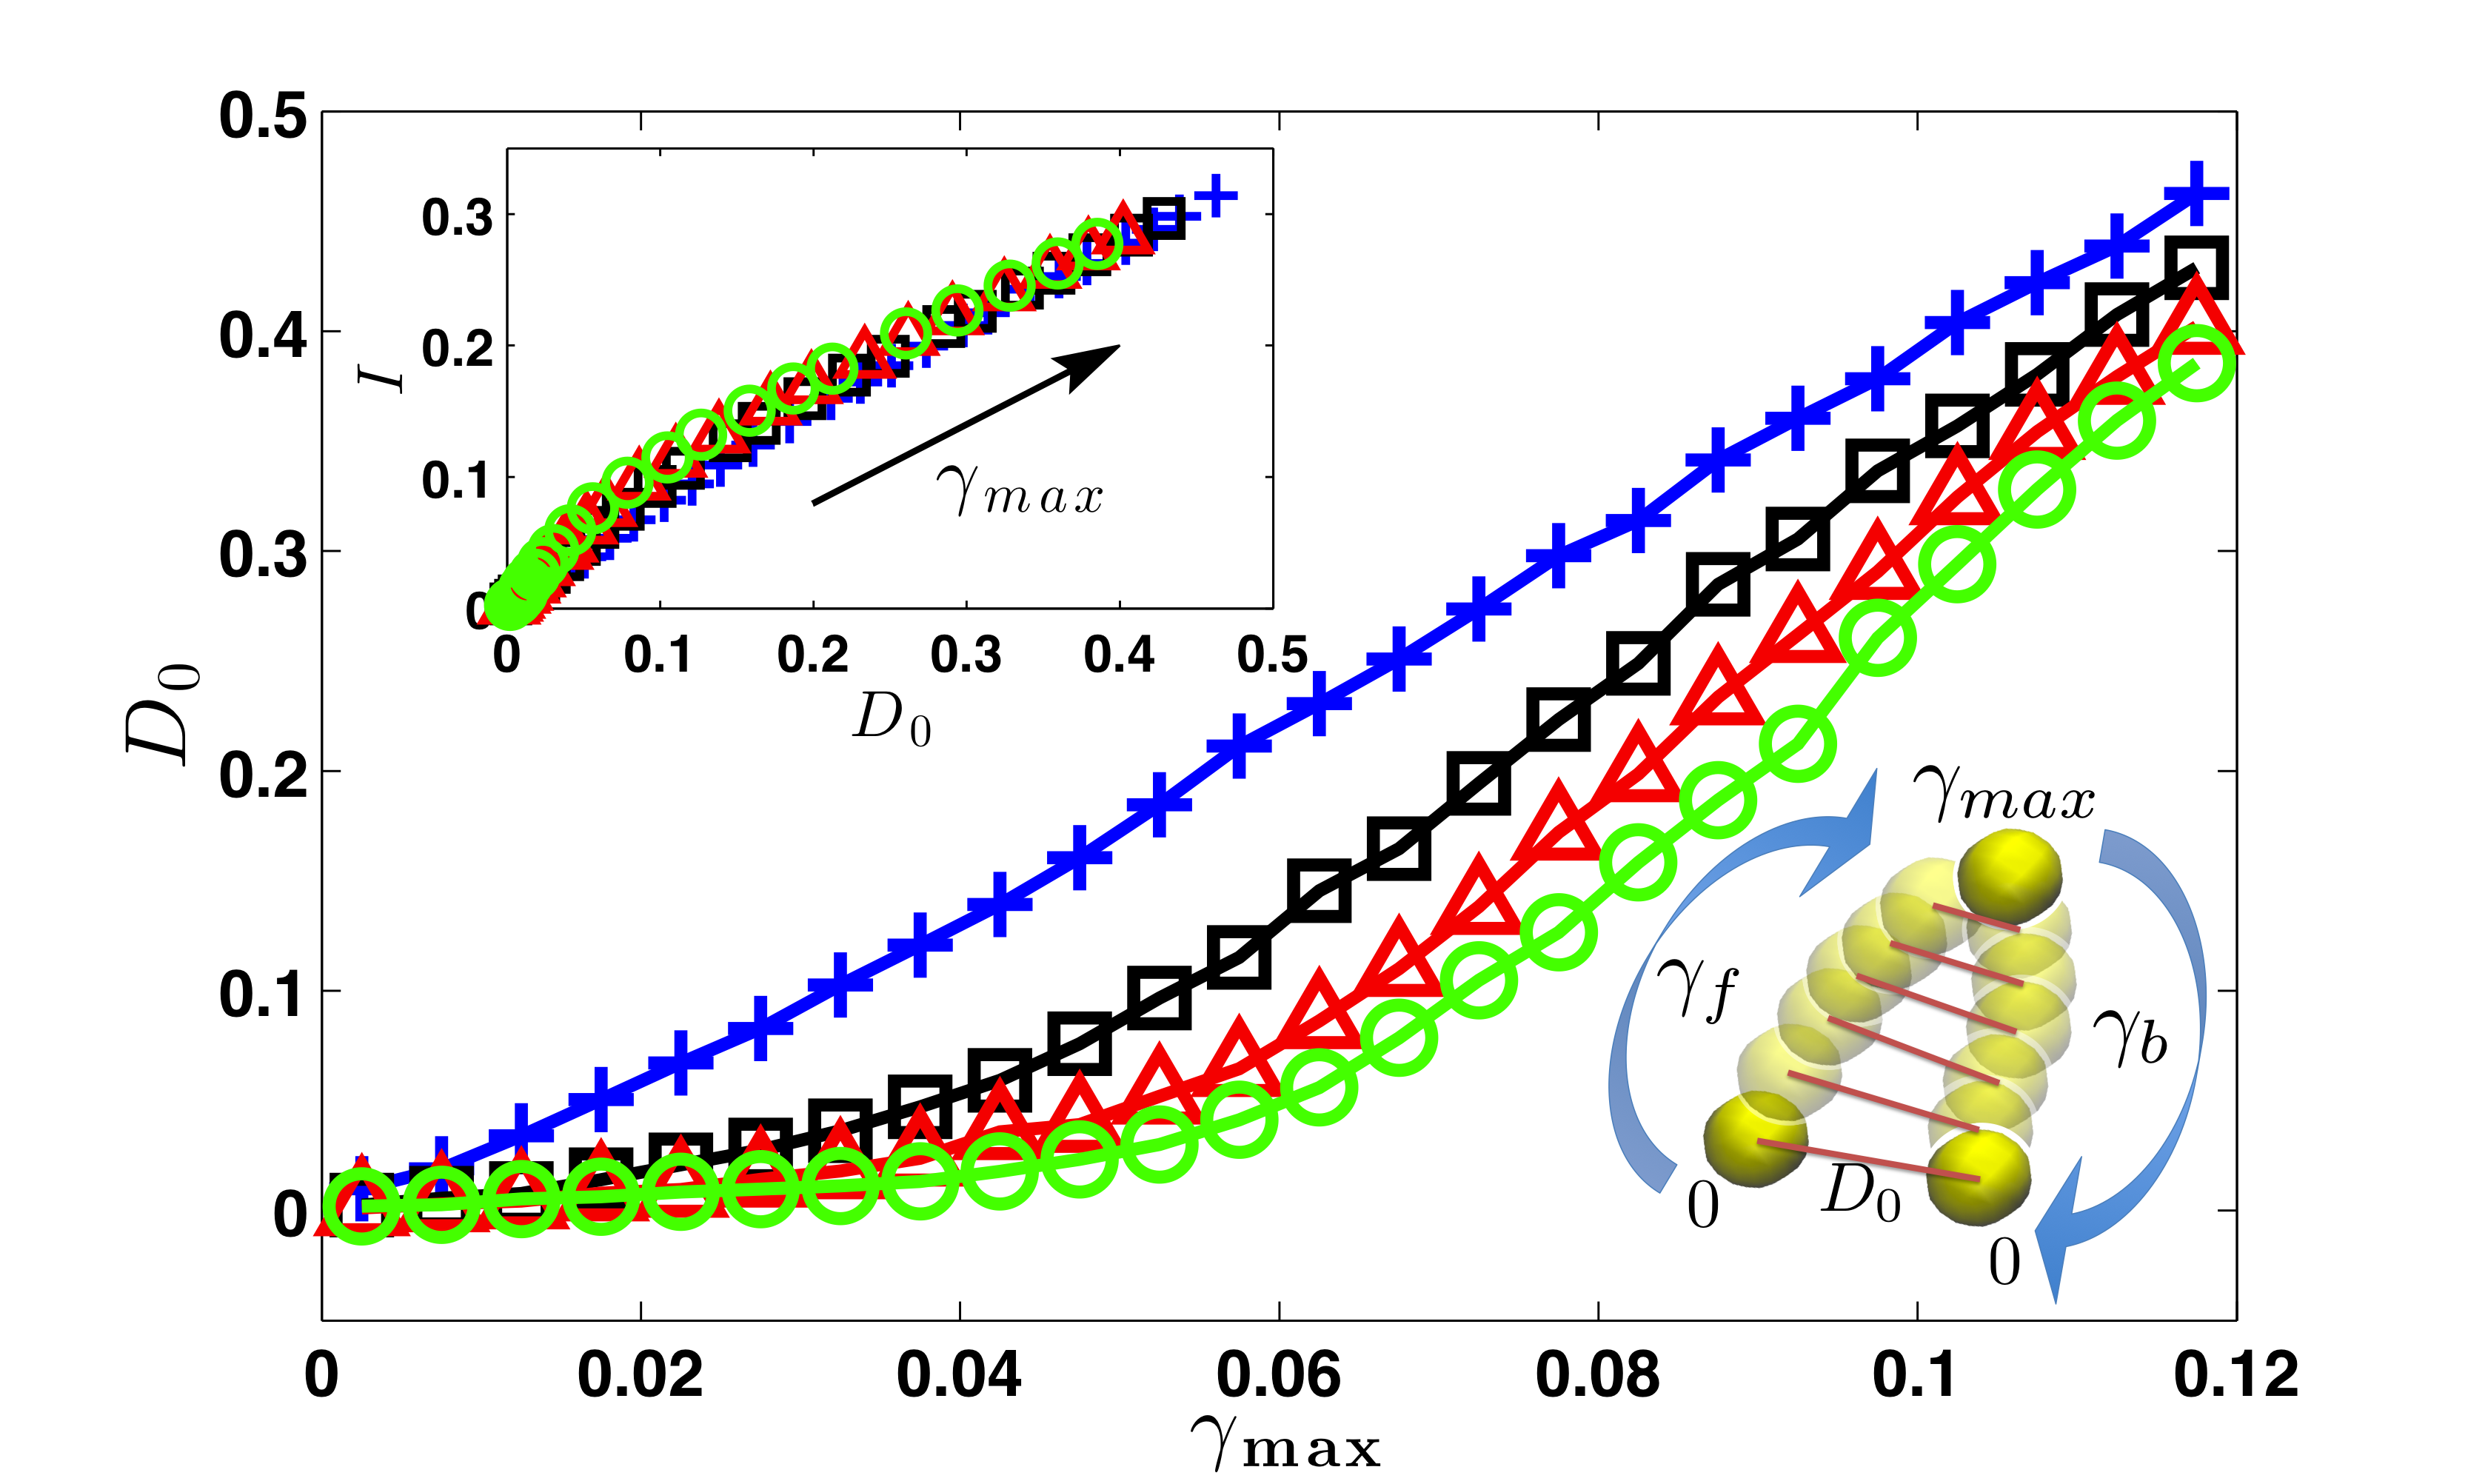
where gives the particle coordinates after the system has been sheared forward by strain and backward by strain . characterizes the ability of a sheared system to return to the original, unsheared configuration. (See the lower right inset to Fig. 5.) In Eq. 1, gives the original, unsheared particle coordinates, and gives the particle coordinates of the system after it was sheared forward to strain and then sheared backward from strain to zero strain. During forward strain, the system undergoes particle rearrangements and during backward strain, the system undergoes a different set of particle rearrangements. indicates a type of reversible behavior, where most of the particles return to their original, unsheared positions after a strain cycle of amplitude . In contrast, implies irreversible behavior that grows in magnitude with increasing . We also define a measure of “path” irreversibility,
| (2) |
which determines the average distance between the system configurations at corresponding strains during the forward and backward portions of the shear cycle. (See the lower right inset to Fig. 5.)
Even though shear cycles can occur with and , which implies that the system returns to the original, unsheared configuration at along different forward and backward shear paths Schreck et al. (2013), we find that the ensemble-averaged becomes nonzero only when begins increasing from zero. Further, and are strongly correlated as the amplitude of the shear cycle increases. (See the upper left inset in Fig. 5.) In Fig. 5, we plot for several cooling rates. We find that slowly cooled glasses are nearly reversible over a finite range of strain (i.e. up to ), while (with slope ) for rapidly cooled glasses. For intermediate cooling rates, can be approximated as for and for . The slope increases with cooling rate, and the crossover strain decreases with cooling rate. The upper inset to Fig. 5 shows that and possess the same cooling rate dependence. More rapidly cooled glasses possess higher values of irreversibility because they undergo more frequent and larger rearrangements during shear (as shown in Fig. 3). In addition, we have shown that the path irreversibility is strongly correlated with the energy loss per rearrangement .
It is well known that non-affine particle motion and rearrangements control the mechanical properties of amorphous solids. In this study, we showed that the particle rearrangement statistics are sensitive to the cooling rate used to prepare zero-temperature glasses. Specifically, we identified distinct particle rearrangement events in binary Lennard-Jones glasses undergoing athermal, quasistatic pure shear. We measured the frequency of rearrangements and the size of the energy drops during rearrangements as a function of strain and the cooling rate used to prepare the glasses. We found that more rapidly cooled glasses undergo more frequent and larger energy drops, compared to more slowly cooled glasses. We also correlated the statistics of particle rearrangements to the ratio of the shear and bulk moduli and showed that more rapidly cooled glasses are more ductile than slowly cooled glasses. Finally, we characterized the degree of irreversibility of systems to cyclic shear and showed that slowly cooled glasses possess a finite range of strain where they appear nearly reversible (but are not truly reversible with ), whereas measures of irreversibility increase linearly with strain for rapidly cooled glasses. Thus, we showed that more ductile glasses are also more irreversible, and connected particle-scale rearrangement statistics to macroscopic mechanical response.
Acknowledgements.
The authors acknowledge primary financial support from NSF MRSEC DMR-1119826 (K.Z.) and partial support from NSF Grant Nos. CMMI-1462439 (C.O. and M.F.) and CMMI-1463455 (M.S.). This work also benefited from the facilities and staff of the Yale University Faculty of Arts and Sciences High Performance Computing Center and the NSF (Grant No. CNS-0821132) that, in part, funded acquisition of the computational facilities.References
- Falk and Langer (1998) M. L. Falk and J. S. Langer, Physical Review E 57, 7192 (1998).
- Utz et al. (2000) M. Utz, P. G. Debenedetti, and F. H. Stillinger, Physical Review Letters 84, 1471 (2000).
- Maloney and Lemaitre (2004) C. Maloney and A. Lemaitre, Physical Review Letters 93, 016001 (2004).
- Sun et al. (2010) B. A. Sun, H. B. Yu, W. Jiao, H. Y. Bai, D. Q. Zhao, and W. H. Wang, Physical Review Letters 105, 35501 (2010).
- Spaepen (1977) F. Spaepen, Acta Metallurgica 25, 407 (1977).
- Schall et al. (2007) P. Schall, D. A. Weitz, and F. Spaepen, Science 318, 1895 (2007).
- Ju et al. (2011) J. Ju, D. Jang, A. Nwankpa, and M. Atzmon, Journal of Applied Physics 109, 053522 (2011).
- Ding et al. (2014) J. Ding, S. Patinet, M. L. Falk, Y. Cheng, and E. Ma, Proceedings of the National Academy of Sciences 111, 14052 (2014).
- Jensen et al. (2014) K. E. Jensen, D. A. Weitz, and F. Spaepen, Physical Review E 90, 042305 (2014).
- Atzmon and Ju (2014) M. Atzmon and J. D. Ju, Phys. Rev. E 90, 042313 (2014).
- Ju and Atzmon (2015) J. Ju and M. Atzmon, Journal of Alloys and Compounds 643, S8 (2015).
- Chen et al. (2016) W. Chen, Z. Liu, J. Ketkaew, R. M. O. Mota, S.-H. Kim, M. Power, W. Samela, and J. Schroers, Acta Materialia 107, 220 (2016).
- Antonaglia et al. (2014) J. Antonaglia, X. Xie, G. Schwarz, M. Wraith, J. Qiao, Y. Zhang, P. K. Liaw, J. T. Uhl, and K. A. Dahmen, Scientific Reports 4, 4382 (2014).
- Kumar et al. (2013) G. Kumar, P. Neibecker, Y. H. Liu, and J. Schroers, Nature Communications 4, 1536 (2013).
- Gendelman et al. (2015) O. Gendelman, P. K. Jaiswal, I. Procaccia, B. S. Gupta, and J. Zylberg, Europhysics Letters 109, 16002 (2015).
- Park et al. (2008) K.-W. Park, C.-M. Lee, M. Wakeda, Y. Shibutani, M. L. Falk, and J.-C. Lee, Acta Materialia 56, 5440 (2008).
- Regev et al. (2015) I. Regev, J. Weber, C. Reichhardt, K. A. Dahmen, and T. Lookman, Nature Communications 6, 8805 (2015).
- Harmon et al. (2007) J. S. Harmon, M. D. Demetriou, W. L. Johnson, and K. Samwer, Physical Review Letters 99, 135502 (2007).
- Fujita et al. (2012) T. Fujita, Z. Wang, Y. Liu, H. Sheng, W. Wang, and M. Chen, Acta Materialia 60, 3741 (2012).
- Dmowski et al. (2010) W. Dmowski, T. Iwashita, C.-P. Chuang, J. Almer, and T. Egami, Physical Review Letters 105, 205502 (2010).
- Ding et al. (2012) J. Ding, Y. Cheng, and E. Ma, Applied Physics Letters 101, 121917 (2012).
- Argon and Kuo (1979) A. Argon and H. Kuo, Materials Science and Engineering 39, 101 (1979).
- Langer (2008) J. S. Langer, Physical Review E 77, 021502 (2008).
- Malandro and Lacks (1999) D. L. Malandro and D. J. Lacks, The Journal of Chemical Physics 110, 4593 (1999).
- Debenedetti and Stillinger (2001) P. G. Debenedetti and F. H. Stillinger, Nature 410, 259 (2001).
- Kumar et al. (2011) G. Kumar, S. Prades-Rodel, A. Blatter, and J. Schroers, Scripta Materialia 65, 585 (2011).
- Zemp et al. (2015) J. Zemp, M. Celino, B. Schönfeld, and J. F. Löffler, Physical Review Letters 115, 165501 (2015).
- Ashwin et al. (2013) J. Ashwin, E. Bouchbinder, and I. Procaccia, Physical Review E 87, 042310 (2013).
- Kob and Andersen (1995) W. Kob and H. C. Andersen, Physical Review E 51, 4626 (1995).
- Allen and Tildesley (1989) M. P. Allen and D. J. Tildesley, Computer simulation of liquids (Oxford University Press, 1989).
- Plimpton (1995) S. Plimpton, Journal of Computational Physics 117, 1 (1995).
- Tuckerman et al. (2006) M. E. Tuckerman, J. Alejandre, R. López-Rendón, A. L. Jochim, and G. J. Martyna, Journal of Physics A: Mathematical and General 39, 5629 (2006).
- Stillinger (1995) F. H. Stillinger, Science 267, 1935 (1995).
- Charbonneau et al. (2014) P. Charbonneau, J. Kurchan, G. Parisi, P. Urbani, and F. Zamponi, Nature Communications 5 (2014).
- Lacks and Osborne (2004) D. J. Lacks and M. J. Osborne, Physical Review Letters 93, 255501 (2004).
- Fan et al. (2014) Y. Fan, T. Iwashita, and T. Egami, Nature Communications 5, 5083 (2014).
- Lewandowski et al. (2005) J. Lewandowski, W. Wang, and A. Greer, Philosophical Magazine Letters 85, 77 (2005).
- Yu et al. (2012) H. B. Yu, X. Shen, Z. Wang, L. Gu, W. H. Wang, and H. Y. Bai, Physical Review Letters 108, 015504 (2012).
- Schroers and Johnson (2004) J. Schroers and W. L. Johnson, Physical Review Letters 93, 255506 (2004).
- Shi et al. (2014) Y. Shi, J. Luo, F. Yuan, and L. Huang, Journal of Applied Physics 115, 043528 (2014).
- Taub and Spaepen (1981) A. Taub and F. Spaepen, Journal of Materials Science 16, 3087 (1981).
- Kanik et al. (2014) M. Kanik, P. Bordeenithikasem, G. Kumar, E. Kinser, and J. Schroers, Applied Physics Letters 105, 131911 (2014).
- Schreck et al. (2013) C. F. Schreck, R. S. Hoy, M. D. Shattuck, and C. S. O’Hern, Physical Review E 88, 052205 (2013).
- Regev et al. (2013) I. Regev, T. Lookman, and C. Reichhardt, Physical Review E 88, 062401 (2013).
- Fiocco et al. (2014) D. Fiocco, G. Foffi, and S. Sastry, Physical Review Letters 112, 025702 (2014).
- Priezjev (2016) N. V. Priezjev, Physical Review E 93, 013001 (2016).