iMet: A computational tool for structural annotation of unknown metabolites from tandem mass spectra
Abstract
Untargeted metabolomic studies are revealing large numbers of naturally occurring metabolites that cannot be characterized because their chemical structures and MS/MS spectra are not available in databases. Here we present iMet, a computational tool based on experimental tandem mass spectrometry that allows the annotation of metabolites not discovered previously. iMet uses MS/MS spectra to identify metabolites structurally similar to an unknown metabolite, and gives a net atomic addition or removal that converts the known metabolite into the unknown one. We validate the algorithm with 148 metabolites, and show that for 89% of them at least one of the top four matches identified by iMet enables the proper annotation of the unknown metabolite. iMet is freely available at http://imet.seeslab.net.
1 Introduction
The great success in the characterization of genes, transcripts and proteins is a direct consequence of two factors. First, such molecules result from the concatenation of a small set of known monomers, namely, nucleotides and amino acids. Second, existing technologies and bioinformatic tools allow for the amplification and subsequent accurate characterization of the sequence of monomers. Metabolomics, in contrast, aims to identify and elucidate the structure of metabolites, which are not sequences of monomers and do not result from a residue-by-residue transfer of information. Instead, the large diversity of metabolites in living organisms results from series of chemical transformations catalyzed mainly by enzymes.
As for the identification of proteins in proteomics, structural annotation of metabolites in complex biological mixtures relies on tandem mass spectrometry (MS/MS) analysis. However predicting MS/MS spectra for metabolites is much more challenging than for peptides. In practice, therefore, annotating metabolites relies on their MS/MS spectra being present in reference databases [1, 2, 3, 4]. In the simplest situation, the sample metabolite and its MS/MS spectra are already included in a reference database, so that the metabolite is annotated by matching both the intensities and the mass-to-charge values of each fragment ion to values from pure standard metabolites in the database.
Unfortunately, MS/MS spectra of a large number of known metabolites are not described in databases [5]. To assist the structural annotation of such metabolites, efforts have emerged recently to heuristically predict fragmentation patterns in silico and compare these to experimental MS/MS spectra [6, 7, 8, 9, 10, 11, 12, 13]. Other methods are not based on MS/MS data and instead use the accurate mass of MS peaks. These methods often require additional information about the sample metabolite (e.g. pathways in which they participate), and the use of high precision instruments and techniques such as the Fourier Transform Ion Cyclotron Resonance (FTICR) or Orbitrap Fourier transform MS [14, 15, 16]. Despite these efforts, the false positive rate of these methods is still too high to use them in untargeted metabolomics analysis.
Finally, in the most challenging case (which, arguably, is also very common), the sample metabolite is completely unknown, that is, the metabolite is not described in databases [17]. Existing approaches for this situation use neutral losses and characteristic fragment ions as signatures for unique chemical functional groups. These approaches have proved to be effective for classifying very specific lipid structures such as acyl-carnitines (e.g., fragments at m/z 85,02 and 60,08), glycerolipids, glycerophospholipids (e.g., fragment m/z 184.07) and sphingolipids [18, 19, 20]. However, there is not a general tool that allows structural annotation of unknown metabolites from their MS/MS spectra.
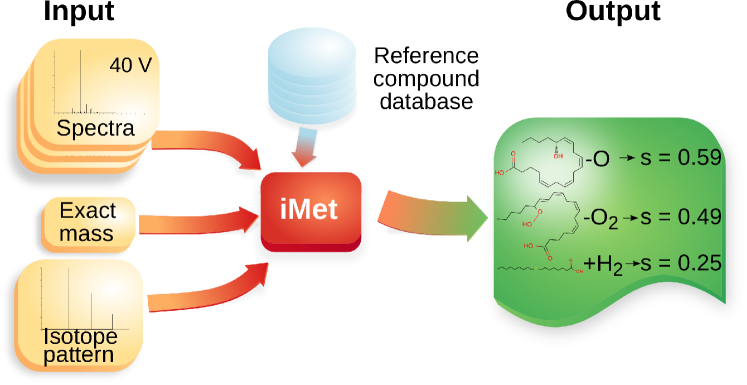
To help in the annotation of completely unknown metabolites we have developed iMet, a computational tool designed to fill that gap (Fig. 1; iMet is avilable online at http://imet.seeslab.net). Its two only inputs are the ESI Q-TOF MS/MS spectra and the exact mass of an unknown metabolite (i.e., a metabolite that is not yet annotated in any database). Optionally, to increase the accuracy, the isotopic pattern of the intact unknown ion can also be supplied. Given these inputs, the algorithm identifies metabolites in a reference database that are likely to be structurally very similar to the unknown metabolite. Finally, iMet produces a sorted list of candidates, ranked by their similarity to the unknown metabolite. The algorithm also suggests the chemical transformation that is most likely to separate each of the candidates from the unknown metabolite.
2 Basic principle of iMet
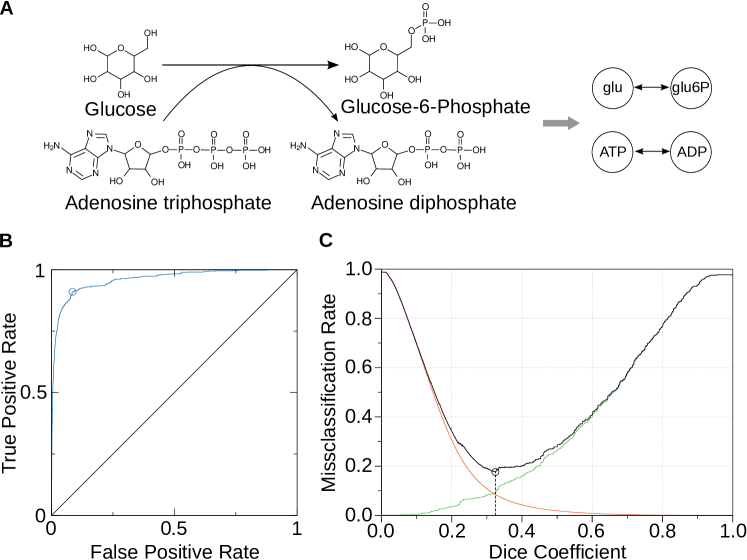
Metabolites can be represented as nodes in a network; two metabolites A and B are connected, that is, are neighbors, if one can obtain the chemical structure of B by a chemical transformation of A, and vice versa (see Fig 2A). By a chemical transformation here we mean the addition or removal of a moiety, or a conformational change. By definition, neighbor metabolites are structurally more similar than a typical pair of non-neighbor metabolites, and this structural similarity should be reflected in their MS/MS spectra because the fragmentation pattern of a metabolite highly depends on its chemical structure. Therefore, from the MS/MS spectrum of a metabolite that is not annotated in the network, a trained algorithm should be able to locate possible neighbors on the basis of spectral similarity.
To probe this idea, we built a network of neighbor metabolites on the basis of 814 “reactant pairs” (RP) defined in the KEGG database [21]. In KEGG, substrates and products of a known biochemical reaction are paired according to their chemical structure using graph theory [22] (see Fig 2A). By construction, the two metabolites in a RP are neighbors in the network, so we use RPs as ground truth for neighborhood. (Note, however, that not all neighbor metabolite are annotated as RPs in KEGG. This occurs, for example, when there is no described biochemical reaction that can transform one into the other, even though they are structurally very similar. Thus, the network of RPs in KEGG and our dataset of neighbor metabolites is a subgraph of the full network of neighbor metabolites that potentially exist in nature.)
2.1 Neighbor metabolites share structural similarities
To assess the structural similarity between neighbor metabolites, we computed the Dice coefficient [23] between ECFP4 molecular fingerprints [24] of pairs of metabolites. We obtained the molecular fingerprint for 5,060 different metabolites from public databases, including 932 metabolites listed in KEGG as forming a RP with another metabolite (and thus, being effectively a neighbor of another metabolite in the network). We compared all the possible pairs of structures and computed the receiver operating characteristic (ROC) curve [25], to check if structural similarity could be used to discriminate between neighbors and non-neighbor metabolites (Fig 2B). An overall measure of the discriminatory power is the area under the ROC curve (AUC statistic), which indicates how often RP (and in general, neighbor metabolites) have a higher structural similarity than metabolites that are not RPs. The value of the AUC found in this case was of 0.96, indicating that in the vast majority of cases, two metabolites that are neighbors (that are one chemical tranformation away from each other) have a more similar structure than those that are not. We also found that 95% of the RPs have a Dice coefficient higher than 0.22.
With the aim of establishing the best threshold in a scale of 0 to 1 to separate between RPs and non RPs, we looked for the Dice coefficient value that minimizes the classification errors. To do so, we calculated the False Positive Rate (FPR) and the False Negative Rate (FNR) at each value of the Dice coefficient. In this context, the FPR corresponds to the proportion of non RPs that have a higher Dice coefficient value than a given threshold, while the FNR represents the ratio of RPs that have a Dice coefficient value lower than that same threshold (Fig 2C). Adding these two curves into a third curve, we obtain the missclassification ratio, that is the ratio of pairs of metabolites that would be incorrectly classified if we used a certain value of their Dice coefficient to discriminate between RPs and non RPs. We found that the missclassification ratio is minimal for a Dice coefficient value of 0.32, with a FPR of 0.09 and a FNR of 0.09, for a total missclassification ratio of 0.18 (highlighted in Fig 2B and C). By using this value as a threshold to separate between RPs and non RPs the classification error is minimum.
2.2 Neighbor metabolites have similar MS/MS spectra
In order to numerically quantify the similarities between two MS/MS spectra, we use the cosine similarity, as this method is both time efficient and accurate (see Supplementary Data and Supplementary Table S1 for a discussion). In particular, we discretize each spectrum in equal intervals of width . In this way, for each spectrum we can construct an intensity vector in which element corresponds to the relative intensity of m/z values in the interval []. (Note that we use = 0.01Da, and we disregard relative intensity values below 1% of the highest m/z value.) Then, the cosine similarity between spectra and is simply the dot product of the two vectors divided by the product of their norms.
| (1) |
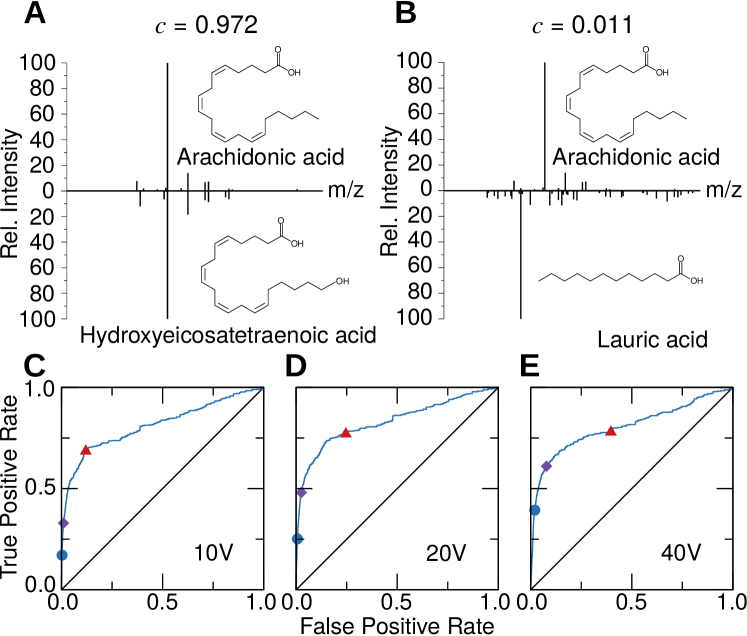
To validate the hypothesis that spectral similarity is indicative of neighborhood in the network, we quantified to which extent metabolites that are neighbors have similar MS/MS spectra (Fig. 3). To this end, we considered all metabolites in KEGG for which we had the experimental MS/MS spectra from public databases (HMDB [26], MassBank [27] and METLIN [28]), which corresponds to 1,763 metabolites, and compared their spectra using the cosine similarity (Fig. 3A and B).
We used the ROC curve to quantify the power of spectral similarity to distinguish pairs of metabolites that are RPs in KEGG (and, therefore, neighbors) from those that are not (Fig. 3C, D and E). In this case, the area under the ROC curve indicates how often RP metabolites have a higher spectral similarity than metabolites that are not RPs. For the three collision energies 10V, 20V and 40V in negative ionization mode, we found AUC = 0.81, AUC = 0.83 and AUC = 0.80, which indicates that the similarity between MS/MS spectra is useful to identify neighbor metabolites. Comparing MS/MS spectra in positive ionization mode gave similar AUC values.
Note that these metrics quantify the predictive power of the spectral similarity when comparing only two MS/MS spectra with the same collision energy and ionization mode.
In general, MS/MS spectra acquired at high collision energies have higher sensitivity but lower specificity, and conversely for low collision energies. This implies that comparing two spectra obtained at high collision energies results in a highly conservative classification method, discarding pairs that are actually neighbor metabolites (low specificity or true negative rate), but assuring that most of the metabolites classified as neighbor metabolites are real neighbors (high sensitivity or true positive rate). In contrast, spectral similarity becomes a poorer classification method at low collision energies: while most of the neighbor metabolites are correctly classified as such, some non-neighbor metabolites are also labeled as neighbors. Finally, the analysis reveals that information is usually non-redundant–some pairs of metabolites have high spectral similarity at high collision energies and low similarity at low energies, whereas for other pairs the opposite is true.
These results indicate that, indeed, spectral similarity at a fixed collision energy is predictive to some extent. As we show next, however, the predictive power of spectral similarity can be increased by considering spectra at different collision energies simultaneously, and combining them with mass difference, and, optionally, the isotopic pattern of the unknown metabolite (i.e., precursor ion).
2.3 Neighbor metabolites have well-defined mass differences, which correspond to well-defined chemical transformations
To complement the information obtained from the spectral similarity, we study the differences in exact mass between neighbor metabolites (Fig. 4). The mass difference between two metabolites corresponds to the mass of the group of atoms added to (or removed from) one of the metabolites to convert it into the other.
As before, we take the mass difference, , between KEGG RPs as ground truth. We considered 5,060 different metabolites including 814 RPs. Even though the KEGG database comprises more RPs, the limiting factor is how many of these RPs have MS/MS spectra in public databases. We are convinced that adding more metabolites (165 by December 2015) to the analysis (out of a total of 5,060 metabolites currently considered) would not alter the results presented other than increasing its accuracy. Calculating the mass difference for every pair of metabolites in our database and plotting the proportion of RPs for each value of the mass difference yields a histogram that we assume reflects the probability of two metabolites being neighbors given their mass difference, although specific systems may deviate from this general (average) pattern [29].
As we show in Fig. 4A, this distribution displays well-defined maxima at specific values. Therefore, it is much more likely that two metabolites are neighbors if their corresponds to one of the maxima of the distribution in Fig. 4A.
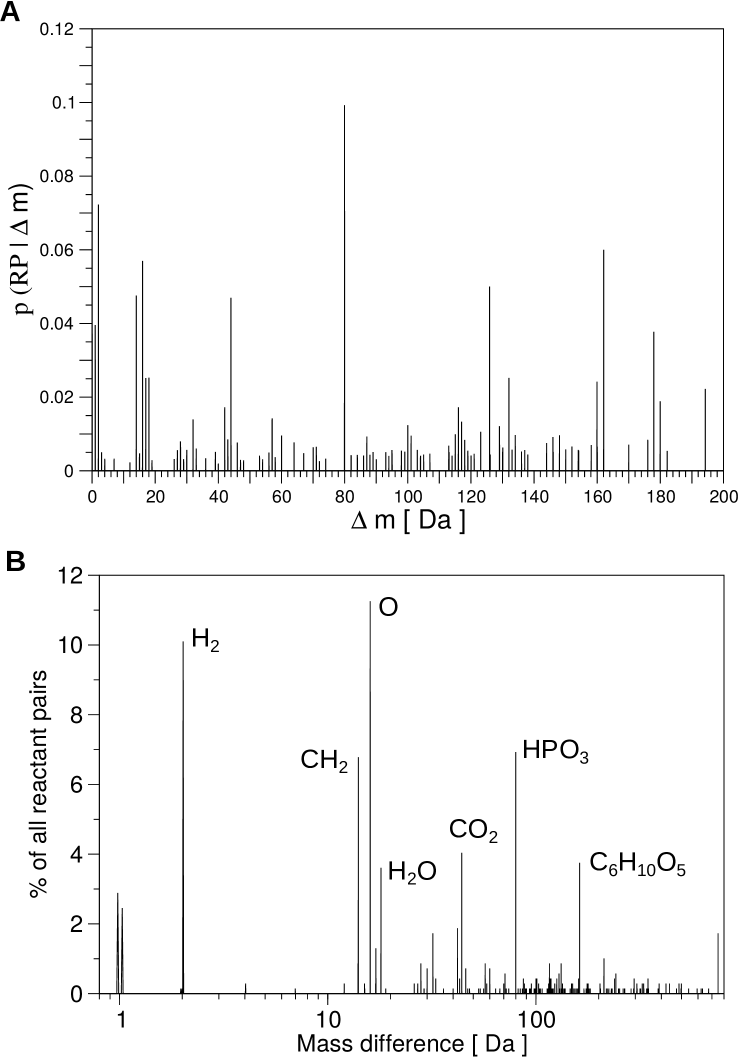
To understand what these represent, we extracted 202 distinct chemical transformations from a total of 814 reactant pairs, (see Supplementary Table S2). Since each chemical transformation implies a well-defined mass difference, the distribution of mass differences among RPs is localized around certain values that correspond to the most common interconversions of atoms (Fig. 4B). For example, 11.3% of all reactant pairs correspond to the net addition of an oxygen atom (=15.995 Da), 10.1% to the net addition of H (=2.016 Da), and 6.9% to the addition of a phosphate group (=79.966 Da). In summary, a relatively small number of transformations account for a large number of the observed RPs (for example, the seven most common transformations account for 46% of the pairs).
2.4 A random forest classifier identifies neighbor metabolites on the basis of mass difference and MS/MS spectral similarity
Taken together, our results indicate that MS/MS spectral similarity and mass difference are both predictive of neighborhood between two metabolites. Therefore, given an unknown metabolite and a library with MS/MS spectra, we propose that it is possible to identify the metabolites in the library that are most likely to be neighbors of the unknown one.
To demonstrate this, we implemented a random forest classifier [30] to identify potential neighbors. The random forest classifier has the advantage of automatically taking care of the non-monotonic relationship between mass difference and probability of neighborhood, as well as the complex non-linear similarity patterns between MS/MS spectra at different collision energies. We trained the classifier using 50,000 metabolite pairs, including all RPs for which we have MS/MS spectra and completed with randomly chosen pairs among a library of 5,060 compounds with MS/MS data in databases such as HMDB [26], MassBank [27], and METLIN [28]. Increasing the size of the training set slowed the training to the point of making it unfeasible, and did not result in an increase of the accuracy of the classifier (because adding more pairs of unrelated compounds did not provide new useful information to the model).
Based on the accurate mass-to-charge (m/z) measurement of a protonated (M+H) or deprotonated (M-H) precursor ion of the unknown metabolite (mass error <0.005 Da), its MS/MS spectra, and its experimental isotopic distribution when available, the trained classifier yields a sorted list of candidate neighbors of the unknown metabolite (Fig. 1), chosen from amongst the 5,060 compounds included in our database. Moreover, iMet uses the most common chemical transformation between RPs (Fig. 4B) to predict the unknown metabolite’s chemical formula.
All in all, iMet outputs a sorted list of candidate neighbors of the unknown metabolite on the basis of mass difference and MS/MS spectral similarity. For every candidate, and given its mass difference with the unknown metabolite, iMet gives the chemical transformation (group of atoms) that converts the candidate into the unknown metabolite. The reliability of the prediction is given as a numeric score (), whose value goes from 0 for the least reliable to 1 for the most reliable.
3 Materials and Methods
3.1 Construction of the classifier
We used the R package “randomForest” for the classifier [31]. We trained the classifier with a dataset that contains all the RPs in the KEGG database for which we have MS/MS spectra (814 pairs), plus an additional 49,186 randomly chosen pairs of metabolites. Therefore, we trained the algorithm with 50,000 pairs of metabolites, a set deliberately enriched with RPs. We need the training compounds to be in KEGG because we use KEGG reactant pairs as our ground truth for compound neighborhood. Increasing the size of the training set did not alter significantly the results obtained. The classifier uses the following features: (i) the cosine similarity between the MS/MS spectra of the two metabolites at all available collision energies; (ii) the fraction of metabolite pairs with the observed mass difference that are actually reactant pairs according to the KEGG database. The classifier tries to predict whether the pair of metabolites are neighbors or not.
Our classification algorithm takes also into account experimental mass errors. Specifically, we introduced a shift in the exact mass of every metabolite of the training dataset, changing its mass to a value randomly drawn from a Gaussian distribution centered around the exact mass of the metabolite and a standard deviation of 0.0025Da. This way, the algorithm correctly deals with the experimental error of the unknown target metabolite.
3.2 MS/MS database
Our database is composed of 29,242 MS/MS spectra from 5,060 different compounds obtained from the databases HMDB [26], MassBank [27] and METLIN [28], obtained with a Q-TOF instrument and at different collision energies and ionization modes. Although it is true that HMDB contains 45.000 compound entries, only 8% of those compounds have electrospray ionization MS/MS spectra. A similar percentage of the compounds in METLIN have this type of spectra. All in all, with electrospray ionization MS/MS spectra for 5,060 compounds, our reference database is about as comprehensive as one can get nowadays [5].
3.3 iMet step by step
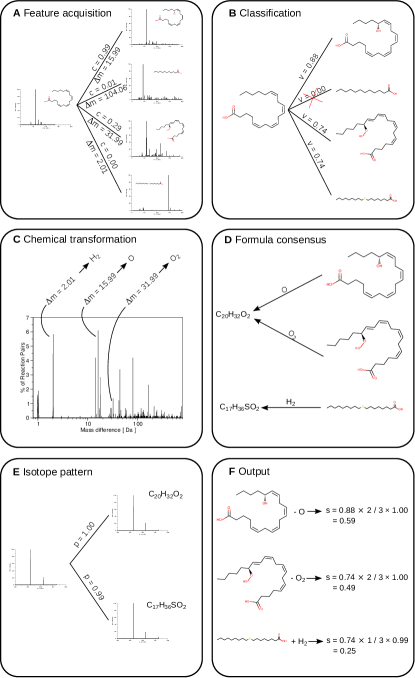
Given an unknown metabolite , a reference set of metabolites , and a trained random forest (see “Construction of the classifier” above), the algorithm builds a list of candidate neighbors of as follows (Fig. 5):
-
1.
Obtaining spectral similarities and mass differences: Given an unknown metabolite , the algorithm computes the cosine similarity between the unknown metabolite’s ESI Q-TOF MS/MS spectra and every MS/MS spectra in the database obtained under the same experimental conditions (i.e., ionization mode and collision energy). Spectral similarity is calculated for each collision energy separately, that is, we do not combine or merge spectra from different collisions energies. Our algorithm can work using just one or two collision energies, but it performs better if all possible collision energies are provided as input data. The algorithm also computes the exact mass of , as the precursor ion mass plus or minus the hydrogen atom mass, depending on the ionization mode ([M+H]+ or [M-H]-, for positive or negative ionization, respectively). Although other possible adducts can be formed, the protonated adducts are by far the most abundant in ESI-MS and their MS/MS spectra are prevalent in databases [5], and so iMet only takes into account protonated adducts (although application to other adducts would be immediate).
With the exact mass MS of the unknown metabolite, the algorithm computes the mass difference between and every metabolite in the reference set . In each case, the algorithm obtains the fraction of all metabolite pairs with that that are actually reactant pairs. We assume that this ratio reflects the probability of two metabolites being neighbors given only their mass difference (Fig. 4A).
-
2.
Classification: Using the spectral similarity obtained from the comparison of MS/MS spectra and the ratio of RPs from the calculated mass difference, the classification algorithm computes the likelihood for each metabolite in the database of being neighbors with the unknown metabolite (score ). Those metabolites in the database with a likelihood lower than 0.5 are discarded; the remaining metabolites are the most likely to form a RP with the unknown metabolite. These are the candidate neighbors of the unknown sample.
-
3.
Determination of the chemical transformation: From the mass difference of each candidate neighbor, the algorithm proposes the most probable chemical transformations linking each candidate to the unknown metabolite. Specifically, the algorithm considers all possible molecular formulas that are compatible with the observed mass difference. Note that, in general, these molecular formulas coincide with one of the 202 unique chemical transformations derived from RPs listed in Supplementary Table S2.
-
4.
Formula consensus: Given that the molecular formulas of the candidate neighbor and its associated chemical transformation are known (from step (3)), the algorithm postulates a final formula for the unknown metabolite based on the sum of these two formulas. The algorithm then computes the frequency of each potential final formula as the proportion of candidate neighbors and their chemical transformation that yield that same molecular formula. Then, in order to resolve possible ties, the algorithm favors simple chemical transformations over complex ones by dividing the frequency of each final formula by the square root of the number of atoms associated with the chemical transformation. This final number is the formula consensus score (score ).
-
5.
Isotope pattern comparison: The theoretical MS isotope pattern of every final formula is computed (as described in “Elucidation of the theoretical isotope pattern” in the Supplementary Data), and compared to the experimental isotope pattern of the unknown metabolite. As before, we use the spectral similarity previously defined. Consequently, the algorithm associates every candidate neighbor with a spectral similarity (score ) based on its isotopic distribution.
-
6.
Output: for each unknown metabolite-candidate neighbor pair, we have an overall score ()
(2) where, again, is the score of the RF classifier, the formula consensus score, and is the spectral similarity between theoretical and empirical isotopic patterns.
All in all, the outcome of our algorithm is a sorted list of candidate neighbors of the unknown sample , ranked by their score .
4 Results and discussion
4.1 Cross-validation of iMet using 148 test metabolites
To validate iMet, we experimentally obtained in our laboratory MS/MS spectra of 48 metabolites in different conditions, for a total of 52 different tests as some metabolites are tested in both positive and negative ionization modes separately (all the test spectra can be found in Supplementary File 1; see also Supplementary Table S3 for cross-references in different databases of the test metabolites used). To ensure structural and biochemical diversity of tests, these include nucleotides and nucleosides, both natural and unnatural amino acids, vitamins, sphingolipids, polyamines and fatty acids, among others (see Supplementary Table S4 for a complete listing of pathways covered by these tests). We excluded their spectra from the training set and manually removed their entries from our database, effectively turning them into unknown compounds for the purpose of validation. For these 48 metabolites, we ran iMet against a reference database of 5,012 compounds (see “MS/MS database” above) and evaluated the quality of each prediction. We considered two metabolites (the unknown metabolite and the candidate output by iMet) to be structurally similar if the Dice coefficient of their molecular fingerprints was above 0.32. In these validation tests, 78% of the top candidates identified by iMet were, indeed, structurally similar to the target, with the correct chemical transformations (Fig. 6, see also Supplementary Table S5 for complete results). For 91% of the cases, at least one of the top four candidates suggested by iMet was structurally similar to the target, and the proposed chemical transformation was also correct.
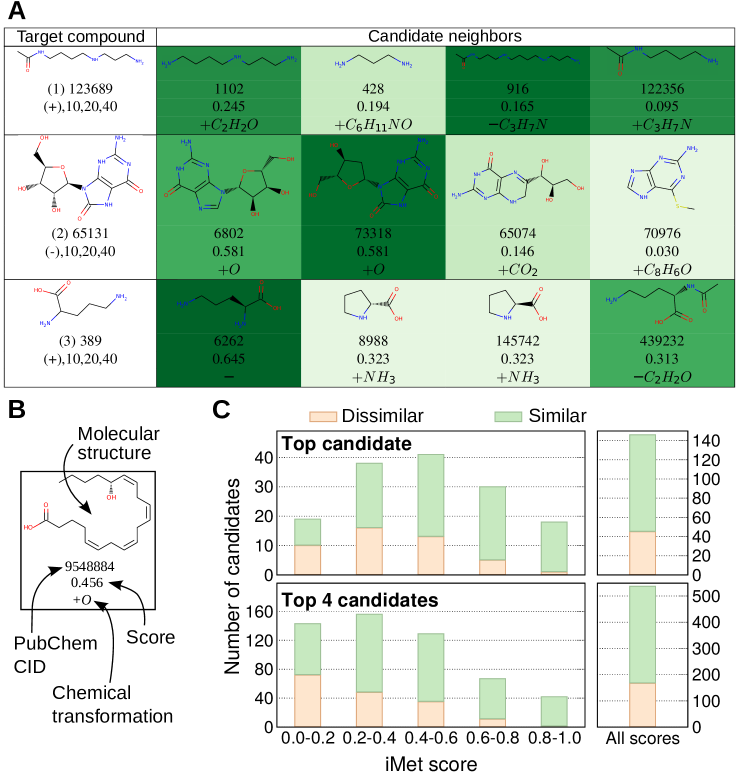
We further validated the algorithm using 100 randomly selected metabolites (see Supplementary Table S3 for cross-references and S6 for the pathway coverage of these tests) whose MS/MS spectra we took directly from our reference MS/MS database of 5,060 metabolites. We followed a leave-one-out cross-validation procedure, so each metabolite was tested individually removing it from the database. In this validation, 65% of the top candidates were structurally similar (Dice coefficient ¿ 0.32) to the unknown test metabolite, 67% of candidate neighbors among the top four are structurally similar to the test metabolite, and in 88% of the cases the algorithm predicted that one of the top four candidates was structurally similar to the test metabolite (see Fig. 6 and Supplementary Table 7 for the complete table of results).
Overall, combining both cross-validation experiments, iMet was able to correctly identify the unknown test metabolite from the top candidate in 69% of the cases. In 89% of the cases at least one of the top four candidates was structurally similar to the test metabolite. In 88% of the cases, the top formula proposed by iMet was the correct formula of the test metabolite.
4.2 The CASMI challenge
To test iMet under the most challenging circumstances, we tested it using those metabolites proposed in the Critical Assessment of Small Molecule Identification (CASMI) challenges from years 2012-2014. We downloaded the spectra for 32 metabolites obtained using an ESI-QTOF mass spectrometer. From these, 26 metabolites were obtained using other collision energies than those used in the training set (10, 20 or 40V). We tested them nevertheless to evaluate the performance of iMet when confronted with spectra obtained using inaccurate experimental data (for example, we introduced spectra obtained at 25V as if they were obtained at 20V; or 35V spectra as if they were 40V). For these 26 metabolites, 60% of the top candidates suggested by iMet were structurally similar to the test metabolite, and in 70% of the results iMet was able to locate at least one structurally similar metabolite in the database (see Supplementary Table S8).
When including in the test metabolites from the CASMI challenges that were obtained using collision energies of 10, 20 or 40V (for a total of 45 different tests), iMet located at least one structurally similar metabolite in 68% of the tests. 59% of the top candidates were structurally similar (Dice coefficient ¿ 0.32) to the unknown test metabolite. These results suggest that iMet does not decrease substantially its accuracy when using slightly “erroneous” collision energies as inputs.
4.3 Conclusions
We have demonstrated that experimental MS/MS spectra can be used to their full advantage for the structural annotation of unknown (i.e., undiscovered) metabolites, unlike previous approaches that use tandem MS spectral similarity [2, 3, 4] or in silico predictions of MS/MS spectra to identify known metabolites [7, 8, 9, 10, 11, 12, 13, 18]. In terms of MS/MS information, we have systematically demonstrated that MS/MS spectral similarity has enough discriminatory power to distinguish between neighbor metabolites from non-neighbor metabolites.
Our cross-validation demonstrates that iMet is only limited by the experimental MS/MS library against which the unknown metabolite is compared, and to a lesser extent the coverage of reactant pairs and the space of chemical structure transformations. In particular, iMet will fail to annotate correctly an unknown metabolite when no structurally similar metabolites are present in the reference database. With databases having MS/MS spectra for only 8-10% of their compounds [5], this may seem a serious limitation. However, a simple calculation suggests otherwise. Indeed, if each metabolite has, say, 10 neighbors, 6 of which are known, then there are roughly 4 times as many unknown metabolites (neighbors of known metabolites) as known metabolites; and there are roughly 4x10 times as many metabolites that are 2 biotransformations away from the known ones. One can therefore see that an exponentially large number of new metabolites can be reached from even a comparatively small set of known ones, which is a well understood fact that has been well studied within the network science literature (and, in particular, within the literature on the structural properties of metabolic networks). We anticipate that as the number of MS/MS spectra from known metabolites rises in public databases, so will do the predicting power of iMet.
Regarding chemical transformations, our network of reactant pairs is restricted to those biochemical reactions described in the KEGG database, which does not account for all chemical transformations occurring at any biological system. The KEGG is, however, to our knowledge the only database that systematically shows paired substrates and products according to their structure transformations using graph theory [22]. The significance of using this information is that we can compute the probability of two metabolites being neighbors on the basis of the mass difference between them, without taking into consideration other attributes such as their chemical structures [33], functional groups, chemical reactivity or metabolic pathways [34]. Rather, iMet uses a large set of chemical transformations described in biological systems to propose chemical formulas and structures by adding (or removing) a group of atoms to a known chemical structure. This concept of chemical transformation is similar to that used previously by other computational approaches aiming to reduce the ambiguity in metabolite annotation [14, 15, 16, 34, 35]. Yet these previous approaches that do not make use of MS/MS data, require that the interrogated metabolite falls into a known metabolic pathway, and its chemical formula and structure must be known and described in a database [14, 15, 16, 35].
In summary, our algorithm has proven itself to be a unique tool in the annotation of unknown metabolites, as a stand-alone application. iMet does not propose structures de novo, since mass spectrometry cannot perform de novo identifications of chemical structures (unlike NMR). iMet is intended to provide key information, such as the molecular formula of the unknown compound, structurally similar (neighbor) compounds and the moiety (if necessary) to transform the known neighbors into the unknown, for organic chemists to propose candidate chemical structures based on chemical knowledge [17]. We also acknowledge its potential when coupled to other applications such as MetFrag [9], MetFusion [10], MAGMa [12], CFM-ID [13], or MS2Analyzer [19], for which the output of iMet could be used as inputs. This coupling would allow to circumvent the need for a priori information of interrogated metabolites, as iMet would provide a list of candidates without any other required information than its MS/MS spectra and its exact mass. By simulating the fragmentation pattern of those candidates, for example, the final result would be even more refined, achieving a higher accuracy in the identification of unknown metabolites.
Acknowledgments
The authors would like to thank Mr. Manuel Miranda for his help in the web implementation of the tool.
Funding
This work was supported by the James S. McDonnell Foundation [220020228], the Spanish Ministerio de Economía y Comptetitividad [SAF2011-30578 and BFU2014-57466 to O.Y. and FIS2013-47532-C3 to A.A-M, M.S-P., R.G.], and the European Union [PIRG-GA-2010-277166 to R.G., PIRG-GA-2010-268342 to M.S.P. and FET-317532-MULTIPLEX to M.S.P. and R.G.].
Conflict of interest: None declared.
References
- [1] G J Patti, O Yanes, and G Siuzdak. Innovation: Metabolomics: the apogee of the omics trilogy. Nature Reviews Molecular Cell Biology, 13:263–269, 2012.
- [2] M Rojas-Cherto, J E Peironcely, P T Kasper, J J J van der Hooft, R C H de Vos, and R Vreeken. Metabolite identification using automated comparison of high-resolution multistage mass spectral trees. Anal Chem, 84:5524–5534, 2012.
- [3] I Nikolskiy, N G Mahieu, Y J Chen, R Tautenhahn, and G J Patti. An untargeted metabolomic workflow to improve structural characterization of metabolites. Anal Chem, 85:7713–7719, 2013.
- [4] R Tautenhahn, K Cho, W Uritboonthai, Z Zhu, G J Patti, and Siuzdak G. An accelerated workflow for untargeted metabolomics using the METLIN database. Nat Biotechnol, 30:826–828, 2012.
- [5] M Vinaixa, E L Schymanski, S Neumann, M Navarro, R M Salek, and O Yanes. Mass spectral databases for lc/ms and gc/ms-based metabolomics: state of the field and future prospects. Trends Anal Chem, 78:23–35, 2016.
- [6] K Dührkop, H Shen, M Meusel, and S Rousu, M Böcker. Searching molecular structure databases with tandem mass spectra using csi:fingerid. Proc Natl Acad Sci USA, 112:12580–12585, 2015.
- [7] M Heinonen, H Shen, N Zamboni, and J Rousu. Metabolite identification and molecular fingerprint prediction through machine learning. Bioinformatics, 28:2333–2341, 2012.
- [8] L C Menikarachchi, S Cawley, D W Hill, L M Hall, L Hall, and S Lai. MolFind: A software package enabling HPLC/MS-based identification of unknown chemical structures. Anal Chem, 84:9388–9394, 2012.
- [9] S Wolf, S Schmidt, M Müller-Hannemann, and S Neumann. In silico fragmentation for computer assisted identification of metabolite mass spectra. BMC Bioinformatics, 11:148, 2010.
- [10] M Gerlich and S Neumann. MetFusion: integration of compound identification strategies. J Mass Spectrom, 48:291–298, 2013.
- [11] L Li, R Li, J Zhou, A Zuniga, AE Stanislaus, and Y Wu. MyCompoundID: Using an evidence-based metabolome library for metabolite identification. Anal Chem, 85:3401–3408, 2013.
- [12] L Ridder, J J J van der Hooft, S Verhoeven, R C H de Vos, J Vervoort, and R J Bino. In silico prediction and automatic LC−MSn annotation of green tea metabolites in urine. Anal Chem, 86:4767–4774, 2014.
- [13] F Allen, A Pon, M Wilson, R Greiner, and D Wishart. CFM-ID: a web server for annotation, spectrum prediction and metabolite identification from tandem mass spectra. Nucleic Acids Res, 42:W94–W99, 2014.
- [14] R Breitling, A R Pitt, and M P Barrett. Precision mapping of the metabolome. Trends Biotech, 24:543–548, 2006.
- [15] S Rogers, R A Scheltema, M Girolami, and R Breitling. Probabilistic assignment of formulas to mass peaks in metabolomics experiments. Bioinformatics, 25:512–518, 2009.
- [16] R J M Weber and M R Viant. MI-Pack: Increased confidence of metabolite identification in mass spectra by integrating accurate masses and metabolic pathways. Chemometr Intell Lab, 104:75–82, 2010.
- [17] J Kalisiak, S A Trauger, E Kalisiak, H Morita, V V Fokin, and M W W Adams. Identification of a new endogenous metabolite and the characterization of its protein interactions through an immobilization approach. J Am Chem Soc, 131:378–386, 2009.
- [18] T Kind, K Liu, DY Lee, B DeFelice, JK Meissen, and O Fiehn. LipidBlast in silico tandem mass spectrometry database for lipid identification. Nat Methods, 10:755–758, 2013.
- [19] Y Ma, T Kind, D Yang, C Leon, and O Fiehn. MS2Analyzer: A software for small molecule substructure annotations from accurate tandem mass spectra. Anal Chem, 86:10725–10731, 2014.
- [20] K Lynn, M Cheng, Y Chen, C Hsu, A Chen, and TM Lih. Metabolite identification for mass spectrometry-based metabolomics using multiple types of correlated ion information. Anal Chem, 87:2143–2151, 2015.
- [21] M Kanehisa, S Goto, S Kawashima, Y Okuno, and M Hattori. The KEGG resource for deciphering the genome. Nucleic Acids Res, 32:D27780, 2004.
- [22] M Hattori, Y Okuno, S Goto, and M Kanehisa. Development of a chemical structure comparison method for integrated analysis of chemical and genomic information in the metabolic pathways. J Am Chem Soc, 125:11853–11865, 2003.
- [23] L R Dice. Measures of the amount of ecological association between species. Ecology, 26:297–302, 1945.
- [24] D Rogers and M Hahn. Extended-connectivity fingerprints. J Chem Inf Model, 50:724–754, 2010.
- [25] J A Hanley and B J McNeil. The meaning and use of the area under a receiver operating characteristic (ROC) curve. Radiology, 143:29–36, 1982.
- [26] D S Wishart, T Jewison, A C Guo, M Wilson, C Knox, and Y Liu. HMDB 3.0–the human metabolome database in 2013. Nucleic Acids Res, 41:D801–D807, 2013.
- [27] H Horai, M Arita, S Kanaya, Y Nihei, T Ikeda, and K Suwa. MassBank: A public repository for sharing mass spectral data for life sciences. J Mass Spectrom, 45:703–714, 2010.
- [28] C A Smith, G O’Maille, E J Want, C Qin, S A Trauger, and T R Brandon. METLIN: A metabolite mass spectral database. Ther Drug Monit, 27:747–751, 2005.
- [29] K Morreel, Y Saeys, O Dima, F Lu, Y Van de Peer, R Vanholme, J Ralph, B Vanholme, and W Boerjan. Systematic structural characterization of metabolites in arabidopsis via candidate substrate-product pair networks. Plant Cell, 26:929–945, 2014.
- [30] L Breiman. Random forests. Machine Learning, 45:5–32, 2001.
- [31] A Liaw and M Wiener. Classification and regression by randomForest. R News, 2:18–22, 2002.
- [32] E Bolton, Y Wang, P A Thiessen, and S H Bryant. PubChem: Integrated platform of small molecules and biological activities. Annual Reports in Computational Chemistry, 4:217–240, 2008.
- [33] M A Hamdalla, S Rajasekaran, DF Grant, and I I Măndoiu. Metabolic pathway predictions for metabolomics: A molecular structure matching approach. J Chem Inf Model, 55:709–718, 2015.
- [34] S Li, Y Park, S Duraisingham, F H Strobel, N Khan, and Q A Soltow. Predicting network activity from high throughput metabolomics. PLoS Comput Biol, 9:e1003123, 2013.
- [35] G T Gipson, K S Tatsuoka, B A Sokhansanj, R J Ball, and S C Connor. Assignment of MS-based metabolomic datasets via compound interaction pair mapping. Metabolomics, 4:90–103, 2008.