Enhanced Star Formation of Less Massive Galaxies in a Proto-Cluster at z=2.5
Abstract
We investigate a correlation between star-formation rate (SFR) and stellar mass for emission line galaxies (HAEs) in one of the richest proto-clusters ever known at , USS 1558-003 proto-cluster. This study is based on a 9.7-hour narrow-band imaging data with MOIRCS on the Subaru telescope. We are able to construct a sample, in combination with additional -band data taken with WFC3 on Hubble Space Telescope (HST), of 100 HAEs reaching the dust-corrected SFRs down to 3 M⊙ yr-1 and the stellar masses down to M⊙. We find that while the star-forming galaxies with M⊙ are located on the universal SFR-mass main sequence irrespective of the environment, less massive star-forming galaxies with M⊙ show a significant upward scatter from the main sequence in this proto-cluster. This suggests that some less massive galaxies are in a starburst phase, although we do not know yet if this is due to environmental effects.
Subject headings:
galaxies: clusters: general — galaxies: clusters: individual (USS 1558-003) — galaxies: evolution1. Introduction
Since the last decade, the question of a positive correlation between SFR and stellar mass in star-forming galaxies (SFGs), which is called the main sequence (MS) of SFGs, has been one among hot topics in the field of galaxy evolution (e.g., Noeske et al., 2007; Daddi et al., 2007; Elbaz et al., 2007). The tight correlation provides us with perspectives of how the SFGs evolve over cosmic time: They spend most of their lifetimes on the sequence and evolve along the MS. However, a small fraction of them shows starburst activities, and they deviate upwards from the MS (Rodighiero et al., 2011).
During the course of hierarchical structure formation, galaxy evolution is expected to proceed in different ways in different environments. It is suggested that such environmental effects are more preferentially seen in satellite galaxies rather than in central galaxies at (e.g., Peng et al., 2012; Kovač et al., 2014). Some environment-dependent processes such as galaxy interactions/merging and gas inflows/outflows can alter the star-formation activity in galaxies, either boosting it or truncating it. Understanding the physical mechanisms of these processes is of vital importance to reveal the origin of early-type galaxies and the strong environmental dependence of galaxy properties seen in the present-day Universe.
With this motivation, we have been conducting a systematic project called MAHALO-Subaru (MApping H-Alpha and Lines of Oxygen with Subaru; Kodama et al. (2013)) and mapping star-formation activities over a wide range of environments and across cosmic times, in particular at , where clusters of galaxies are just assembling and galaxies are forming vigorously therein. The project has shown that integrated SFR per dynamical mass in cluster core increases dramatically with redshift up to (Shimakawa et al., 2014). However, Koyama et al. (2013) show that the location of the MS of SFGs in a proto-cluster (PKS1138–262) at is not different from that in the general field at similar redshifts, although the distribution of galaxies along the MS is skewed to higher SFRs and stellar masses in high density regions probably due to biased, more advanced galaxy formation there. Since our analyses have been limited to relatively massive galaxies ( M⊙) so far, we want to extend such study to an even less massive regime.
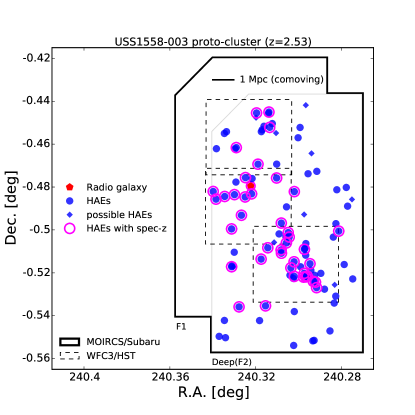
For this purpose, we target a proto-cluster around the USS 1558-003 radio galaxy at . Hayashi et al. (2012, hereafter H12) have already reported a narrow-band emission line survey as a part of MAHALO-Subaru. This previous observation has identified as many as 68 HAEs associated with the proto-cluster within a 27 arcmin2 field of view (FoV). It shows a linear filamentary structure which hosts three dense groups of HAEs. The richness and high density make it a unique proto-cluster target at for us to investigate the early environmental effects in the galaxy-formation phase.
To access less massive galaxies in the cluster, we have conducted very deep follow-up observations: One is three times deeper narrow-band imaging with Subaru Telescope. Another is deep HST/WFC3 imaging at near-infrared. In this Letter, based on these new unique imaging data-sets, we report the first intriguing discovery of the nature of the less massive SFGs ( M⊙) in this proto-cluster USS 1558-003 at , which has become accessible only with these deep observations.
2. Data
| Filter | Instrument/Telescope | Integration time | Limiting mag.aaThe limiting magnitudes are measured with a 1.2″ diameter aperture, except for 0.4″ aperture for WFC3/HST image. | PSF | Proposal ID | |
|---|---|---|---|---|---|---|
| (minutes) | (5) | (arcsec) | ||||
| Suprime-Cam/Subaru | 80 | 27.51 | 0.70 | S10B-028 | ||
| Suprime-Cam/Subaru | 90 | 27.24 | 0.63 | S10B-028 | ||
| Suprime-Cam/Subaru | 55 | 26.03 | 0.66 | S10B-028 | ||
| MOIRCS/Subaru | 191 | 24.85 | 0.55 | S10B-028, S15A-047 | ||
| WFC3/HST | 87 | 27.46 | 0.21 | GO-13291 | ||
| MOIRCS/Subaru | 45 | 23.78 | 0.47 | S10B-028 | ||
| MOIRCS/Subaru | 207 | 24.49 | 0.60 | S10B-028, S15A-047 | ||
| NB2315 | MOIRCS/Subaru | 583 | 23.90 | 0.52 | S10B-028, S15A-047 |
Note. — The FWHMs of point spread function (PSF) in all the Subaru images are matched to 0.67″ finally, except for the -band image which has a FWHM of 0.70″.
Since many of the imaging data used in this Letter are already published in H12, we mainly describe the new additional data obtained after H12. Data in , , and NB2315 are updated by further deep observations with MOIRCS/Subaru (Ichikawa et al., 2006; Suzuki et al., 2008) at a single pointing whose FoV corresponds to the field called ‘F2’ in H12 (S15A-047, PI: T. Kodama). During the observations from April 30 to May 6 in 2015, the weather was fine and the sky condition was photometric. Most of the frames were taken under the seeing condition of better than 0.6″. Combined with the H12 data, the total integration times sum up to 3.18, 3.45, and 9.72 hours in , , and NB2315 (Table 1), respectively. All of the , , and NB2315 data are re-reduced in a standard manner using the data reduction package for MOIRCS (MCSRED ver.20150619111http://www.naoj.org/staff/ichi/MCSRED/mcsred.html by I. Tanaka). The details of the reduction are shown in our forthcoming main paper.
Observations with WFC3/HST in are conducted on July 5 and 9 in 2014 (GO-13291, PI: M. Hayashi). Three pointings with WFC3 are required to cover the structures found in H12 (Figure 1). Since it took two orbits for the observations in each pointing, the integration times are 5224 sec in total (Table 1). The reduction is carried out in a standard manner with pipeline. Using the task, multidrizzle, the pixel scale is changed to 0.06 arcsec per pixel (Koekemoer et al., 2011).
To summarize, the data-set that we use consists of six broad-band data ( and ) and the narrow-band (NB2315) data with Subaru, and the data with HST/WFC3. The , , and NB2315 images are deeper by 0.67, 0.84 and 0.89 mag. than those in H12 (Table 1).
3. Catalog
|
|
|
The photometric catalog is updated by taking the same procedures on the latest data set as in H12. However, since the HST image has much better PSF than that of the Subaru images (Table 1), source detection and photometry on the HST image are conducted independently. The HST and Subaru photometric catalogs are then combined by matching the detected objects within a 0.5″ radius circle.
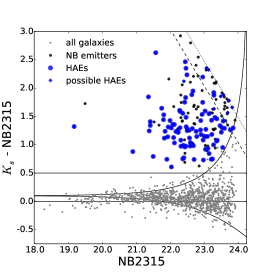
A procedure to select emission line galaxies is basically the same as in H12, but we redo the selection based on the updated catalog. First, we extract galaxies with more than 3 excess in -NB2315 color (left panel of Figure 2). Note that a correction of 0.1 mag. in -NB2315 color is required as a color term in estimating a continuum level underneath the emission line, because there is a difference of 0.163µm in the effective wavelengths between and NB2315 filters. We also apply the criterion of –NB23150.50. These criteria allow us to select 171 NB2315 emitters with line fluxes larger than 1.110-17 erg s-1 cm-2 and equivalent widths in the observed frame larger than 66Å. The limiting line flux corresponds to L(+[N II])= erg s-1 which turns out to be 2.4 times deeper than that in H12. It can be converted to a dust-free SFR of 2.2 M⊙ yr-1 (Kennicutt, 1998), where the contribution of [N II] to the line flux measured with NB, i.e. [N II]/(+[N II]), is assumed to be 0.25 (Sobral et al., 2013).
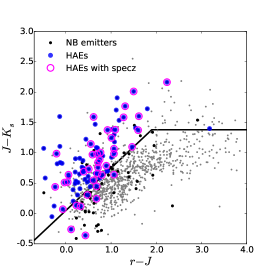
To eliminate lower- contaminant lines from the NB2315 emitter sample, we use the same color selection criteria as in H12 on the color–color diagram, versus (middle panel of Figure 2). However, some emitters are not securely detected in , , or , and we notice that almost all such galaxies are very faint in and . For many cases, we are thus not able to classify them according to color selection. We regard them as ‘possible emitters’. This may be justified by our Suprime-Cam/Subaru observation with NB428 narrow-band filter targeting emitters at the same redshift, which shows that most of the emitters are not detected or very faint (3) in and/or (Shimakawa et al. submitted).
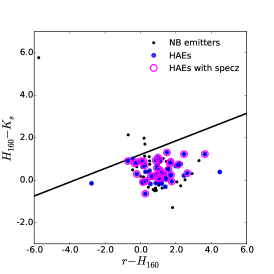
We have also found three contaminant [O III] emitters at in the follow-up spectroscopy (Shimakawa et al., 2014, 2015b). This suggests a necessity of applying an additional color selection to distinguish [O III] and at from at . We thus utilize the versus diagram as well for galaxies whose HST data are available. The deep HST photometries correspond to a bluer side of the Balmer/4000Å break for galaxies at . We set the boundary at () = 0.324 () + 1.2 based on the colors of the spectroscopically confirmed HAEs to distinguish the two populations (right panel of Figure 2). The slope of the criterion is parallel to a reddening vector estimated from the dust extinction curve of Calzetti et al. (2000). We note that color tracks modelled using the Bruzual & Charlot (2003) stellar population synthesis code also support the selection criterion. The color selection identifies four emitters as galaxies at . Furthermore, -band magnitudes of [O III] emitters at are more sensitive to attenuation by neutral hydrogen in the intergalactic medium than HAEs at (Madau, 1995). Non-detection or faint magnitude in imply that the galaxies are more likely to be located at . Thus, among the HAEs without spectroscopic confirmation and possible HAEs, 15 emitters without a detection at more than in or with are excluded from the samples. Note that all of the confirmed HAEs, except for one galaxy, have . We also note that 98% of the HAEs are detected in -band at 2 level, which suggests that there is little contamination of [O II] emission at .
Consequently, by applying these color selections, we select 91 HAEs and nine possible HAEs in total (Figures 1 and 2). Hereafter, we treat both HAEs and possible HAEs as SFGs at . Comparing with the sample of H12, the number of HAEs increases from 68 to 100, due to deeper NB2315 and images available in this study.
4. Main sequence of star-forming galaxies
We estimate stellar masses of the HAEs by fitting a library of evolutionary stellar population synthesis models (GALAXEV, Bruzual & Charlot, 2003) to spectral energy distribution (SED) with the six broad bands. The SEDs are hardly affected by nebular emission lines, because none of the strong lines but [O II] enter the broad bands. In modelling, we fix the redshift to the spectroscopic one, if available. Otherwise, we use the redshift of the radio galaxy (). We assume exponentially declining and constant star-formation histories. Acceptable ages are chosen from 50 Myr to the age of the Universe at that redshift. Stellar metallicities of or are applied, which are consistent with gas-phase metallicities of the HAEs measured by Shimakawa et al. (2015a). A dust extinction curve by Calzetti et al. (2000) is assumed and ranges from 0.0 to 3.0. Even if galaxies are faint in or , thanks to the deep and optical bands, a model SED is determined for most of the HAEs. However, 10 HAEs are not fitted by any of the model SEDs. In those cases, we estimate the stellar masses based on their magnitudes corrected for the mass-to-luminosity ratio (/) measured from their colors (H12, Kodama et al., 1998). We note that for the galaxies with SEDs available, the stellar masses derived from and are consistent with those determined by the SED fitting.
Next, we estimate SFRs of the HAEs using the luminosities derived from the narrow-band (NB2315) imaging (see H12 for more details). The contribution of [N II] is removed from the line flux by assuming the relation between the ratio of [N II]/ and the rest-frame equivalent width of EW0(+[N II]) given by Sobral et al. (2013). If the spectroscopic redshift is available, we correct the flux for the transmission of the NB filter at the wavelength of the line. We then correct for dust extinction using the calibration by Koyama et al. (2015) which estimates A() from the observed SFR(UV)/SFR() ratio and the stellar mass, where the of A() in the calibration is 0.282 mag (Koyama et al., 2015). We use -band magnitudes (i.e, rest-frame 1795Å) to estimate the rest-frame UV luminosity densities. The intrinsic luminosities thus derived are converted to SFRs using the Kennicutt (1998) calibration.
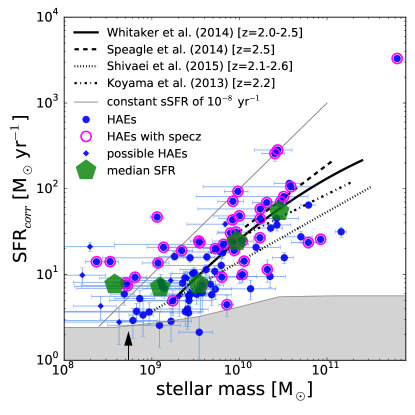
Figure 3 shows a positive correlation between SFR and stellar mass for the 100 HAEs, confirming the existence of the MS of SFGs. The shaded region in gray in Figure 3 shows our limit in SFR. This limiting SFR indicates that our data are deep enough for us to discuss the MS for SFGs fully down to stellar masses of M⊙ and we can still reach the upper half of the MS galaxies down to M⊙. At the lowest mass regime of M⊙, we would no longer be able to access the MS galaxies if the sequence is extrapolated to the low mass, and we could see only the SFGs with enhanced star-formation activities above the MS.
5. discussion
Until now, there have been a number of previous studies that investigated the MS of SFGs at (e.g., Dunne et al., 2009; Karim et al., 2011; Reddy et al., 2012). Figure 3 also compares the MSs derived from the previous studies. Our HAEs with stellar masses of M⊙ seem to be located right on the previously measured MSs in the literature (Whitaker et al., 2014; Shivaei et al., 2015; Speagle et al., 2014). Since these previous studies mainly look at galaxies in the general fields, the agreement suggests that SFGs in the proto-cluster at share the same MS as field SFGs at similar redshifts, consistent with the previous studies (Koyama et al., 2013; Cooke et al., 2014).
On the other hand, at lower stellar masses ( M⊙) in the proto-cluster, there are several galaxies that are significantly up-scattered above the MSs. If such small mass galaxies all follow the same extrapolated MS, they would be all located below our detection limit and we would not see any of them, contrary to what we actually see. Although we cannot discuss the exact locations of the MS at M⊙ due to incompleteness, we argue that there are at least some HAEs that are significantly deviated upward from the MS. Those more than 10 up-scattered HAEs at M⊙ have exceptionally large specific SFRs (sSFR=SFR/) above 10-8 yr-1 as shown by the light solid line in Figure 3. This indicates that their inferred ages (timescales of star formation) are smaller than 108 years, and they are young starbursting galaxies just being formed. Note that this result is not affected by dust corrections, because the amount of dust correction is progressively lower for less massive galaxies (Garn & Best, 2010; Koyama et al., 2015). In fact, the inferred A() for almost all of the galaxies with M⊙ are smaller than 0.2 mag. Even if we use the rest-frame UV luminosities to derive SFRs of the HAEs instead of luminosities, we also find the existence of HAEs above the MS at the faint end.
Our results suggest that while the majority of massive galaxies are already settled in a secular evolution phase and are thus found on the MS, some less massive galaxies are in a starburst phase and they are significantly up-scattered from the MS. This may be consistent with the down-sizing scenario of mass-dependent galaxy evolution (e.g., Cowie et al., 1996; Bundy et al., 2006; Muzzin et al., 2013), or since they are located in a dense proto-cluster, they may be experiencing some influences from the surrounding environment such as galaxy-galaxy interactions. We do not know, however, if this trend is seen only in high density regions or it is a common feature of less massive SFGs (traced by ) irrespective of environment.
The SED fitting described in §4 indicates that the youngest age of yr is preferred for galaxies with stellar mass less than M⊙, which is again consistent with the less massive HAEs having sSFR of yr-1. This also supports our interpretation that they are young, star-bursting galaxies during the vigorous formation/assembly epoch of a rich galaxy cluster.
Cooke et al. (2014) show the lack of galaxies with stellar mass less than M⊙ in a proto-cluster at , and argue that it is possibly due to either a large dust extinction of less massive galaxies or the earlier formation of massive galaxies. However, our results show that there are SFGs on the MS down to stellar mass of M⊙ and that even at lower mass bin there are SFGs with SFRs comparable to those of more massive galaxies with M⊙, which are not in agreement with the results by Cooke et al. (2014). Compared to the USS1558, the proto-cluster discussed in Cooke et al. (2014) is not very rich, although it shows some overdensity in contrast to the general fields. Therefore, the discrepant result between this Letter and Cooke et al. (2014) could be due to the intrinsic diversity of the properties of proto-clusters at . However, to address this issue, it is essential for us to investigate a much larger sample of proto-clusters.
The existence of the less massive HAEs with M⊙ up-scattered above the MS may imply that a scatter around the MS increases at lower stellar masses. Diversity of star-formation history in early phase of galaxy evolution and/or sensitivity to the fluctuation of starburst activity at short time scales in individual H II regions could cause the increased scatter. Another possible remaining issue is a metallicity dependence of the luminosity (e.g., Bicker & Fritze-v. Alvensleben, 2005; Dopita et al., 2006). A lower stellar metallicity would result in a higher stellar temperature, and thus the larger number of ionizing photons. Therefore, the SFRs for less massive galaxies can be overestimated due to the metallicity effect, if they follow the mass-metallicity relation (e.g., Shimakawa et al., 2015a). These are areas of research for future papers.
References
- Bicker & Fritze-v. Alvensleben (2005) Bicker, J., & Fritze-v. Alvensleben, U. 2005, A&A, 443, L19
- Bruzual & Charlot (2003) Bruzual, G., & Charlot, S. 2003, MNRAS, 344, 1000
- Bundy et al. (2006) Bundy, K., et al. 2006, ApJ, 651, 120
- Calzetti et al. (2000) Calzetti, D., Armus, L., Bohlin, R. C., Kinney, A. L., Koornneef, J., & Storchi-Bergmann, T. 2000, ApJ, 533, 682
- Chabrier (2003) Chabrier, G. 2003, PASP, 115, 763
- Cooke et al. (2014) Cooke, E. A., Hatch, N. A., Muldrew, S. I., Rigby, E. E., & Kurk, J. D. 2014, MNRAS, 440, 3262
- Cowie et al. (1996) Cowie, L. L., Songaila, A., Hu, E. M., & Cohen, J. G. 1996, AJ, 112, 839
- Daddi et al. (2007) Daddi, E., et al. 2007, ApJ, 670, 156
- Dopita et al. (2006) Dopita, M. A., et al. 2006, ApJ, 647, 244
- Dunne et al. (2009) Dunne, L., et al. 2009, MNRAS, 394, 3
- Elbaz et al. (2007) Elbaz, D., et al. 2007, A&A, 468, 33
- Garn & Best (2010) Garn, T., & Best, P. N. 2010, MNRAS, 409, 421
- Hayashi et al. (2012) Hayashi, M., Kodama, T., Tadaki, K.-I., Koyama, Y., & Tanaka, I. 2012, ApJ, 757, 15
- Ichikawa et al. (2006) Ichikawa, T., et al. 2006, in Society of Photo-Optical Instrumentation Engineers (SPIE) Conference Series, Vol. 6269, Society of Photo-Optical Instrumentation Engineers (SPIE) Conference Series
- Karim et al. (2011) Karim, A., et al. 2011, ApJ, 730, 61
- Kennicutt (1998) Kennicutt, Jr., R. C. 1998, ARA&A, 36, 189
- Kodama et al. (1998) Kodama, T., Arimoto, N., Barger, A. J., & Arag’on-Salamanca, A. 1998, A&A, 334, 99
- Kodama et al. (2013) Kodama, T., Hayashi, M., Koyama, Y., Tadaki, K.-I., Tanaka, I., & Shimakawa, R. 2013, in IAU Symposium, Vol. 295, IAU Symposium, ed. D. Thomas, A. Pasquali, & I. Ferreras, 74–77
- Koekemoer et al. (2011) Koekemoer, A. M., et al. 2011, ApJS, 197, 36
- Kovač et al. (2014) Kovač, K., et al. 2014, MNRAS, 438, 717
- Koyama et al. (2013) Koyama, Y., et al. 2013, MNRAS, 434, 423
- Koyama et al. (2015) —. 2015, MNRAS, 453, 879
- Madau (1995) Madau, P. 1995, ApJ, 441, 18
- Muzzin et al. (2013) Muzzin, A., et al. 2013, ApJ, 777, 18
- Noeske et al. (2007) Noeske, K. G., et al. 2007, ApJ, 660, L43
- Oke & Gunn (1983) Oke, J. B., & Gunn, J. E. 1983, ApJ, 266, 713
- Peng et al. (2012) Peng, Y.-j., Lilly, S. J., Renzini, A., & Carollo, M. 2012, ApJ, 757, 4
- Reddy et al. (2012) Reddy, N. A., Pettini, M., Steidel, C. C., Shapley, A. E., Erb, D. K., & Law, D. R. 2012, ApJ, 754, 25
- Rodighiero et al. (2011) Rodighiero, G., et al. 2011, ApJ, 739, L40
- Shimakawa et al. (2015a) Shimakawa, R., Kodama, T., Tadaki, K.-i., Hayashi, M., Koyama, Y., & Tanaka, I. 2015a, MNRAS, 448, 666
- Shimakawa et al. (2014) Shimakawa, R., Kodama, T., Tadaki, K.-i., Tanaka, I., Hayashi, M., & Koyama, Y. 2014, MNRAS, 441, L1
- Shimakawa et al. (2015b) Shimakawa, R., et al. 2015b, MNRAS, 451, 1284
- Shivaei et al. (2015) Shivaei, I., et al. 2015, ApJ, 815, 98
- Sobral et al. (2013) Sobral, D., Smail, I., Best, P. N., Geach, J. E., Matsuda, Y., Stott, J. P., Cirasuolo, M., & Kurk, J. 2013, MNRAS, 428, 1128
- Speagle et al. (2014) Speagle, J. S., Steinhardt, C. L., Capak, P. L., & Silverman, J. D. 2014, ApJS, 214, 15
- Suzuki et al. (2008) Suzuki, R., et al. 2008, PASJ, 60, 1347
- Whitaker et al. (2014) Whitaker, K. E., et al. 2014, ApJ, 795, 104