Spin dynamics of diamond nitrogen-vacancy centres at the ground state level anti-crossing and all-optical low frequency magnetic field sensing
Abstract
We investigate the photo-induced spin dynamics of single nitrogen-vacancy (NV) centres in diamond near the electronic ground state level anti-crossing (GSLAC), which occurs at an axial magnetic field around 1024 G. Using optically detected magnetic resonance spectroscopy, we first find that the electron spin transition frequency can be tuned down to 100 kHz for the 14NV centre, while for the 15NV centre the transition strength vanishes for frequencies below about 2 MHz owing to the GSLAC level structure. Using optical pulses to prepare and readout the spin state, we observe coherent spin oscillations at 1024 G for the 14NV, which originate from spin mixing induced by residual transverse magnetic fields. This effect is responsible for limiting the smallest observable transition frequency, which can span two orders of magnitude from 100 kHz to tens of MHz depending on the local magnetic noise. A similar feature is observed for the 15NV centre at 1024 G. As an application of these findings, we demonstrate all-optical detection and spectroscopy of externally-generated fluctuating magnetic fields at frequencies from 8 MHz down to 500 kHz, using a 14NV centre. Since the Larmor frequency of most nuclear spin species lies within this frequency range near the GSLAC, these results pave the way towards all-optical, nanoscale nuclear magnetic resonance spectroscopy, using longitudinal spin cross-relaxation.
I Introduction
Detection and identification of spin species using established techniques such as magnetic resonance spectroscopy proves to have a host of applications in materials science, chemistry and biology. However, these techniques are limited in sensitivity, and thus require macroscopic ensembles of spins in order to produce a measurable signal Blank et al. (2003). A variety of techniques have been developed over the last decade to extend magnetic resonance spectroscopy to the nanometre scale Poggio and Degen (2010); Artzi et al. (2015); Bienfait et al. (2015); Rondin et al. (2014); Schirhagl et al. (2014). Notably, methods based on the nitrogen-vacancy (NV) centre in diamond Doherty et al. (2013) have attracted enormous interest owing to their ability to operate under conditions compatible with biological samples Schirhagl et al. (2014); McGuinness et al. (2011). While significant progress has been made with NV-based sensing in the last few years Rondin et al. (2014), spectroscopy at the single nuclear spin level remains a major challenge.
The detection of external spins with the NV centre is generally achieved through measuring the longitudinal spin relaxation rate ( processes) Steinert et al. (2013); Tetienne et al. (2013); Kaufmann et al. (2013); Ermakova et al. (2013); Sushkov et al. (2014) or transverse spin relaxation rate (dephasing, or processes) Ermakova et al. (2013); Maze et al. (2008); De Lange et al. (2011); McGuinness et al. (2013) of the NV’s electron spin, as they are sensitive to the magnetic field fluctuations produced by the target spins Cole and Hollenberg (2009); Hall et al. (2009); Laraoui et al. (2010). To obtain spectral information on the target spins, most studies so far have focussed on using -based techniques, which have been applied to the spectroscopy of small ensembles of either electronic Grotz et al. (2011); Laraoui et al. (2012); Mamin et al. (2012); Knowles et al. (2013) or nuclear spins Mamin et al. (2013); Staudacher et al. (2013); Loretz et al. (2014); Müller et al. (2014); DeVience et al. (2015). However, spectroscopy can also be achieved by relying on processes, via cross-relaxation between a probe spin (the NV centre’s electron spin) and the target spins Jarmola et al. (2012); Wang et al. (2014); van der Sar et al. (2015); Hall et al. (2016); Wood et al. (2016). The -based approach to spectroscopy introduced in Ref. Hall et al. (2016) allows for nanoscale, all-optical, wide-band magnetic resonance spectroscopy Wood et al. (2016). As such, it represents a promising alternative to -based approaches, as the latter require radiofrequency (RF) driving of the probe and/or the target, which poses various technical challenges in addition to limiting the accessible frequency range.
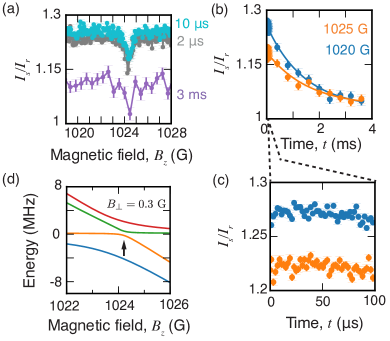
In cross-relaxation spectroscopy, the of the NV spin is monitored while varying the strength of an applied axial magnetic field, (Fig. 1a). When the transitional energy between two of the NV eigenstates (generally and , where the number refers to the electron spin projection ) is equal to that of a target spin, cross-relaxation occurs, which results in an increase in the relaxation rate, , of the NV Hall et al. (2016); Wood et al. (2016). This increase can be measured by purely optical means, even for a single NV centre Tetienne et al. (2013); Kaufmann et al. (2013); Ermakova et al. (2013); Sushkov et al. (2014). By scanning across a range of magnetic field strengths, a resonance spectrum of the target spins can be obtained, which can be deconvolved to produce the target spin spectrum Hall et al. (2016). This technique has been recently used to measure electronic spin resonance (ESR) spectra of P1 centres within the diamond at magnetic fields of 460-560 G, corresponding to transition frequencies of 1300-1600 MHz Hall et al. (2016); Wood et al. (2016). In order to detect nuclear magnetic resonances (NMR), the NV transition frequency must be matched to the Larmor frequency of the target nuclear spins, which is generally of order a few MHz. This occurs when the states and approach degeneracy, at a magnetic field G (Fig. 1b). However, in this region the NV experiences a complex Ground State Level Anti-Crossing (GSLAC, Figs. 1c,d) He et al. (1993) due to hyperfine interaction of the NV electron spin with its own nuclear spin (14N or 15N), which also has a coupling strength of several MHz. The hyperfine interaction causes spin mixing, which may prevent the NV electron spin from being initialised and read out Epstein et al. (2005). Therefore, a detailed understanding of the spin dynamics at the GSLAC is required in order to assess the potential for performing -based spectroscopy of nuclear spins as initially explored in Ref. Wood et al. (2016). While the GSLAC of the NV centre has been previously studied and exploited in several works He et al. (1993); Wei and Manson (1999); Wilson et al. (2003); Epstein et al. (2005); Fuchs et al. (2011); Wang et al. (2013, 2015); Wickenbrock et al. (2016), there is little knowledge about how varies and how the spin dynamics (including optical initialization) behaves at transition frequencies relevant to NMR, close to the GSLAC.
In this paper, we investigate the spin dynamics at the GSLAC for both 14NV and 15NV spin systems in various diamond samples. We begin by looking at the computed energy spectra of both spin systems and compare them to optically detected magnetic resonance (ODMR) measurements at their respective GSLACs. The short time spin dynamics of the 14NV spin at the GSLAC are probed using optical pulses, revealing a feature at G which manifests itself in either coherent spin oscillations, or in a simple polarisation drop depending on the sample. This feature is explained by spin mixing induced by residual transverse magnetic fields. The 15NV centre shows a similar feature at G. In addition to these narrow features, we find that the spin polarisation and time remains constant across the GSLAC, implying that the NV centre can be used to detect magnetic signals at low frequencies via measurements. Finally, we demonstrate one such application by performing all-optical spectroscopy of fluctuating magnetic fields generated at known frequencies, mimicking those of nuclear spins. This suggests that it is possible to perform NMR spectroscopy via longitudinal cross-relaxation near the GSLAC.
II Energy levels of the NV centre at the GSLAC
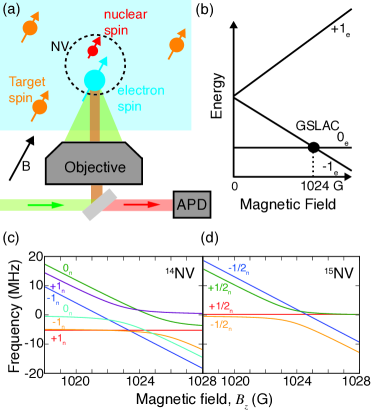
The NV spin system consists of a nitrogen atom adjacent to a vacancy in the carbon lattice of diamond. It comprises a pair of electrons (forming a spin-1) and a nuclear spin, which is a spin-1 for 14NV and spin-1/2 for 15NV (Fig. 1a). Due to spin-spin interaction, the electronic spin states are split from by GHz. The degeneracy of the can be lifted by the application of an external magnetic field along the NV centre’s symmetry axis, defined as the axis, as shown in Fig. 1b. The and states cross at a field around G (where is the electron gyromagnetic ratio), shown as a black dot in Fig. 1b. However, hyperfine interaction with the nitrogen nuclear spin causes an avoided crossing, the GSLAC, which is the main focus of this paper.
The energy spectrum of the NV electronic ground state near the GSLAC can be found by solving for the eigenvalues of the spin Hamiltonian. The relevant Hamiltonians for the 14NV and 15NV cases, expressed in units of angular frequencies, are
| (1) | ||||
| (2) | ||||
where is the electron spin operator, I is the nuclear spin operator, and is the nuclear gyromagnetic ratio. The magnetic field is aligned along the NV axis, with strength . The primed symbols refer to the 15NV case. The longitudinal and transverse hyperfine parameters are denoted as and , whose values are MHz and MHz for 14NV, MHz and MHz for 15NV Felton et al. (2009). In addition, the 14NV has a quadrupole coupling with strength MHz Felton et al. (2009).
The energy spectrum is obtained by evaluating the eigenvalues of the Hamiltonian at different axial field strengths and is shown in Fig. 1c for 14NV and Fig. 1d for 15NV. The manifold associated with the spin projection is not shown as it lies about 6 GHz above the manifold spanned by and and does not contribute to the effects discussed in this paper. We thus consider only the 6 lower-energy states for 14NV, and the 4 lower states for 15NV. Away from the GSLAC, the eigenstates have well-defined spin projections along the axis. In the electron-nuclear spin space, we denote states as where () is the electronic (nuclear) spin projection along the axis. The hyperfine coupling between the NV nuclear and electron spins results in a splitting of the nuclear spin states for each electronic spin state, due to the longitudinal component . Near the GSLAC, the perpendicular component of the hyperfine () induces a mixing of some of the -basis states. This effect is noticeable when the quantization energy between said states becomes of order . In the case of the 14NV, the states and do not mix as they have no hyperfine coupling to any other state, and as such, they remain eigenstates. The rest of the NV states are mixed, that is, the eigenstates are superpositions of -basis states, creating an avoided crossing. The 15NV spin also exhibits mixing at the GSLAC. In particular the and states become mixed while the and states remain eigenstates.
III Optically detected magnetic resonance at the GSLAC
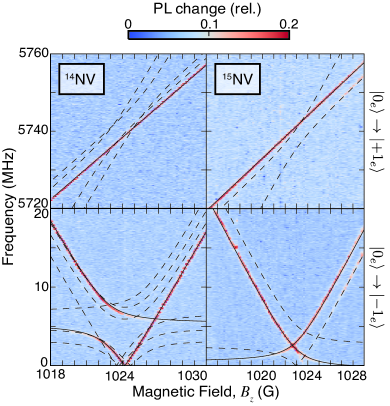
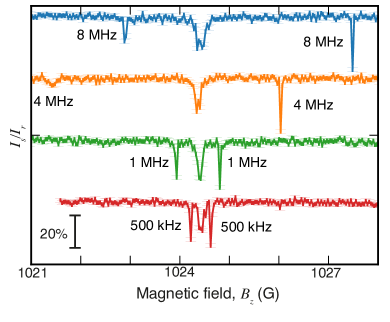
Experimentally, one can probe the NV energy spectrum using optically detected magnetic resonance (ODMR) spectroscopy Gruber et al. (1997). This is achieved by measuring the photoluminescence (PL) intensity of the NV centre while varying the frequency of an applied RF field, using a purpose-built confocal microscope with green laser excitation (Fig. 1a). The laser serves both to initialize the NV in the electronic spin state , and read out the spin state following an RF pulse, exploiting the fact that emit less PL on average than Manson et al. (2006). Thus, ODMR allows us to probe the electron spin transitions . We recorded ODMR spectra for magnetic fields varied from 1018 G to 1032 G, for single 14NV and 15NV centres in a high-purity diamond grown by chemical vapour deposition (CVD). The results are shown in Fig. 2, where the top (bottom) panels show the ( ) transitions. The left (right) panels correspond to a 14NV (15NV) centre. Comparing with the theoretical expectations for the allowed transitions (shown as black lines), it can be seen that only a limited number of expected transitions are observed experimentally. This is because the nuclear spin is efficiently polarised under optical pumping near the GSLAC, owing to hyperfine-induced spin mixing. This effect has been well documented at the excited state level anti-crossing (ESLAC, Jacques et al. (2009); Ivády et al. (2015)), but has not been previously quantified experimentally across the GSLAC Fuchs et al. (2011). Using the relative strengths of the transitions (top panels in Fig. 2), we find that the nuclear spin is polarised to into for 14NV across the whole range of fields scanned here. For the 15NV investigated in Fig. 2, the nuclear spin is polarised to in up to G, but becomes completely unpolarised above G.
We now discuss the ODMR spectrum of the transition (bottom panels in Fig. 2). For 14NV, the NV is efficiently polarised in the state , which remains an eigenstate at all fields. Away from the GSLAC, the only transition allowed is to the state with the same nuclear spin projection, . However, near the GSLAC the state becomes mixed with , which creates two eigenstates of the form . This results in an avoided crossing feature centred at G, around the transition frequency MHz which corresponds to the quadrupole coupling . This leads to little mixing at the allowed crossing at G, which means the dominant transition here is . We observed clear ODMR signatures with resonance frequencies down to 100 kHz in this sample. This implies that the NV spin could be resonantly coupled to most nuclear spin species, which have Larmor frequencies ranging typically from 500 kHz to 5 MHz at this magnetic field. However, the minimum observable transition frequency was found to be highly sample dependent, as will be discussed in section IV.
On the other hand, the 15NV exhibits a very different spectrum near the GSLAC (Fig. 2, right-hand panels). Under optical pumping, it is efficiently polarised in the state , which remains an eigenstate at all fields. The states it can transit to under RF driving are superpositions , where the avoided crossing is centred approximately around the initial state (see Fig. 1d). As a result, the ODMR plot shows two transitions that bend upon approaching vanishing frequencies. They cross at a field G and a transition frequency MHz given by
| (3) |
Incidentally, this allows the perpendicular component of the hyperfine interaction () to be measured directly on a single 15NV centre, which gives here MHz, in excellent agreement with the ensemble-averaged value of 3.65(3) MHz reported in Ref. Felton et al. (2009). The peculiar GSLAC structure of the 15NV centre has important consequences for sensing. In particular, the contrast of the transitions decreases rapidly for frequencies below as they become forbidden. As a result, the 15NV is unsuited to detecting resonances below about 2 MHz under typical conditions. Most nuclear spin species have transitions within this range, with an exception being hydrogen (1H), which has a Larmor frequency of about 4.4 MHz at this field and could be in principle detected via cross-relaxation with an 15NV.
IV Photo-induced spin dynamics at the GSLAC
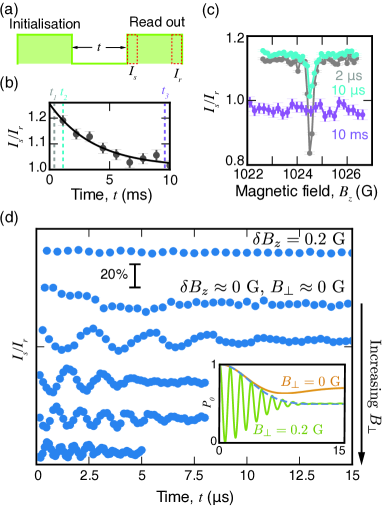
We now investigate the spin population dynamics near the GSLAC. Our aim is to assess the possibility of measuring the longitudinal spin relaxation time (), as required in order to perform cross-relaxation spectroscopy and detect nearby nuclear spins Wood et al. (2016). The time is typically measured by using laser pulses to initialise the NV into , and read out the remaining population of after a variable delay (Fig. 3a). In practice, the PL signal is integrated at the start of the readout pulse () and normalised by the PL from the back of the pulse (). The normalised signal can be expressed as Manson et al. (2006)
| (4) |
where is the population in of the current spin state , and and are constants. The resulting time trace therefore allows us to estimate the initial population , which approaches unity under normal conditions Manson et al. (2006), as well as the evolution of the spin state in the dark. In general (away from the GSLAC or ESLAC), the spin population exhibits a simple exponential decay towards a thermal mixture, i.e. assuming perfect initialisation (see an example in Fig. 3b). In the following, we measure for different wait times , as a function of the axial magnetic field .
IV.1 14NV centres
We first performed measurements of 14NV centres in a ultra-high purity CVD-grown diamond with isotopically purified carbon content ([12C]). In this sample, the main source of magnetic noise comes from the bath of remaining 13C impurities Balasubramanian et al. (2009). A scan across the GSLAC for a representative 14NV centre is shown in Fig. 3c, where we probed three time points s, 10 s, and 10 ms. When the NV is far from the GSLAC crossing, an exponential decay is observed as shown in the full time trace in Fig. 3b. This decay corresponds to phonon-induced relaxation, with a characteristic time ms Jarmola et al. (2012). At the crossing at G, however, a sharp variation in signal is observed (Fig. 3c). Here, the NV spin undergoes population oscillations, as indicated by the 2 s time point dropping below the 10 ms point.
To understand this oscillation, we look at the reduced Hamiltonian, , in the basis that contains the states that cross, . In a magnetic field , this Hamiltonian is given by
| (5) |
where we introduced the longitudinal detuning from the crossing, , the transverse magnetic field, , and the angle defined by . The transverse field causes a mixing between and and opens an energy gap associated with a level avoided crossing. Assuming that optical pumping always initialises the NV in the state, and reads out the population in that same state, we then expect oscillations between and that are mirrored in the PL when in the presence of a transverse magnetic field. Under these conditions, the probability of occupying the state after a wait time following initialisation is given by
| (6) |
The amplitude of the oscillation vanishes when the detuning is much larger than the transverse field (), far from the avoided crossing region. This is illustrated in Fig. 3d (top curve), which was recorded with a detuning G . On the other hand, near the avoided crossing where the amplitude is maximal, the frequency of the oscillation is expected to increase as is increased. This effect was tested through a series of measurements with varying transverse fields. Experimentally this involved using a permanent magnet to align the field at the 1024 G crossing so that no oscillations are detected. The permanent magnet is then moved in the transverse direction ( or ) to add a transverse field. The results are shown in Fig. 3d where is increased from top down, resulting in faster oscillations.
Damping of the oscillations is attributed to noise in the local magnetic field. In this sample, the noise comes predominantly from the bath of 13C impurities. Examination of this interaction via the rotating wave approximation shows that only the -, - and - components of the dipole-dipole coupling to the NV spin need be considered Hall et al. (2014). As such, the effective magnetic noise from the environment may be regarded as static over the short wait times, , considered here. We assume that the field components and are normally distributed with means and and variances and , respectively. Averaging Eq. (6) over these distributions, we find numerically that the decay envelope of is well approximated by a gaussian function , where the characteristic time is given by , regardless of the means and (see inset in Fig. 3d). In other words, the damping of the 1024 G oscillations is mainly caused by the fluctuations in the transverse magnetic field. It is interesting to link this damping time to the dephasing time measured in a free induction decay (FID) experiment Hall et al. (2014); Maze et al. (2012). Under the same assumptions, the FID envelope takes the form where . Moreover, a bath of randomly placed spins around the NV centre leads to on average Hall et al. (2014), which gives the relation
| (7) |
For the NV centre studied in Fig. 3, the damping time of the 1024 G oscillations is s, estimated from the curves shown in Fig. 3d, hence s. This is significantly shorter than the dephasing time s. We attribute the discrepancy mainly to drifts in the magnetic field applied during the measurements, which leads to overestimating the damping rate .
We now consider the case where the magnetic field is aligned along the NV axis, i.e. . At the crossing when , the averaged population does not oscillate but still decays with a characteristic time (see inset in Fig. 3d). However, the amplitude of the decay decreases as is increased. We define the width of the 1024 G feature, denoted , as twice the detuning to apply to obtain a maximum population drop of 20%. We find numerically that , which can also be expressed as a function of according to
| (8) |
For the NV studied here, we predict a width T for a perfectly aligned background field. We note however that in the measurements of Fig. 3c, the width is instead given by the residual transverse field ( G in Fig. 3c), which could not be maintained to significantly smaller values for extended periods of time due to drifts in the applied magnetic field.
The observation of coherent oscillations at the GSLAC suggests a direct application to DC magnetometry. Indeed, the frequency of the oscillation is directly proportional to the strength of the transverse field according to Eq. (6), assuming . For photon shot noise limited measurements, the magnetic sensitivity is similar to that obtained by FID measurements Balasubramanian et al. (2009), with the advantage of being an all-optical technique (no microwave or RF field is required).
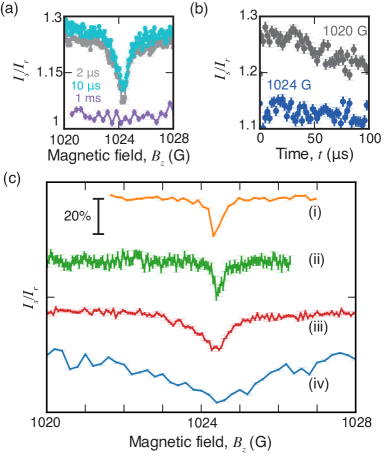
We now compare the spin dynamics of 14NV centres at the GSLAC in different diamond samples. Of particular relevance to sensing applications are NV centres implanted close to the diamond surface. We performed measurements of shallow NV centres in a CVD-grown diamond with natural isotopic concentration ([13C]). The NV centres were created by implantation of N+ ions with an energy of 3.5 keV followed by annealing, resulting in NV centres at a mean depth of 10 nm Lehtinen et al. (2016). Fig. 4a shows a scan across the GSLAC for a particular 14NV centre. A reduction in the PL is observed at a field G, corresponding to the crossing discussed before. However, full time traces (shown in Fig. 4b) now reveal a simple offset of the PL at the crossing, with no obvious oscillatory behaviour. This can be understood by the large magnetic noise originating from the surface, which results in a decay time shorter than the minimum probe time of s (limited by the lifetime of the singlet state Manson et al. (2006)). The width of the feature in Fig. 4a is G (or MHz). By measuring various shallow NV centres in the same sample, we found a range of widths of the 1024 G feature from 1 to 3 G (or 3 to 9 MHz). This variability is attributed to different local environments, especially because each NV centre sits at a different distance from the surface. For applications to -based NMR spectroscopy as proposed in Ref. Wood et al. (2016), this implies that nuclear spin species with large gyromagnetic ratios such as 1H (Larmor frequency MHz at 1024 G) can be resonantly coupled to a shallow 14NV such as that measured in Fig. 4a. However, species with smaller gyromagnetic ratios such as 13C (Larmor frequency MHz) are generally within the width of the crossing feature in the present sample, and could therefore hardly be detected via cross-relaxation. This motivates further progress in optimising the coherence properties of shallow NV spins, or devising ways to mitigate the effect of dephasing in measurements.
Finally, we measured the properties of 14NV centres at the GSLAC in two other settings: (1) deep 14NV centres in a CVD diamond with [13C], where decoherence is dominated by the 13C bath rather than surface effects; (ii) deep 14NV centres in type-Ib diamond grown by the high-pressure high-temperature method, where the main source of decoherence is the bath of electronic spins associated with nitrogen impurities Hanson et al. (2008). Example scans across the GSLAC are shown in Fig. 4c. Deep NVs in CVD diamond showed line widths of the 1024 G feature smaller than G for most NVs ( MHz). By contrast, line widths in the type-Ib diamond are of the order of 10-20 MHz, which makes such diamonds unsuited to -based NMR spectroscopy.
IV.2 15NV centres
As previously discussed, the energy structure of the 15NV centre at the GSLAC precludes it from accessing transition frequencies below about 2 MHz. Although this limits the range of nuclear spin species that could be resonantly coupled to the 15NV, the highly relevant 1H remains accessible. It is therefore important to test the ability to measure the of 15NV centres near the GSLAC.
As in the 14NV case, we recorded PL scans across the GSLAC with different wait times, . For this study the measurements were performed on shallow 15NV centres in a CVD diamond only, as this is the most relevant sample for sensing applications. The implantation energy was 3.5 keV and the concentration of 13C is 1.1%, similar to the diamond used in Fig. 4a. Fig. 5a shows a scan obtained for a particular 15NV centre. The spin population remains essentially constant across the GSLAC, except at a magnetic field G where a sharp change is observed. Time traces at and away from the feature are shown in Figs. 5b and 5c. While the long time scale reveals an exponential decay with a characteristic time ms independent from the magnetic field (Fig. 5b), the contrast of the decay is significantly smaller at G. This is due to the initial population being lower, as can be seen from the drop of signal at short time scales (Fig. 5c). This 1024 G feature was consistently seen in most NVs investigated, exhibiting a variety of amplitudes and widths. At this field, the dominant NV transition has a frequency of MHz. This is 1 G beyond the 1023 G crossing observed in the ODMR (see Fig. 2), when the NV transition frequency is MHz.
To understand this 1024 G feature, we consider the energy level structure shown in Fig. 1d. As mentioned before, under optical pumping near the GSLAC the 15NV centre is efficiently polarised in the state . This state crosses the state precisely at 1024 G. These two states cannot be coupled directly by a transverse magnetic field because they have distinct nuclear spin projections. However, they are indirectly coupled to each other via transverse-field-enabled coupling to the other two hyperfine-mixed states, which are superpositions of and . This is illustrated in Fig. 5d, which shows the computed energy levels as a function of in the presence of a finite transverse field, here G. The transverse field opens a gap between and at 1024 G. As a consequence, they become mixed states which can give rise to coherent spin oscillations since optical pumping initialises the NV in the state. This situation is reminiscent of the 14NV case, where the 1024 G feature was due to an avoided crossing between two states coupled via a transverse magnetic field. The main difference here is that the coupling is indirect, mediated by two intermediate states. In the presence of magnetic noise, the coherent oscillations between the two coupled states are expected to be averaged out and appear as a decrease of the initial spin population, as we observed experimentally in this sample (Fig. 5c). We note that a transverse-field-induced coupling also occurs at G, between and (see Fig. 1d). This coupling explains why the dynamic nuclear spin polarisation becomes ineffective around this field, as discussed in section III (see Fig. 2).
An unfortunate consequence of the 1024 G feature of the 15NV centre is that resonant coupling with a 1H spin would normally occur very close to 1024 G, since the Larmor frequency of 1H is MHz at this field. Therefore, any signature of 15NV-1H coupling would be overwhelmed by this strong intrinsic feature. It should be noted however that cross-relaxation resonances with nuclear spins should occur on both sides of the GSLAC Wood et al. (2016), so that 1H can still be detected before the GSLAC, at a magnetic field G. Moreover, improving the coherence properties (i.e., reducing the noise) of shallow NV centres should significantly reduce the width and amplitude of the 1024 G feature.
V All-optical magnetic noise spectroscopy
By scanning the magnetic field across the GSLAC, we have shown that the transition frequency of the 14N centre can be tuned down to frequencies as low as 100 kHz in diamond samples with low intrinsic magnetic noise. This is approximately an order of magnitude below the transition frequencies exhibited by nuclear species (e.g., 13C) at 1024 G, thus opening the possibility to perform all-optical NMR spectroscopy by detecting cross-relaxation events between a probe NV spin and target nuclear spins Wood et al. (2016). When the NV transition frequency is matched to the nuclear Larmor frequency, the fluctuating nuclear field would cause the NV spin to relax faster, translating into a decreased longitudinal relaxation time, .
In order to test the possibility of detecting fluctuating magnetic fields near the GSLAC, we generated a local magnetic field by running an oscillating current through a wire placed in proximity to the diamond. To mimic nuclear spin detection, we applied signals at various frequencies: 8 MHz, 4 MHz ( 1H or 19F), 1 MHz ( 13C), and 500 kHz ( 2H or 17O). The alternating current was modulated in amplitude and phase to ensure that the NV is not coherently driven but experiences noise from a randomly fluctuating current around a given frequency, similar to the signal from a possible target nuclear spin. The amplitude of the current was adjusted to obtain a root-mean-square field strength of 1 T, which corresponds approximately to the field generated by a dense organic sample of nuclear spins located at a 5 nm stand-off distance Staudacher et al. (2013). The probe time was set to s to maximise the PL contrast. The resulting spectra (PL as a function of ), measured on a deep 14N centre in an isotopically-purified CVD diamond, are shown in Fig. 6b. While the 8 MHz, 1 MHz and 500 kHz detections are clear on both sides of the 1024 G crossing, the 4 MHz detection is weaker before the GSLAC. This is due to the NV transition being very weak in this region because of spin mixing (associated with an avoided crossing), as discussed previously (see Fig. 2). Past the GSLAC, however, there is no issue measuring any of the signals and thus, NMR spectroscopy would be possible in this region for most commonly found nuclear spin species. We note that the width of the resonances is governed here by the amplitude of the applied field (1 T) through power broadening. Weaker signals will produce narrower lines, down to the limit of spectral resolution imposed by spin dephasing, characterised by Hall et al. (2016). Reaching this limit was not possible in our experiment due to limited precision and stability of the applied magnetic field. This could be improved by using, e.g., an electromagnet Wickenbrock et al. (2016).
VI Conclusions
In this work we have investigated the photo-induced spin dynamics of NV centres near the GSLAC. For the 14NV centre, the spin transition frequency can be tuned down to values as low as 100 kHz in high purity diamond. At the crossing (1024 G), we observe coherent spin oscillations caused by spin mixing induced by residual transverse magnetic fields. This, in turn, limits the minimum accessible transition frequency exhibited by the environment. Measurements with shallow 14NV centres showed that frequencies compatible with nuclear spin signals (1-5 MHz) are within reach. For the 15NV centre, the minimum transition frequency practically accessible is of order 2 MHz, governed by the avoided crossing intrinsic to the 15NV hyperfine structure. The 15NV also exhibits a crossing feature at 1024 G, which is induced by transverse magnetic fields via an indirect hyperfine-mediated process. With this detailed understanding of the low frequency spin dynamics around the GSLAC, we have demonstrated all-optical spectroscopy of externally-generated magnetic noise with frequencies ranging from 8 MHz down to 500 kHz, mimicking signals produced by precessing nuclear spins. This work thus paves the way towards all-optical, nanoscale NMR spectroscopy via cross-relaxation.
Acknowledgements
We thank L. McGuinness for experimental assistance with the diamond samples. This work was supported in part by the Australian Research Council (ARC) under the Centre of Excellence scheme (project No. CE110001027). L.C.L.H. acknowledges the support of an ARC Laureate Fellowship (project No. FL130100119).
References
- Blank et al. (2003) A. Blank, C. R. Dunnam, P. P. Borbat, and J. H. Freed, J. Magn. Reson. 165, 116 (2003).
- Poggio and Degen (2010) M. Poggio and C. L. Degen, Nanotechnology 21, 342001 (2010).
- Artzi et al. (2015) Y. Artzi, Y. Twig, and A. Blank, Appl. Phys. Lett. 106, 084104 (2015).
- Bienfait et al. (2015) A. Bienfait, J. J. Pla, Y. Kubo, M. Stern, X. Zhou, C. C. Lo, C. D. Weis, T. Schenkel, M. L. W. Thewalt, D. Vion, D. Esteve, B. Julsgaard, K. Mølmer, J. J. L. Morton, and P. Bertet, Nature Nanotechnology 11, 253 (2015).
- Rondin et al. (2014) L. Rondin, J.-P. Tetienne, T. Hingant, J.-F. Roch, P. Maletinsky, and V. Jacques, Reports on Progress in Physics 77, 056503 (2014).
- Schirhagl et al. (2014) R. Schirhagl, K. Chang, M. Loretz, and C. L. Degen, Annual Review of Physical Chemistry 65, 83 (2014).
- Doherty et al. (2013) M. W. Doherty, N. B. Manson, P. Delaney, F. Jelezko, J. Wrachtrup, and L. C. L. Hollenberg, Physics Reports 528, 1 (2013).
- McGuinness et al. (2011) L. P. McGuinness, Y. Yan, A. Stacey, D. A. Simpson, L. T. Hall, D. Maclaurin, S. Prawer, P. Mulvaney, J. Wrachtrup, F. Caruso, R. E. Scholten, and L. C. L. Hollenberg, Nature Nanotechnology 6, 358 (2011).
- Steinert et al. (2013) S. Steinert, F. Ziem, L. T. Hall, A. Zappe, M. Schweikert, N. Götz, A. Aird, G. Balasubramanian, L. Hollenberg, and J. Wrachtrup, Nature Communications 4, 1607 (2013).
- Tetienne et al. (2013) J.-P. Tetienne, T. Hingant, L. Rondin, A. Cavaillès, L. Mayer, G. Dantelle, T. Gacoin, J. Wrachtrup, J.-F. Roch, and V. Jacques, Physical Review B 87, 235436 (2013).
- Kaufmann et al. (2013) S. Kaufmann, D. A. Simpson, L. T. Hall, V. Perunicic, P. Senn, S. Steinert, L. P. McGuinness, B. C. Johnson, T. Ohshima, F. Caruso, J. Wrachtrup, R. E. Scholten, P. Mulvaney, and L. Hollenberg, Proceedings of the National Academy of Sciences 110, 10894 (2013).
- Ermakova et al. (2013) A. Ermakova, G. Pramanik, J.-M. Cai, G. Algara-Siller, U. Kaiser, T. Weil, Y.-K. Tzeng, H. C. Chang, L. P. McGuinness, M. B. Plenio, B. Naydenov, and F. Jelezko, Nano Letters 13, 3305 (2013).
- Sushkov et al. (2014) A. O. Sushkov, N. Chisholm, I. Lovchinsky, M. Kubo, P. K. Lo, S. D. Bennett, D. Hunger, A. Akimov, R. L. Walsworth, H. Park, and M. D. Lukin, Nano Letters 14, 6443 (2014).
- Maze et al. (2008) J. R. Maze, P. L. Stanwix, J. S. Hodges, S. Hong, J. M. Taylor, P. Cappellaro, L. Jiang, M. V. G. Dutt, E. Togan, A. S. Zibrov, A. Yacoby, R. L. Walsworth, and M. D. Lukin, Nature 455, 644 (2008).
- De Lange et al. (2011) G. De Lange, D. Ristè, V. V. Dobrovitski, and R. Hanson, Phys. Rev. Lett. 106, 1 (2011), 1008.4395 .
- McGuinness et al. (2013) L. P. McGuinness, L. T. Hall, a. Stacey, D. a. Simpson, C. D. Hill, J. H. Cole, K. Ganesan, B. C. Gibson, S. Prawer, P. Mulvaney, F. Jelezko, J. Wrachtrup, R. E. Scholten, and L. C. L. Hollenberg, New J. Phys. 15 (2013), 1211.5749 .
- Cole and Hollenberg (2009) J. H. Cole and L. C. L. Hollenberg, Nanotechnology 20, 495401 (2009).
- Hall et al. (2009) L. T. Hall, J. H. Cole, C. D. Hill, and L. C. L. Hollenberg, Physical Review Letters 103, 220802 (2009).
- Laraoui et al. (2010) A. Laraoui, J. S. Hodges, and C. a. Meriles, Appl. Phys. Lett. 97, 30 (2010), 1009.0316 .
- Grotz et al. (2011) B. Grotz, J. Beck, P. Neumann, B. Naydenov, R. Reuter, F. Reinhard, F. Jelezko, J. Wrachtrup, D. Schweinfurth, B. Sarkar, and P. Hemmer, New Journal of Physics 13, 055004 (2011).
- Laraoui et al. (2012) A. Laraoui, J. S. Hodges, and C. A. Meriles, Nano Letters 12, 3477 (2012).
- Mamin et al. (2012) H. J. Mamin, M. H. Sherwood, and D. Rugar, Physical Review B 86, 195422 (2012).
- Knowles et al. (2013) H. S. Knowles, D. M. Kara, and M. Atatüre, Nature Materials 13, 21 (2013).
- Mamin et al. (2013) H. J. Mamin, M. Kim, M. H. Sherwood, C. T. Rettner, K. Ohno, D. D. Awschalom, and D. Rugar, Science 339, 557 (2013).
- Staudacher et al. (2013) T. Staudacher, F. Shi, S. Pezzagna, J. Meijer, J. Du, C. a. Meriles, F. Reinhard, and J. Wrachtrup, Science (New York, N.Y.) 339, 561 (2013).
- Loretz et al. (2014) M. Loretz, S. Pezzagna, J. Meijer, and C. L. Degen, Applied Physics Letters 104, 033102 (2014).
- Müller et al. (2014) C. Müller, X. Kong, J.-M. Cai, K. Melentijević, A. Stacey, M. Markham, D. Twitchen, J. Isoya, S. Pezzagna, J. Meijer, J. F. Du, M. B. Plenio, B. Naydenov, L. P. McGuinness, and F. Jelezko, Nature communications 5, 4703 (2014).
- DeVience et al. (2015) S. J. DeVience, L. M. Pham, I. Lovchinsky, A. O. Sushkov, N. Bar-Gill, C. Belthangady, F. Casola, M. Corbett, H. Zhang, M. Lukin, H. Park, A. Yacoby, and R. L. Walsworth, Nature Nanotechnology 10, 129 (2015).
- Jarmola et al. (2012) A. Jarmola, V. M. Acosta, K. Jensen, S. Chemerisov, and D. Budker, Physical Review Letters 108, 197601 (2012).
- Wang et al. (2014) H.-J. Wang, C. S. Shin, S. J. Seltzer, C. E. Avalos, A. Pines, and V. S. Bajaj, Nat. Commun. 5, 4135 (2014), 1312.6313 .
- van der Sar et al. (2015) T. van der Sar, F. Casola, R. Walsworth, and A. Yacoby, Nature Communications 6, 7886 (2015).
- Hall et al. (2016) L. T. Hall, P. Kehayias, D. A. Simpson, A. Jarmola, A. Stacey, D. Budker, and L. C. L. Hollenberg, Nature Communications 7, 10211 (2016).
- Wood et al. (2016) J. D. A. Wood, D. A. Broadway, L. T. Hall, A. Stacey, D. A. Simpson, J.-P. Tetienne, and L. C. L. Hollenberg, (2016), arXiv:1604.00160 .
- He et al. (1993) X.-F. He, N. B. Manson, and P. T. H. Fisk, Phys. Rev. B 47, 8809 (1993).
- Epstein et al. (2005) R. J. Epstein, F. M. Mendoza, Y. K. Kato, and D. D. Awschalom, Nature Physics 1, 94 (2005).
- Wei and Manson (1999) C. Wei and N. B. Manson, Phys. Rev. A 60, 2540 (1999).
- Wilson et al. (2003) E. A. Wilson, N. B. Manson, and C. Wei, Phys. Rev. A 67, 023812 (2003).
- Fuchs et al. (2011) G. D. Fuchs, G. Burkard, P. V. Klimov, and D. D. Awschalom, Nature Physics 7, 789 (2011).
- Wang et al. (2013) H.-J. Wang, C. S. Shin, C. E. Avalos, S. J. Seltzer, D. Budker, A. Pines, and V. S. Bajaj, Nature Communications 4, 1940 (2013).
- Wang et al. (2015) P. Wang, B. Liu, and W. Yang, Scientific Reports 5, 15847 (2015).
- Wickenbrock et al. (2016) A. Wickenbrock, H. Zheng, L. Bougas, N. Leefer, S. Afach, A. Jarmola, V. M. Acosta, and D. Budker, (2016), arXiv:1606.03070 .
- Felton et al. (2009) S. Felton, A. M. Edmonds, M. E. Newton, P. M. Martineau, D. Fisher, D. J. Twitchen, and J. M. Baker, Physical Review B 79, 075203 (2009).
- Gruber et al. (1997) A. Gruber, A. Dräbenstedt, C. Tietz, L. Fleury, J. Wrachtrup, and C. von Borczyskowski, Science 276, 2012 (1997).
- Manson et al. (2006) N. B. Manson, J. P. Harrison, and M. J. Sellars, Physical Review B 74, 104303 (2006).
- Jacques et al. (2009) V. Jacques, P. Neumann, J. Beck, M. Markham, D. Twitchen, J. Meijer, F. Kaiser, G. Balasubramanian, F. Jelezko, and J. Wrachtrup, Physical Review Letters 102, 057403 (2009).
- Ivády et al. (2015) V. Ivády, K. Szász, A. L. Falk, P. V. Klimov, D. J. Christle, E. Janzén, I. A. Abrikosov, D. D. Awschalom, and A. Gali, Physical Review B 92, 115206 (2015).
- Balasubramanian et al. (2009) G. Balasubramanian, P. Neumann, D. Twitchen, M. Markham, R. Kolesov, N. Mizuochi, J. Isoya, J. Achard, J. Beck, J. Tissler, V. Jacques, P. R. Hemmer, F. Jelezko, and J. Wrachtrup, Nature Materials 8, 383 (2009).
- Hall et al. (2014) L. T. Hall, J. H. Cole, and L. C. L. Hollenberg, Physical Review B 90, 075201 (2014).
- Maze et al. (2012) J. R. Maze, A. Dréau, V. Waselowski, H. Duarte, J.-F. Roch, and V. Jacques, New Journal of Physics 14, 103041 (2012).
- Lehtinen et al. (2016) O. Lehtinen, B. Naydenov, P. Börner, K. Melentjevic, C. Müller, L. P. McGuinness, S. Pezzagna, J. Meijer, U. Kaiser, and F. Jelezko, Phys. Rev. B 93, 35202 (2016).
- Hanson et al. (2008) R. Hanson, V. V. Dobrovitski, a. E. Feiguin, O. Gywat, and D. D. Awschalom, Science 320, 352 (2008).