Thermo-optic and thermal expansion coefficients of RTP and KTP crystals over 300-350 K
Arlee V. Smith1,∗, Jesse J. Smith1, and Binh T. Do2
1AS-Photonics, 6916 Montgomery Blvd. NE, Ste. B8, Albuquerque, NM 87109, USA
2Ball Aerospace Technologies, 2201 Buena Vista Dr. SE, Ste. 100, Albuquerque, NM 87106, USA
∗arlee.smith@as-photonics.com
Abstract: We report new measurements of the thermal expansion and thermo-optic coefficients of RbTiOPO4 (RTP) and KTiOPO4 (KTP) crystals over the temperature range 300-350 K. For RTP/KTP our coefficients of linear thermal expansion at 305 K are: /K, /K, /K. Our normalized thermo-optic coefficients at 632.8 nm and 305 K are: /K, /K, /K.
OCIS codes: (190.4400) nonlinear optics, materials; Thermal effects; (160.2100) electro-optical materials; (160.4330) nonlinear optical materials; (120.6810) thermal effects
References and links
- [1] J.F. Nye, Physical properties of crystals (Oxford University Press, 1986).
- [2] A.V. Smith, Crystal nonlinear optics with SNLO examples (AS-Photonics, 2015).
- [3] H.B. Callen, Thermodynamics (Wiley, 1960).
- [4] N. Ter-Gabrielyan, V. Fromzel, and M. Dubinskii, “Linear thermal expansion and thermo-optic coefficients of YVO4 crystals the 80-320 K temperature range,” Opt. Mat. Exp. 2, 1624–1631 (2012).
- [5] P.E. Ciddor, “Refractive index of air: new equations for the visible and near infrared,” Appl. Opt. 35, 1566–1573 (1996).
- [6] J.A. Stone and J.H. Zimmerman, “Engineering Metrology Toolbox: Index of Refraction of Air,” http://emtoolbox.nist.gov/Wavelength/Documentation.asp
- [7] J. Mangin, G. Mennerat, and P. Villeval, “Thermal expansion, normalized thermo-optic coefficients, and condition for second harmonic generation of a Nd:YAG laser with wide temperature bandwidth in RbTiOPO4,” J. Opt. Soc. Am. B, 28, 873–881 (2011).
- [8] P. Delarue, C. Lecomte, M. Jannin, G. Marnier, and B. Menaert, “Evolution towards centrosymmetry of the nonlinear-optical material RbTiOPO4 in the temperature range 293-973 K: Alkaline displacements and titanyl deformations,” Phys. Rev. B 58, 5287–5295 (1998).
- [9] D.K.T. Chu, J.D. Bierlein, and R.G. Hunsperger, “Piezoelectric and Acoustic Properties of Potassium Titanyl Phosphate (KTP) and Its Isomorphs,” IEEE Trans. on Ultrasonic, Ferroelectrics, and Frequency Control 39, 683–687 (1992).
- [10] I. Yutsis, B. Kirshner, and A. Arie, “Temperature-dependent dispersion relations for RbTiOPO4 and RbTiOAsO4,” Appl. Phys. B 79, 77–81 (2004).
- [11] T. Mikami, T. Okamoto, and K. Kato, “Sellmeier and thermo-optic dispersion formulas for RbTiOPO4,” Opt. Mat. 31, 1628–1630 (2009).
- [12] J. Mangin, G. Gadret, and G. Mennerat, “Dispersion and temperature dependence of thermo-optic coefficients of optical materials over their whole transparency range: vectorial formalism and application to KTiOPO4,” SPIE 7102, 7102W1–7102W9 (2008).
- [13] Corrected expressions were supplied by G. Mennerat in a private communication.
- [14] K. Kato and E. Takaoka, “Sellmeier and thermo-optic dispersion formulas for KTP,” Appl. Opt. 41, 5040–5044 (2002).
- [15] J.D. Bierlein and H. Vanherzeele, “Potassium titanyl phosphate: properties and new applications,” J. Opt. Soc. Am. B 6, 622–633 (1989).
- [16] S. Emanueli and A. Arie, “Temperature-dependent dispersion equations for KTiOPO4 and KTiOAsO4,” Appl. Opt. 42, 6661–6665 (2003).
- [17] F. Pignatiello, M. De Rosa, P. Ferraro, S. Grilli, P. De Natale, A. Arie, and S. De Nicola, “Measurement of the thermal expansion coefficients of ferroelectric crystals by a moire interferometer”, Opt. Commun. 277, 14–18 (2007).
- [18] W. Wiechmann, S. Kubota, T. Fukui, and H. Masuda, “Refractive-index temperature derivatives of potassium titanyl phosphate,” Opt. Lett. 18, 1208–1212 (1993).
1 Introduction
Thermal effects often dictate the performance limits of lasers and nonlinear optical devices. Two effects are particularly important, the thermo-optic effect or change in refractive index with temperature, and thermal expansion. They both affect thermal lensing, the thermo-optic effect by forming a gradient index lens, and thermal expansion by creating bulges on the ends of the crystal and by strain-induced changes in the refractive index. The thermo-optic effect also determines the rate of temperature tuning for angle phase matched nonlinear crystals, while both the thermo-optic effect and thermal expansion determine the temperature tuning of quasi phase matched crystals. Accurate and precise values of both coefficients are necessary for general calculations of temperature tuning. Significant disagreement among previously reported values of the thermo-optic and thermal expansion coefficients of RTP (RbTiOPO4) and KTP (KTiOPO4) make such calculations uncertain. Here we report new measurements of the thermal expansion coefficient and the thermo-optic coefficient at 632.8 nm and over the temperature range . Our values at only one wavelength are insufficient for phase matching calculations, but they provide a strong check on previous measurements.
2 Methods
In anisotropic crystals the thermal expansion and index of refractive are direction dependent. Each is described by an associated tensor. In their respective principal frames, each tensor is diagonal and the three diagonal elements are the principal values of the linear thermal expansion coefficients and the normalized thermo-optic coefficients . The crystals RTP and KTP have orthorhombic symmetry, so the principal frames for and are co-aligned with the three crystalline axes[1, 2]. There are three different principal expansion coefficients and three different principal thermo-optic coefficients.
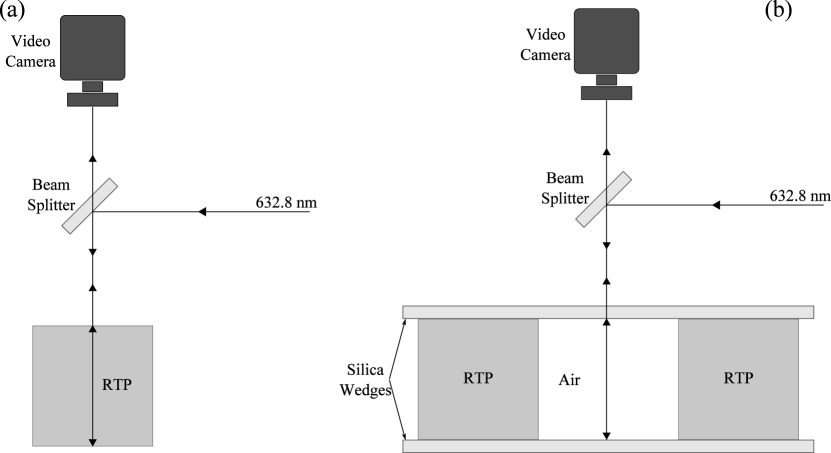
Our measurements are made for light propagating along one of the principal axes and polarized parallel to another principal axis. We use the subscript to indicate the propagation direction and to indicate the polarization direction. For thermo-optic measurements we measure the interference of reflections from the input and output faces of crystal. For the thermal expansion measurements we use the one-pillar or the two-pillar method in which one or two crystal samples are used as spacers between silica optical wedges and the interference pattern is formed by light reflected from the two faces of the wedges that are in contact with the crystal faces. The same temperature controlled oven is used for both measurements. The setups used for the two measurements are diagrammed in Fig. 1.
The thermal expansion coefficient and the thermo-optic coefficient both are zero at 0 K and gradually rise with temperature[3, 4]. This suggests that over the 300-350 K range covered in our measurements both and can change noticeably with temperature. We approximate this temperature dependence using two-term expansions. Defining by (), where is a reference temperature (which we take to be 305 K), we express the temperature-dependent length and refractive index in the form
| (1) |
| (2) |
where refers to the crystal length along the propagation axis at , and refers to the refractive index of polarized light at . The definitions of and are
| (3) |
| (4) |
The round-trip phase for two passes through the crystal can be expressed in the form
where and is the round-trip phase at . We will see that the cross-term is usually negligible compared to , so we drop it, leaving
| (6) |
We define , the normalized optical path length rate of change with temperature, as
| (7) |
or
| (8) |
To determine the values of and we make two measurements. A measurement of is performed using the arrangement in Fig. 1(a) and a measurement of is performed using the arrangement in Fig. 1(b). The crystal is placed in an oven and its temperature is gradually stepped up and down while the strength of the reflected light is monitored. Interference fringes are curve fit assuming and have the form . Air is not birefringent so we drop the polarization subscript for the air values. The two measured values are related to and by
| (9) |
| (10) |
The value of can be computed for a standard atmospheric composition, taking into account the local barometric pressure and its variation during a measurement. From the measured and the computed we find using Eq. (10). Using this and the measured value of in Eq. (9) yields . In the following we abbreviate and with the superscripts and .
3 Measurement methods
We use six RTP samples from Cristal Laser SA, with pairs of crystals cut for propagation along each principal axis, each mm long. The measurements use paired crystals sandwiched between fused silica wedges as shown in diagram (b) of Fig. 1. We also have two KTP samples from Crystal Associates, both cut to a 4.88 mm length parallel to . The dimensions in the and directions are 4.95 mm. All six sides of the KTP samples are polished. The measurements for KTP use a single crystal in place of the crystal pair shown in Fig. 1b. The silica wedges are not optically contacted to the crystals in either the RTP or the KTP measurements.
Our copper oven is a thick cylindrical sleeve, 60 mm long, with a 22.2 mm inner diameter and a 44.4 mm outer diameter. A 6 mm thick sleeve of Teflon insulates the outer wall of the oven on the side and ends. An anti reflection coated silica window is placed on top of the oven to limit convective air currents. The oven is not sealed, so the air pressure inside the oven is in equilibrium with that in the laboratory. The crystal sits on a pedestal to position it close to the center of the oven.
A Cryocon Model 22 temperature controller monitors the oven temperature using a 100 platinum resistive temperature sensor embedded in the oven wall. The temperature controller measures the drop in potential across the platinum resistor with a 1 mA excitation current in a four-wire measurement. The Cryocon Model 22 manual states the absolute temperature measurement accuracy is 6.2 mK at 300 K, with 4.7 mK resolution. The temperature controller is a proportional-integral-derivative (PID) type and varies the heater power to reach a temperature setpoint. Four cartridge heaters (each rated for 80 W at 120 V) are inserted in holes in the oven wall parallel to the bore of the oven. We calibrated a K-type thermocouple read by a Fluke 51 II thermometer by placing it next to the platinum resistor. The thermocouple was then moved to the location of the crystal to compare the crystal temperature with the set point. The difference was less than 0.8 K across the 300-350 K measurement range.
The 632.8 nm HeNe laser is polarized but not frequency stabilized. Its cavity is approximately 600 mm long so mode hops lead to a % shift of the interference fringes from the 5 mm long crystals. In most cases there are ten or so fringes over the full temperature scan so this shift contributes little to the measurement error. Fluctuations of a few percent in laser power, perhaps associated with mode hops, also add some uncertainty in the fringe fitting. We monitor the reflected laser light using an 8-bit black and white CCD camera with image resolution of 640480 at 30 frames per second. Its image shows the quality of the interference fringe and also provides a visual indication of accidental beam tilts. We illuminate a large area of its detector to insure the interference fringes caused by the glass window covering the CCD sensor are averaged. We sum the total signal from all of the CCD pixels to form the reflected light signal.
During all measurements we continuously monitor the barometric pressure using a Freescale Semiconductor Xtrinsic MPL3115A2 I2C Precision Altimeter which gives a 20-bit measurement of pressure in Pascals, with absolute accuracy of kPa and relative accuracy of kPa. A microcontroller logs the pressure once per minute.
We created a LabView virtual instrument to manage the temperature controller’s setpoint and to collect images from the video camera. For each set point we wait several minutes for the temperature sensor to reach the set point and for the sample to thermally equilibrate to the oven. Typical temperature increments are 0.1-3 K, and the scan range is always 300-350 K. For each set point we record the temperature controller’s reading of the temperature sensor, and take 10 images from the camera spread over 30 seconds.
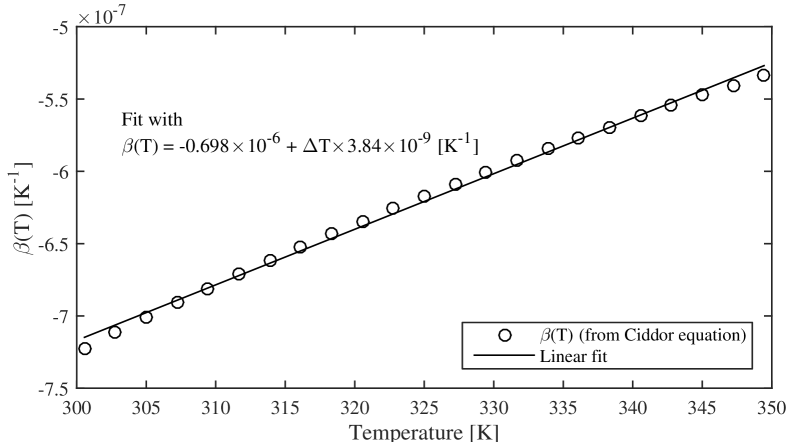
According to Eq. (10) we must know to derive from a measurement of . We calculated the refractive index of air over the range 300-350 K using the Ciddor equation[5] described in the NIST Engineering Metrology Toolbox[6]. Because our laboratory elevation is 1600 m, we defined our standard atmospheric pressure as kPa. From the NIST calculator, the refractive index of air at 305 K, 632.8 nm, relative humidity of 25% and is . This means that at 305 K air adds approximately 21 radians of phase to a 10 mm round trip. The change in the refractive index of air with temperature over our measurement range is due largely to rarefaction. In applying the Ciddor equation we specify a constant water vapor partial pressure that corresponds to 45% relative humidity at 298 K. Numerically differentiating the refractive index with respect to temperature, we find that the normalized thermo-optic change in refractive index is well fit by
| (11) |
Figure 2 compares the calculated from the Ciddor equation and the linear fit of Eq. (11). We find the coefficients in Eq. (11) vary insignificantly over the relative humidity range 0-50% near room temperature, and our measurements were performed at room temperature relative humidities of approximately 20%.
To extract from our data, we fit the reflected signal using a function of the form
| (12) |
so the fit phase is
| (13) |
Differentiating with respect to temperature and dividing by gives
| (14) |
Subtracting given by Eq. (11) from yields . We use discrete temperature steps, but since we must make many measurements with many crystals in many orientations we don’t take a uniform number of measurements per fringe period. In cases with short temperature periods (large values), we might use only a few points per period although the number is always well above the Nyquist limit.
Usually changes in atmospheric pressure during a run have negligible effect on our measurements, but occasionally the atmospheric pressure changes by as much as 2%, corresponding to a round-trip phase change of 0.4 radians. We routinely precompensate our data using the measured barometric pressure by slightly adjusting the measured temperature by an amount corresponding to the pressure induced phase shift before computing the fit. The temperature correction is
| (15) |
where is the measured approximate period of the reflectivity pattern and the sign is the same sign as .
We find our measurements are highly reproducible, with run-to-run variations less than 0.05 in and less than 0.5/K in . The runs are less reproducible. To reduce the uncertainty we typically take several temperature scans and average the results. We think the run-to-run variations are due to small changes in the spacing between the crystal and the wedge(s). The wedge(s) are not optically contacted to the crystals so there is some position creep due to the difference in expansion rates of the silica wedges and the crystal. Contamination on the crystal or wedge surfaces may also contribute. We find no significant difference between the one-pillar and two-pillar measurements in this regard. Other potential sources of measurement uncertainty include slight displacements of the laser beam and slight tilts of the oven and crystal as they heat up, but these should be the similar in the much more reproducible runs, so we think they do not contribute to the variations.
4 RTP results
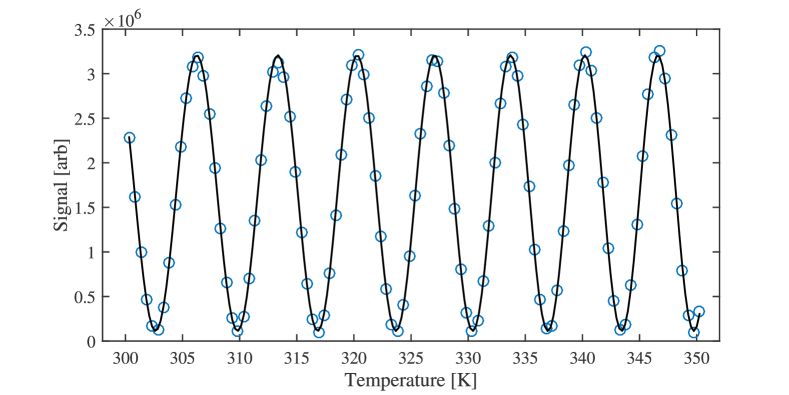
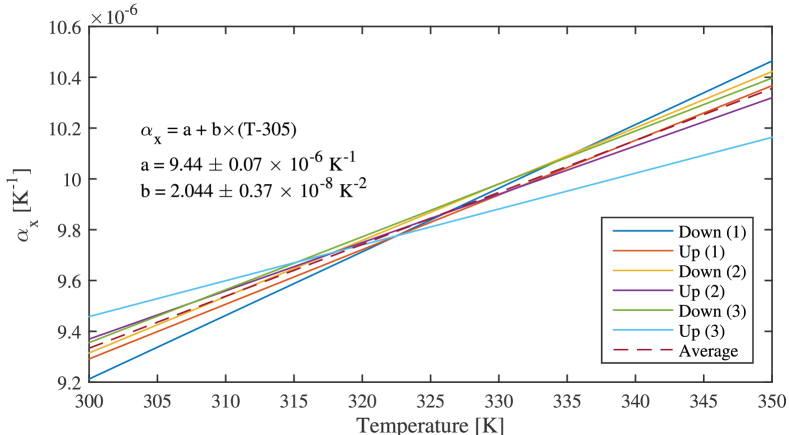
Figure 3 shows a typical fringe measurement for a single temperature scan, in this case for . For a measurement we run several temperature scans in both directions and derive statistical uncertainties of the and coefficients. Figure 4 shows an example of the derived values, including the and uncertainties.
Table 1 summarizes our nine independent measurements for RTP. Our measurement method does not determine the sign of , so the signs of are ambiguous. However, we know from measurements of the crystal lattice parameters as a function of temperature made by Delarue et al[8] that is negative, and and are positive. The sign of is also confirmed by the sign of the fringe shift observed for changing barometric pressure.
| Parameter | a [K-1] | b [K-2] | [K] |
|---|---|---|---|
| 370 | |||
| 325 | |||
| 124 | |||
| 151 | |||
| 440 | |||
| 302 | |||
| 360 | |||
| 495 | |||
| 559 | |||
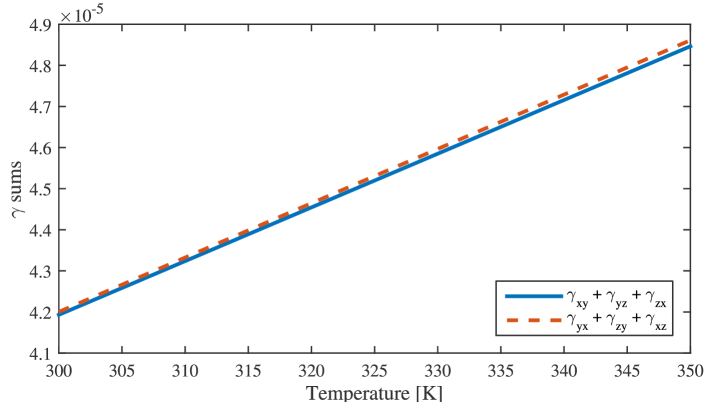
We measure all six values which is redundant since
| (16) |
The sums on both sides of this equation are equal to (). The equality of the two sums in Eq. (16) provides a check on the quality of our measured values. In Figure 5 we compare the two sums, showing that they are equal to within 1%. The statistical variation of the individual measurements is less than 1%.
In our tables of , , and we include the ratio . If these quantities were zero at 0 K and grew linearly we would expect this ratio to be approximately 300 K at 300 K. Linear growth is not realistic, but nevertheless the value of offers a sensibility check worth noting.
| Parameter | a [K-1] | b [K-2] | [K] |
|---|---|---|---|
| 463 | |||
| 625 | |||
| 330 |
| Parameter | a [K-1] | b [K-2] | [K] |
|---|---|---|---|
| 243 | |||
| 263 | |||
| 223 | |||
| 253 | |||
| 233 | |||
| 239 |
Using these values for we can calculate each in two different ways, as shown in Table 3. The two values are generally within the range expected from the uncertainty in values, and the ratio is reasonably consistent, not only for the pairs, but across all three s.
5 Comparison with previously reported values for RTP
| This | (i) | (ii) | (iii) | (iv) | |
| 9.44(20.4) | 10.4(8.7) | 10.8 | 12.8(20.6) | ||
| 12.49(20.0) | 14.1(11.3) | 13.3 | |||
| 5.39(21.4) | 4.59(27.1) | 2.90 | |||
| 7.11(28.0) | 7.08(38.1) | 3.40(34.7) | 5.60 | ||
| 12.35(52.3) | 11.67(74.9) | 8.74(64.3) | 10.57 | ||
| 16.64(44.9) | 17.48(46.8) | 16.20(55.3) | |||
| 24.78(76.4) | 25.77(86.2) | ||||
| 1.16(9.36) | |||||
| 21.85(72.3) | 22.07(83.6) | 21.5(84.9) | |||
| 17.96(40.8) | 18.69(38.4) | ||||
| 2.86(19.0) | 2.47(24.5) |
Mangin et al[7] measured , , and in the range (240 K400 K) using an optical dilatometer. They also measured all six values and derived s. They did not report their values, but instead gave and values which we have used to reconstruct their six . Their coefficients for are all larger than ours because their coefficients for are all smaller than ours. Their coefficients all agree reasonably well with ours. We expect the measurements should agree best because they are the easiest to measure. The main disagreement arises from the measurements.
Chu et al[9] reported values for , , and averaged over K. If we assume that our expansion for can be extended to this range, our averaged values for would be ()/K compared with the ()/K of Chu et al.
Yutsis et al[10] measured over (273-473) K using an optical dilatometer. They also measured and over this range and derived and . Their values of are in close agreement with ours, but their is substantially larger, making their values substantially smaller than ours.
Mikami et al[11] measured , and from 293-393 K every 20 K, using a prism method. They did not account for changes in apex angles due to anisotropic thermal expansion. Their values are substantially smaller than ours.
6 KTP results
Table 5 summarizes our KTP measurements of and . The equality is verified to within 0.6% across the full 300-350 K range for our KTP measurements. The value of was too small to be reliably measured since there was only a fraction of an interference fringe over the full temperature range. Its value is left blank in the Table. We subtract the from the of Table 5 to find the values summarized in Table 6.
| Parameter | a [K-1] | b [K-2] | [K] |
|---|---|---|---|
| 400 | |||
| 367 | |||
| 202 | |||
| 270 | |||
| 440 | |||
| 341 | |||
| 357 | |||
| 346 | |||
| Parameter | a [K-1] | b [K-2] | [K] |
|---|---|---|---|
| 483 | |||
| 439 | |||
| Parameter | a [K-1] | b [K-2] | [K] |
|---|---|---|---|
| 442 | |||
| 316 | |||
| 316 | |||
| 271 |
7 Comparison with previously reported values for KTP
| This | (i) | (ii) | (iii) | (iv) | (v) | (vi) | (vii) | |
|---|---|---|---|---|---|---|---|---|
| 7.88(16.3) | 7.98(11.9) | 6.8 | 9 | 6.85(22) | 7.06(8.8) | |||
| 9.48(21.6) | 9.69(4.1) | 9.6 | 11 | 8.30(14.2) | ||||
| 0.02(6.5) | 0.6 | |||||||
| 3.78(8.55) | 3.61(19.7) | 4.72 | 4.83 | |||||
| 5.24(16.5) | 5.41(24.4) | 6.37 | 6.44 | |||||
| 9.34(32.0) | 9.02(63.1) | 10.45 | 10.68(34.9) | 10.42 | ||||
| 13.12(32.8) | 13.39(36.3) | 13.36(19.2) | ||||||
| 18.99(51.7) | 18.71(67.2) | |||||||
| 3.68(18.2) | 3.63(19.5) | |||||||
| 17.05(50.1) | 17.00(75.0) | 17.53(56.9) | ||||||
| 13.26(30.1) | 13.30(23.8) | |||||||
| 5.38(19.9) | 5.43(24.2) |
Mangin et al[12] measured all three s using an optical dilatometer, and they measured all six values at wavelengths of 1064.2, 632.8, 528.7, and 457.9 nm. Their values for 632.8 nm and their values are in good agreement with ours except for the coefficients of . This means their values also agree well with ours except for the coefficients.
Chu et al[9] reported measurements averaged over the range (293 - 353) K. Their values are ()/K while over this range our averaged values would be (8.17, 9.87, 0.14)/K.
Kato and Takaoka[14] used a variety of published angle phase matching and quasi phase matching results from nonlinear mixing over a wide wavelength range to derive best fit values, and they present expressions for . Their values at 632.8 nm are listed in Table 9. They list only the coefficients so their values are temperature independent. Adding or subtracting the same constant to the three curves would not change the fit to the phase matching data, assuming the contribution of thermal expansion to quasi phase matching is small. It is only the shapes of versus wavelength, combined with the differences in the three values at one wavelength that determine temperature tuning of phase matching. Kato and Takaoka’s differences () and () are /K and /K, in fair agreement with our differences of /K and /K at 305 K. Kato and Takaoka make no mention of the value used in fitting the quasi phase matching data, but it contributes only a small change in the temperature tuning of quasi phase matching in KTP.
Emanueli and Arie[16] measured using an optical dilatometer, and they measured and at 532, 775, 787, 1064, 1509, 1545, and 1585 nm. From those results they derive expressions for and over the wavelength range 500-1700 nm. They do not report their values of so we have reconstructed them at 632.8 nm. Agreement with our s is quite good. However, their value is smaller than ours, which makes their values larger than ours by approximately /K.
Pignatiello et al[17] used a Moire fringe method to measure and , and they report coefficients that are somewhat smaller than ours, and coefficients that are substantially smaller than ours. They claim an uncertainty of only /K on the coefficients and /K2 on the coefficients.
Wiechmann et al[18] used a prism method to measure , and they included the measured temperature dependence of the prism apex angle in their analysis. Their temperature range was 288-313 K. Their values are each larger than ours by approximately /K.
8 Conclusion
We measured the three linear thermal expansion coefficients and the three thermo-optic coefficients of RTP and KTP at 632.8 nm. The statistical, or run-to-run uncertainties of our measurements are indicated in the tables. We think the systematic uncertainties are less 3%, and are due primarily to uncertainties in temperature measurements ( K), crystal length measurements ( m), and unrecorded mode hops of the HeNe laser ( fringe). Our results should reduce the uncertainty arising from previously reported values. They are in good agreement with those of Mangin et al[7, 12] in most cases. Generally, values from various reported measurements tend be in close agreement, but measurements tend to have larger uncertainties, which account for most of the disagreement in the values. Because our measurements were made using the same apparatus and techniques as our measurements, we believe they are quite reliable.