Present address: ]Thomas Jefferson National Accelerator Facility, Newport News, Virginia 23606, USA
Present address: ]Los Alamos National Laboratory, Los Alamos, New Mexico 87544, USA
Present address: ]Thomas Jefferson National Accelerator Facility, Newport News, Virginia 23606, USA
The CLAS Collaboration
Measurement of Target and Double-spin Asymmetries for the
Reaction in the Nucleon Resonance Region at Low
X. Zheng
University of Virginia, Charlottesville, Virginia 22901, USA
K.P. Adhikari
Mississippi State University, Mississippi State, Mississippi 39762, USA
Old Dominion University, Norfolk, Virginia 23529, USA
P. Bosted
Thomas Jefferson National Accelerator Facility, Newport News, Virginia 23606, USA
A. Deur
Thomas Jefferson National Accelerator Facility, Newport News, Virginia 23606, USA
University of Virginia, Charlottesville, Virginia 22901, USA
V. Drozdov
INFN, Sezione di Genova, 16146 Genova, Italy
Skobeltsyn Institute of Nuclear Physics, Lomonosov Moscow State University, 119234 Moscow, Russia
L. El Fassi
Mississippi State University, Mississippi State, Mississippi 39762, USA
Argonne National Laboratory, Argonne, Illinois 60439, USA
Hyekoo Kang
Seoul National University, Seoul, Korea
K. Kovacs
University of Virginia, Charlottesville, Virginia 22901, USA
S. Kuhn
Old Dominion University, Norfolk, Virginia 23529, USA
E. Long
University of New Hampshire, Durham, New Hampshire 03824, USA
S.K. Phillips
University of New Hampshire, Durham, New Hampshire 03824, USA
M. Ripani
INFN, Sezione di Genova, 16146 Genova, Italy
K. Slifer
University of New Hampshire, Durham, New Hampshire 03824, USA
L.C. Smith
University of Virginia, Charlottesville, Virginia 22901, USA
D. Adikaram
[
Old Dominion University, Norfolk, Virginia 23529, USA
Z. Akbar
Florida State University, Tallahassee, Florida 32306, USA
M.J. Amaryan
Old Dominion University, Norfolk, Virginia 23529, USA
S. Anefalos Pereira
INFN, Laboratori Nazionali di Frascati, 00044 Frascati, Italy
G. Asryan
Yerevan Physics Institute, 375036 Yerevan, Armenia
H. Avakian
Thomas Jefferson National Accelerator Facility, Newport News, Virginia 23606, USA
R.A. Badui
Florida International University, Miami, Florida 33199, USA
J. Ball
CEA, Centre de Saclay, Irfu/Service de Physique Nucléaire, 91191 Gif-sur-Yvette, France
N.A. Baltzell
Thomas Jefferson National Accelerator Facility, Newport News, Virginia 23606, USA
University of South Carolina, Columbia, South Carolina 29208, USA
M. Battaglieri
INFN, Sezione di Genova, 16146 Genova, Italy
V. Batourine
Thomas Jefferson National Accelerator Facility, Newport News, Virginia 23606, USA
I. Bedlinskiy
Institute of Theoretical and Experimental Physics, Moscow, 117259, Russia
A.S. Biselli
Fairfield University, Fairfield, Connecticut 06824, USA
Carnegie Mellon University, Pittsburgh, Pennsylvania 15213, USA
W.J. Briscoe
The George Washington University, Washington, DC 20052, USA
S. Bültmann
Old Dominion University, Norfolk, Virginia 23529, USA
V.D. Burkert
Thomas Jefferson National Accelerator Facility, Newport News, Virginia 23606, USA
D.S. Carman
Thomas Jefferson National Accelerator Facility, Newport News, Virginia 23606, USA
A. Celentano
INFN, Sezione di Genova, 16146 Genova, Italy
S. Chandavar
Ohio University, Athens, Ohio 5701, USA
G. Charles
Institut de Physique Nucléaire, CNRS/IN2P3 and Université Paris Sud, Orsay, France
J.-P. Chen
Thomas Jefferson National Accelerator Facility, Newport News, Virginia 23606, USA
T. Chetry
Ohio University, Athens, Ohio 5701, USA
Seonho Choi
Seoul National University, Seoul, Korea
G. Ciullo
INFN, Sezione di Ferrara, 44100 Ferrara, Italy, USA
L. Clark
University of Glasgow, Glasgow G12 8QQ, United Kingdom
L. Colaneri
INFN, Sezione di Roma Tor Vergata, 00133 Rome, Italy
Universita’ di Roma Tor Vergata, 00133 Rome Italy
P.L. Cole
Idaho State University, Pocatello, Idaho 83209, USA
N. Compton
Ohio University, Athens, Ohio 5701, USA
M. Contalbrigo
INFN, Sezione di Ferrara, 44100 Ferrara, Italy, USA
V. Crede
Florida State University, Tallahassee, Florida 32306, USA
A. D’Angelo
INFN, Sezione di Roma Tor Vergata, 00133 Rome, Italy
Universita’ di Roma Tor Vergata, 00133 Rome Italy
N. Dashyan
Yerevan Physics Institute, 375036 Yerevan, Armenia
R. De Vita
INFN, Sezione di Genova, 16146 Genova, Italy
E. De Sanctis
INFN, Laboratori Nazionali di Frascati, 00044 Frascati, Italy
C. Djalali
University of South Carolina, Columbia, South Carolina 29208, USA
G.E. Dodge
Old Dominion University, Norfolk, Virginia 23529, USA
R. Dupre
Institut de Physique Nucléaire, CNRS/IN2P3 and Université Paris Sud, Orsay, France
H. Egiyan
Thomas Jefferson National Accelerator Facility, Newport News, Virginia 23606, USA
University of New Hampshire, Durham, New Hampshire 03824, USA
A. El Alaoui
Universidad Técnica Federico Santa María, Casilla 110-V Valparaíso, Chile
L. Elouadrhiri
Thomas Jefferson National Accelerator Facility, Newport News, Virginia 23606, USA
P. Eugenio
Florida State University, Tallahassee, Florida 32306, USA
E. Fanchini
INFN, Sezione di Genova, 16146 Genova, Italy
G. Fedotov
University of South Carolina, Columbia, South Carolina 29208, USA
Skobeltsyn Institute of Nuclear Physics, Lomonosov Moscow State University, 119234 Moscow, Russia
R. Fersch
Christopher Newport University, Newport News, Virginia 23606, USA
A. Filippi
INFN, Sezione di Torino, 10125 Torino, Italy
J.A. Fleming
Edinburgh University, Edinburgh EH9 3JZ, United Kingdom
N. Gevorgyan
Yerevan Physics Institute, 375036 Yerevan, Armenia
Y. Ghandilyan
Yerevan Physics Institute, 375036 Yerevan, Armenia
G.P. Gilfoyle
University of Richmond, Richmond, Virginia 23173, USA
K.L. Giovanetti
James Madison University, Harrisonburg, Virginia 22807, USA
F.X. Girod
Thomas Jefferson National Accelerator Facility, Newport News, Virginia 23606, USA
CEA, Centre de Saclay, Irfu/Service de Physique Nucléaire, 91191 Gif-sur-Yvette, France
C. Gleason
University of South Carolina, Columbia, South Carolina 29208, USA
E. Golovach
Skobeltsyn Institute of Nuclear Physics, Lomonosov Moscow State University, 119234 Moscow, Russia
R.W. Gothe
University of South Carolina, Columbia, South Carolina 29208, USA
K.A. Griffioen
College of William and Mary, Williamsburg, Virginia 23187, USA
M. Guidal
Institut de Physique Nucléaire, CNRS/IN2P3 and Université Paris Sud, Orsay, France
N. Guler
[
Old Dominion University, Norfolk, Virginia 23529, USA
L. Guo
Florida International University, Miami, Florida 33199, USA
Thomas Jefferson National Accelerator Facility, Newport News, Virginia 23606, USA
C. Hanretty
[
University of Virginia, Charlottesville, Virginia 22901, USA
N. Harrison
Thomas Jefferson National Accelerator Facility, Newport News, Virginia 23606, USA
M. Hattawy
Argonne National Laboratory, Argonne, Illinois 60439, USA
K. Hicks
Ohio University, Athens, Ohio 5701, USA
M. Holtrop
University of New Hampshire, Durham, New Hampshire 03824, USA
S.M. Hughes
Edinburgh University, Edinburgh EH9 3JZ, United Kingdom
Y. Ilieva
University of South Carolina, Columbia, South Carolina 29208, USA
The George Washington University, Washington, DC 20052, USA
D.G. Ireland
University of Glasgow, Glasgow G12 8QQ, United Kingdom
B.S. Ishkhanov
Skobeltsyn Institute of Nuclear Physics, Lomonosov Moscow State University, 119234 Moscow, Russia
E.L. Isupov
Skobeltsyn Institute of Nuclear Physics, Lomonosov Moscow State University, 119234 Moscow, Russia
D. Jenkins
Virginia Tech, Blacksburg, Virginia 24061, USA
H. Jiang
University of South Carolina, Columbia, South Carolina 29208, USA
H.S. Jo
Institut de Physique Nucléaire, CNRS/IN2P3 and Université Paris Sud, Orsay, France
S. Joosten
Temple University, Philadelphia, Pennsylvania 19122, USA
D. Keller
University of Virginia, Charlottesville, Virginia 22901, USA
G. Khachatryan
Yerevan Physics Institute, 375036 Yerevan, Armenia
M. Khandaker
Idaho State University, Pocatello, Idaho 83209, USA
Norfolk State University, Norfolk, Virginia 23504, USA
A. Kim
University of Connecticut, Storrs, Connecticut 06269, USA
W. Kim
Kyungpook National University, Daegu 702-701, Republic of Korea
F.J. Klein
Catholic University of America, Washington, D.C. 20064, USA
V. Kubarovsky
Thomas Jefferson National Accelerator Facility, Newport News, Virginia 23606, USA
Rensselaer Polytechnic Institute, Troy, New York 12180, USA
L. Lanza
INFN, Sezione di Roma Tor Vergata, 00133 Rome, Italy
Universita’ di Roma Tor Vergata, 00133 Rome Italy
P. Lenisa
INFN, Sezione di Ferrara, 44100 Ferrara, Italy, USA
K. Livingston
University of Glasgow, Glasgow G12 8QQ, United Kingdom
I .J .D. MacGregor
University of Glasgow, Glasgow G12 8QQ, United Kingdom
N. Markov
University of Connecticut, Storrs, Connecticut 06269, USA
B. McKinnon
University of Glasgow, Glasgow G12 8QQ, United Kingdom
M. Mirazita
INFN, Laboratori Nazionali di Frascati, 00044 Frascati, Italy
V. Mokeev
Thomas Jefferson National Accelerator Facility, Newport News, Virginia 23606, USA
Skobeltsyn Institute of Nuclear Physics, Lomonosov Moscow State University, 119234 Moscow, Russia
A Movsisyan
INFN, Sezione di Ferrara, 44100 Ferrara, Italy, USA
E. Munevar
Thomas Jefferson National Accelerator Facility, Newport News, Virginia 23606, USA
The George Washington University, Washington, DC 20052, USA
C. Munoz Camacho
Institut de Physique Nucléaire, CNRS/IN2P3 and Université Paris Sud, Orsay, France
G. Murdoch
University of Glasgow, Glasgow G12 8QQ, United Kingdom
P. Nadel-Turonski
Thomas Jefferson National Accelerator Facility, Newport News, Virginia 23606, USA
Catholic University of America, Washington, D.C. 20064, USA
L.A. Net
University of South Carolina, Columbia, South Carolina 29208, USA
A. Ni
Kyungpook National University, Daegu 702-701, Republic of Korea
S. Niccolai
Institut de Physique Nucléaire, CNRS/IN2P3 and Université Paris Sud, Orsay, France
G. Niculescu
James Madison University, Harrisonburg, Virginia 22807, USA
I. Niculescu
James Madison University, Harrisonburg, Virginia 22807, USA
M. Osipenko
INFN, Sezione di Genova, 16146 Genova, Italy
A.I. Ostrovidov
Florida State University, Tallahassee, Florida 32306, USA
M. Paolone
Temple University, Philadelphia, Pennsylvania 19122, USA
R. Paremuzyan
University of New Hampshire, Durham, New Hampshire 03824, USA
K. Park
Thomas Jefferson National Accelerator Facility, Newport News, Virginia 23606, USA
Kyungpook National University, Daegu 702-701, Republic of Korea
E. Pasyuk
Thomas Jefferson National Accelerator Facility, Newport News, Virginia 23606, USA
P. Peng
University of Virginia, Charlottesville, Virginia 22901, USA
S. Pisano
INFN, Laboratori Nazionali di Frascati, 00044 Frascati, Italy
O. Pogorelko
Institute of Theoretical and Experimental Physics, Moscow, 117259, Russia
J.W. Price
California State University, Dominguez Hills, Carson, California 90747, USA
A.J.R. Puckett
University of Connecticut, Storrs, Connecticut 06269, USA
B.A. Raue
Florida International University, Miami, Florida 33199, USA
Thomas Jefferson National Accelerator Facility, Newport News, Virginia 23606, USA
A. Rizzo
INFN, Sezione di Roma Tor Vergata, 00133 Rome, Italy
Universita’ di Roma Tor Vergata, 00133 Rome Italy
G. Rosner
University of Glasgow, Glasgow G12 8QQ, United Kingdom
P. Rossi
Thomas Jefferson National Accelerator Facility, Newport News, Virginia 23606, USA
INFN, Laboratori Nazionali di Frascati, 00044 Frascati, Italy
P. Roy
Florida State University, Tallahassee, Florida 32306, USA
F. Sabatié
CEA, Centre de Saclay, Irfu/Service de Physique Nucléaire, 91191 Gif-sur-Yvette, France
C. Salgado
Norfolk State University, Norfolk, Virginia 23504, USA
R.A. Schumacher
Carnegie Mellon University, Pittsburgh, Pennsylvania 15213, USA
Y.G. Sharabian
Thomas Jefferson National Accelerator Facility, Newport News, Virginia 23606, USA
Iu. Skorodumina
University of South Carolina, Columbia, South Carolina 29208, USA
Skobeltsyn Institute of Nuclear Physics, Lomonosov Moscow State University, 119234 Moscow, Russia
G.D. Smith
Edinburgh University, Edinburgh EH9 3JZ, United Kingdom
D. Sokhan
University of Glasgow, Glasgow G12 8QQ, United Kingdom
N. Sparveris
Temple University, Philadelphia, Pennsylvania 19122, USA
I. Stankovic
Edinburgh University, Edinburgh EH9 3JZ, United Kingdom
I.I. Strakovsky
The George Washington University, Washington, DC 20052, USA
S. Strauch
University of South Carolina, Columbia, South Carolina 29208, USA
The George Washington University, Washington, DC 20052, USA
M. Taiuti
INFN, Sezione di Genova, 16146 Genova, Italy
Università di Genova, Dipartimento di Fisica, 16146 Genova, Italy
Ye Tian
University of South Carolina, Columbia, South Carolina 29208, USA
M. Ungaro
Thomas Jefferson National Accelerator Facility, Newport News, Virginia 23606, USA
University of Connecticut, Storrs, Connecticut 06269, USA
H. Voskanyan
Yerevan Physics Institute, 375036 Yerevan, Armenia
E. Voutier
Institut de Physique Nucléaire, CNRS/IN2P3 and Université Paris Sud, Orsay, France
N.K. Walford
Catholic University of America, Washington, D.C. 20064, USA
D.P.. Watts
Edinburgh University, Edinburgh EH9 3JZ, United Kingdom
X. Wei
Thomas Jefferson National Accelerator Facility, Newport News, Virginia 23606, USA
L.B. Weinstein
Old Dominion University, Norfolk, Virginia 23529, USA
M.H. Wood
Canisius College, Buffalo, New York 14208, USA
University of South Carolina, Columbia, South Carolina 29208, USA
N. Zachariou
Edinburgh University, Edinburgh EH9 3JZ, United Kingdom
J. Zhang
Thomas Jefferson National Accelerator Facility, Newport News, Virginia 23606, USA
I. Zonta
INFN, Sezione di Roma Tor Vergata, 00133 Rome, Italy
Universita’ di Roma Tor Vergata, 00133 Rome Italy
Abstract
We report measurements of target- and double-spin asymmetries for
the exclusive channel in the nucleon resonance
region at Jefferson Lab using the CEBAF Large Acceptance Spectrometer (CLAS).
These asymmetries were extracted from data obtained using a longitudinally polarized NH3
target and a longitudinally polarized electron beam with energies 1.1, 1.3,
2.0, 2.3 and 3.0 GeV. The new results are consistent with previous CLAS
publications but are extended to a low range from
to (GeV)2.
The access was made possible by a custom-built Cherenkov
detector that allowed the detection of electrons for
scattering angles as low as . These results are compared with
the unitary isobar models JANR and MAID, the partial-wave analysis
prediction from SAID
and the dynamic model DMT. In many kinematic regions our results,
in particular results on the target asymmetry, help to
constrain the polarization-dependent components of these models.
pacs:
13.60.Le, 13.88.+e, 14.20.Gk
I Physics Motivation
The perturbative nature of the strong interaction at small distances – often
referred to as “asymptotic freedom” – was established more than 30 years ago
and provided strong support for quantum chromodynamics (QCD) to be accepted
as the correct theory for strong interactions Gross:1973id ; Politzer:1973fx .
On the other hand, calculations at long-distances are still beyond reach because of the
non-perturbative nature at this scale. As a result, we are still far away
from being able to describe the strong force as it manifests itself in the
structure of baryons and mesons Burkert:2004sk ; Aznauryan:2011qj .
A fundamental approach to resolve this difficulty is to develop accurate numerical
simulations of QCD on the lattice; for recent reviews
see Hoelbling:2014uea ; Ukawa:2015eka .
However lattice QCD methods are difficult to
apply to light-quark systems such as the nucleon.
Alternatively, hadron
models with effective degrees of freedom have been constructed to interpret data.
One example is the chiral perturbation theory Bernard:1993bq ; Bernard:1996bi ,
which is constrained only by the symmetry properties of QCD.
The constituent quark model, though not fully understood, is one
successful example that works almost everywhere from hadron spectroscopy to
deep inelastic scattering Zheng:2003un ; Zheng:2004ce . Predictions for the scattering
amplitudes and polarization-dependent
asymmetries exist for many resonances within the framework of
the relativistic constituent
quark model (RCQM) Warns:1989xr and the single quark transition model
(SQTM) Burkert:2002zz .
The comparison between these predictions
and experimental results, on the other hand, is not straightforward.
This is because the experimentally measured cross sections and asymmetries
are usually complicated combinations of resonant and non-resonant amplitudes
and couplings, and their interference terms. To compare with theories,
partial wave analyses
are often used to extract these amplitudes and resonance couplings from data.
Once comparisons can be made, data are used to provide inputs for constructing
or adjusting meson production mechanisms in theories and models, such as
proper treatment of the hadronic final state and implementation of the
non-resonant part of the meson production amplitude. These mechanisms are
usually not included in quark models.
Examples of phenomenological partial wave analyses that can benefit from more data
are MAID Drechsel:2007if , JANR Aznauryan:2009mx , SAID Arndt:2009nv ,
and the DMT Kamalov:1999hs models.
Electron-scattering data used to test these calculations include primarily
transition form factors and response
functions for meson production reactions obtained from Jefferson Lab (JLab),
MAMI and MIT-Bates.
Recently, polarization observables such as double spin asymmetries
and target spin asymmetries
for pion electro-production from the proton have made the beam- and target-helicity response
functions accessible DeVita:2001ue ; DeVita:2002uv ; Biselli:2003ym ; EG1b-Pierce-thesis ,
providing a new approach to testing models and to a greater understanding of
the baryon resonance structure.
As an example, the MAID model was based mostly on unpolarized data and is only recently
being tested extensively against double polarization asymmetries.
In general, polarization observables provide an important constraint on
the understanding of the underlying helicity response functions
or interference terms in and resonances.
Compared to the proton, existing data on neutron excitation were particularly
sparse. Neutron data have recently become available from
JLab EG1b-Careccia-thesis ; Bosted:2016leu , which make it
possible to test the isospin structure of models such as RCQM and SQTM.
The neutron data will be valuable to the development of
many phenomenological analyses as well because they need to incorporate
double polarization asymmetry data for all pion production channels
from both the proton and the neutron
to perform the full isospin decomposition.
In addition, data at very low values are often desired for testing the chiral
perturbation theory and to study the transition from virtual photons to the real photon point ().
Here, is defined as ,
where is the four-momentum transferred from the incident
electron to the target and
(1)
with and the incident and the scattered electron’s energies, respectively.
At low energy transfers GeV the most prominent resonances are the ,
, and Warns:1989xr . For the and
, their amplitudes at large are determined by perturbative QCD
and hadron helicity conservation. It is expected in this region that , where
is the virtual photon helicity asymmetry defined as:
(2)
with the scattering amplitudes and the subscripts indicate the
total spin projection of the virtual photon and the nucleon target along the
virtual photon’s momentum.
However, data using real photons show
a strong helicity-3/2 dominance and PDG . This indicates that
for these two resonances must cross zero at some intermediate and there have
been calculations for the -dependence of from various
models Warns:1989xr ; Burkert:2002zz ; Capstick:1992uc .
For pion electroproduction, the double spin asymmetry is dominated by
DeVita:2001ue and thus data on this observable
will allow us to test a possible sign flip for the and resonances.
Data on the double spin asymmetry of pion photoproduction have recently become available
from the CBELSA/TAPS Collaboration Gottschall:2013uha and are also expeced
from JLab experiments Iwamoto:2012zza ; Schott:2015fbn ; E04-102 , all used the
frozen spin target with a longitudinal polarization and a circularly polarized photon beam. These
photoproduction data will further test the transition to the real photon point.
I.1 Formalism for pion electroproduction
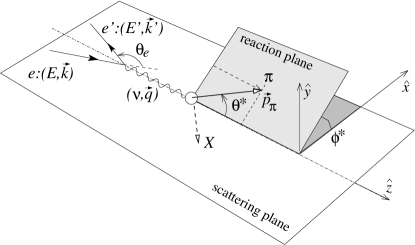
Figure 1 shows the kinematics of single pion
production in the Born approximation: The electron transfers a virtual
photon of four-momentum to the target nucleon which forms a
nucleon resonance. The resonance then decays into a pion and another
particle . Two planes are used to describe this process:
the scattering (leptonic) plane defined by the incoming and outgoing electrons’
momenta and , and the reaction (hadronic) plane defined
by the momentum of the virtual photon and the
momentum of the outgoing pion .
Figure 1: Kinematics of single pion electro-production. The Lorentz boost associated
with the transformation from the laboratory to the CM frame of the system is
along the momentum transfer , where the coordinates
of the CM frame are defined in this picture.
The reaction is usually described in terms of ,
the invariant mass of the system (which
is also the system), and two angles and .
Here, is the angle formed by and ,
and is the angle formed by rotating the leptonic plane to the hadronic plane.
If one defines the center of mass (CM) frame with pointing along
, along , then and are the
polar and the azimuthal angles of the emitted pion.
The energy transfer is related to and via
(3)
with the nucleon mass.
The differential cross section for the reaction
with longitudinally polarized beam and target
can be written in the following form
(4)
with
(5)
where and are respectively the polarizations of the electron beam and the
target along the beam direction, is the unpolarized cross section, and
, and are the polarized cross section terms
when beam, target, and both beam and target are polarized.
Note that the differential cross sections on the right-hand side of
Eq. (5) are defined in the CM
frame of the system, as indicated by the asterisk in the pion’s solid angle.
The virtual photon flux is
(6)
where is the electromagnetic coupling constant,
is the photon
equivalent energy in the laboratory frame, i.e. the energy needed by a real photon to
excite the nucleon to an invariant mass .
The virtual photon polarization is given by
(7)
where is the angle between the incident and outgoing electrons
in the laboratory frame. The can be calculated as
(8)
To evaluate the pion’s kinematics in the CM frame of the system,
we relate a laboratory-frame 4-momentum vector to the CM-frame
via a Lorentz boost
with and :
(9)
(10)
(11)
(12)
Specifically, we have for the virtual photon:
(13)
(14)
For the pion
(15)
(16)
where
is the angle between the pion momentum and
in the laboratory frame, and
is the pion energy again in the laboratory frame.
The polar angle of the pion in the CM frame is given by
(17)
where is the pion mass.
The azimuthal angle of the pion is the same in the laboratory and the CM frame, given by
(18)
with and . In this
paper, the range of is defined from to , i.e. a shift of is
added to if the result from Eq. (18) is negative.
The beam, target and double beam-target asymmetries are
(19)
(20)
(21)
where each cross section stands for the
of Eq. (5).
Note that we have adopted an extra minus sign in the definition of
to be consistent with Eq. (2) and previous CLAS
publications DeVita:2001ue ; DeVita:2002uv ; Biselli:2003ym .
In this paper, we report on results of both and extracted
from the JLab CLAS EG4 PR03006 ; PR05111 data. The beam asymmetry
was also extracted from the data, but was used only as a cross-check of the
beam helicity and is not presented here. These results
are available for download from the CLAS database.
I.2 Previous data
The first double-spin asymmetry for the channel was published
based on the CLAS EG1a data with a 2.6 GeV beam, for a range from
0.35 to 1.5 (GeV/)2DeVita:2001ue ; DeVita:2002uv .
The channel was analyzed for the
region using the same dataset Biselli:2003ym .
Similar analysis using the CLAS EG1b data was
completed EG1b-Pierce-thesis ; Bosted:2016leu ,
in which the target and the double spin asymmetries were extracted
from both the and
channels using 1.6 – 5.7 GeV beams with as low as 0.1 (GeV/)2.
II The JLab CLAS EG4 Experiment
The main physics goal of the CLAS EG4 experiment PR03006 ; PR05111 was
to measure the inclusive spin structure functions on the proton and the deuteron, and to
extract the generalized Gerasimov-Drell-Hearn (GDH) sum near the photon point.
The original GDH sum rule Gerasimov:1965et ; Drell:1966jv , defined for real
photons, is a fundamental
prediction on the nucleon’s spin structure that relates the helicity-dependent
total photo-absorption cross section to the nucleon anomalous
magnetic moment. The definition of the GDH sum was generalized to virtual
photons Anselmino:1988hn ; Ji:2001yu , and
the value of the generalized GDH sum at low was predicted in the
chiral perturbation theory. Similar to the pion production results presented here,
the goal of the EG4’s inclusive analysis is to test the chiral
perturbation theory prediction and to compare the extrapolation to the point
with the GDH sum rule of the real photon.
The experiment was carried out in 2006 in experimental Hall B of
JLab. Inclusive data were collected in the
range GeV/ and
down to (GeV/)2EG4-Kang-thesis , using six beam energies
(1.1, 1.3, 1.5, 2.0, 2.3, 3.0 GeV)
on a polarized NH3 target and two energies (1.3, 2.0 GeV) on a polarized ND3
target.
The average polarizations of NH3 and ND3
typically ranged within and , respectively.
For the exclusive channel, only NH3 data with beam energies of 1.1, 1.3,
2.0, 2.3, and 3.0 GeV were analyzed with
the lowest being (GeV/)2. The 1.5 GeV energy data were excluded because
they were taken for
run commissioning purpose and had limited statistics. For ND3 data, the target spin
direction was not flipped during the run, which makes it impossible to extract nor the
complete information on from the exclusive channel.
II.1 The CLAS detector
The CEBAF Large Acceptance Spectrometer (CLAS) was used to detect scattered
particles Mecking:2003zu .
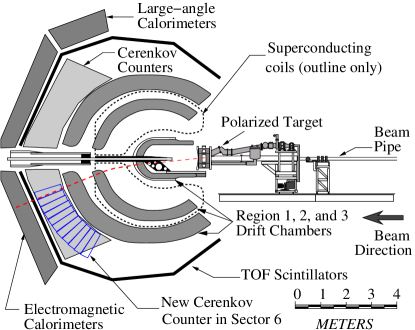
Figure 2 shows the basic structure of CLAS during EG4 with the
polarized target installed.
CLAS is an almost hermetic detector, optimized for the measurement of multi-particle
final states in a large momentum region. The detector design is based on a toroidal magnet
made by six superconducting coils arranged around the beam line to produce a field pointing primarily in the azimuthal direction. The field direction can be set such that the scattered
negatively-charged particles can be either bent away from the beamline (“electron outbending”)
or towards it (“electron inbending”).
The detector itself is composed of six independent magnetic spectrometers, referred to as
six “sectors”, with a common target, trigger, and data acquisition system. Each sector
is equipped with a three-layer drift chamber (DC) system for momentum and tracking
determination, a time-of-flight (TOF) counter, a Cherenkov counter (CC) and a
double-layer electromagnetic calorimeter (EC). The TOF, CC, and EC systems
are primarily used for determining the particle type.
To reach very low while retaining the high beam energy needed to
measure the GDH sum, a small scattering angle was necessary. This was achieved
by running the CLAS torus magnet in the electron-outbending configuration.
Although the standard CLAS Cherenkov detector geometrically reaches an scattering
angle Adams:2001kk , its structure is not ideal for collecting the Cherenkov light
for outbending electrons. Therefore, for the EG4 experiment, a new Cherenkov detector was built
by the INFN-Genova group and installed in sector 6, as shown in Fig. 2.
It was designed to reach scattering angle by optimizing the light
collection for the electron-outbending configuration.
Because of the very high counting rates at such low scattering angles, instrumenting only
one CLAS sector was sufficient for the experiment.
The new Cherenkov detector used
the same radiator gas (C4F10) and the gas flow control system used in the standard
CLAS Cherenkov.
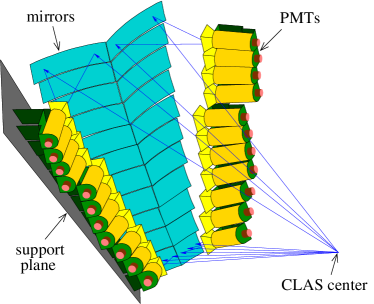
It consisted of 11 segments, each equipped with a pair of light-weight spherical mirrors;
see Fig. 3.
The mirrors were constructed following Cisbani:2003fj , by shaping a plexiglass layer
onto a spherical mould, then gluing onto it a sandwich of carbon fiber and honeycomb, and
finally evaporating a thin layer of aluminum onto the plexiglass. Each mirror reflected
the light towards a light collector made of two pieces, an entrance section with the
approximate shape of a truncated pyramid and a guiding section cylindrical in shape
such as to match the circular photocathode. Each light collector was made of plexiglass
with aluminum evaporated on the internal surface. The entrance section was built by a
no-contact technique, where the plexiglass sheet was heated and pushed against a mould
with the desired shape, then the bottom of the obtained object was cut to permit the
free passage of light. The cylindrical section was obtained by cutting a plexiglass tube.
The two sections were then glued together before evaporating the reflective layer.
For the PMTs, the Photonis XP4508B with quartz window were chosen.
The photoelectron yield was greater than within the kinematic region of the experiment,
thereby yielding a high electron detection efficiency down to a scattering angle of about .
Signals from the new Cherenkov were built into the main electron trigger during EG4.
Consequently only 1/6 of the full azimuthal acceptance of CLAS was used to detect and
identify forward-angle scattered electrons.
Figure 2: (Color online) CLAS during EG4 showing the polarized target
and the detector arrangement. A new Cherenkov detector consisting of 11 segments
was installed in place of the original Cherenkov in sector 6. It provided
the ability of detecting scattered electrons in the outbending configuration
with scattering angles as small as (dashed-line track).
Figure 3: (Color online) The new Cherenkov detector designed and built by the
INFN-Genova group. It consists of 11 pairs of mirrors with spherical curvature, which
reflect the Cherenkov light to corresponding photo-multiplier tubes (PMTs).
Only one of the two support planes for the PMTs is shown here. The solid blue
lines show simulated particle trajectories originated from the CLAS center and the
reflection of the Cherenkov light towards the PMT.
II.2 The polarized electron beam
The polarized electron beam was produced by illuminating a strained
GaAs photocathode with circularly polarized light. The helicity of the
electron beam was selected from a pseudo-random sequence, and followed
a quartet structure of either “” or “”, with each helicity
state lasting 33 ms.
The helicity sequence controlled the trigger system, and periods of beam
instability from helicity reversal were rejected from the data stream.
To reduce possible systematic uncertainties, data were taken for two
different beam helicity configurations, with the beam insertable half-wave
plate (IHWP) inserted (in) and removed (out), respectively.
The polarization of the electron beam was measured by both a Møller and a Mott polarimeter.
II.3 The polarized targets
The polarized targets used for EG4 were the frozen 15NH3 and 14ND3 targets
dynamically polarized at 1 K with a 5-Tesla field. These were the same as the
targets used for previous CLAS double-polarization measurements Crabb:1995xi .
The target material was irradiated with 20 MeV electrons
prior to the experiment to impart the paramagnetic radicals necessary for dynamic polarization.
It was subsequently stored in liquid nitrogen (LN2) until needed for the experiment.
The material, in the form of 1-2 mm sized granules, was then removed from the LN2 storage
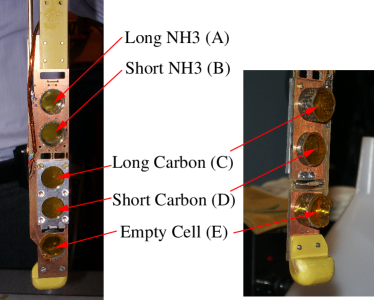
dewars and loaded into two cylindrical containers on the target insert. The structure of
the target insert is shown in Fig. 4. The containers were either 1.0 cm
or 0.5 cm in length, hereafter referred to as the long and short cells, respectively. The
insert was then quickly placed into the target “banjo”, a 1-2 liter vessel of 1-K liquid helium at
the center of a 5-T superconducting split coil magnet. A complete description of the
polarized target can be found in Ref. Keith:2003ca .
Figure 4: (Color online) Target insert used during the EG4 experiment.
A 1.0-cm long NH3 and the 0.5-cm long NH3 targets were installed
in the Long and Short NH3 positions during the first half of the NH3
run period. They were called the “long NH3 top”
and the “short NH3” targets, respectively. During the second half of the
NH3 run, two 1.0-cm long NH3 targets were installed in the Long and the Short
positions; they were called the “long NH3 top” and the “long NH3
bottom”
targets, respectively. For the ND3 run period only one 1.0-cm long ND3 target
was installed in the Short position. The five target positions are labeled
A, B, C, D, and E, as shown.
Because of the presence of gaps between the frozen crystals inside the target cell,
even if the length of the
target cell or the banjo could be determined precisely, the exact amount of polarized
materials interacting with the electron beam could not be directly measured.
The fraction of the target filled by frozen polarized material is called the
“packing factor” and is typically extracted by comparing the yield from
the polarized target to those from
carbon and “empty” targets. For the carbon target, a carbon
foil with known thickness was placed in an empty target cell and filled with
liquid 4He. There were two carbon targets, labeled “long” and “short”
carbon, of which both the cell length and the foil thickness match those of
the long and the short NH3 targets, respectively.
Empty targets refer to target cells with no solid material
inside. Empty targets
can either be filled with liquid 4He, or the 4He can be completely
pumped out. There was only one empty cell during EG4 to physically host
the empty targets, which was 1.0 cm in length.
During EG4 the polarized target was placed 1.01 m upstream from the CLAS
center to increase the acceptance at low by reducing the minimum angle
for the scattered electrons. The following targets were used: two 1.0-cm long
and one 0.5-cm long NH3 target, one 1.0-cm long ND3 target, one -cm and
one 0.108-cm thick 12C target, and one empty target.
The target types during EG4 are defined in Table 1.
Unless specified otherwise, “empty target” refers to target type 3
[empty cell with helium (1 cm)] hereafter.
Table 1: Targets used during EG4 along with their target lengths and densities.
The target ID was the value recorded in the data. ID 10 was not used.
The target position refers to the physical location on the target
insert defined in Fig. 4.
Target
Target type
Target
length
Density
ID
position
(cm)
(g/cm3)
1
long NH3 top
A
1.0
0.917a
2
long ND3
B
1.0
1.056a
3
empty cell with helium
E
1.0
0.145b
4
long carbon
C
1.0, 0.216c
2.166d
5
short NH3
B
0.5
0.917a
6
short carbon
D
0.5, 0.108c
2.166d
7
long carbon no helium
C
1.0, 0.216c
2.166d
8
empty cell without helium
E
1.0
9
short carbon without helium
D
0.5
2.166c
11
long NH3 bottom
B
1.0
0.917a
a For polarized NH3 or ND3 the densities are the density of the frozen polarized
material beads.
b Helium density.
c The first and the second length values correspond to the cell length and the
carbon foil thickness, respectively.
d Carbon density.
An NMR system was used to monitor the polarization of the target during the experiment, but was
subject to three systematic uncertainties that limited its suitability for data analysis.
First, the NMR coils were wrapped around the outside of the 1.5-cm diameter target cells,
while the electron beam was only rastered over the central 1.2 cm portion of the target.
The NMR signal was thus dominated by the material at the edges of the cell, and lacked
sensitivity to the beam-induced depolarization of the material at the center. This
uncertainty is difficult to estimate, as the effect depends on the accumulated dose.
Second, for the EG4 experiment the two polarized target cells were adjacent to one another
on the insert, as shown in Fig. 4, and cross-talk was observed between
the cells’ NMR circuits. Tests performed at the end of the experiment indicate that
cross-talk could contribute an uncertainty of about 5-10% to the polarization measurement
because of
its effect on the thermal-equilibrium calibration of the NMR signal. Third, calibration of
the NMR system itself is normally subject to a 4-5% uncertainty.
These three effects added up to a large systematic
uncertainty to the target polarization measured by NMR.
Therefore, it was
decided that the asymmetries of elastic scattering would be used to extract the product
of the beam and target polarizations needed for the exclusive channel
analysis reported here.
The methods and results for the elastic extraction will be described in
Sec. III.4.
For NH3, the use of 15N has the advantage that only one unpaired proton can
be polarized, while all neutrons are paired to spin zero. The polarized proton
in the 15N does, however, affect the measured asymmetry by a small amount, as
discussed in Sec. III.7.
III Data Analysis
III.1 Exclusive event selection
Exclusive events were identified
by detecting the final state electron in coincidence with a pion and using
a missing mass cut to select the undetected neutron.
For each event, we required that two particles be detected with
the correct charges ( for the electron and
for the ). Each particle was required to have valid information from
DC and TOF, and have reconstructed momentum greater than 0.3 GeV/
(0.1 GeV/ higher than the momentum acceptance of CLAS Mecking:2003zu ).
For particle identification, EC and CC signals were used to identify electrons.
Cuts were applied on the EC: ,
and , where
and are the energy deposited in the
inner and the outer layers of the EC, respectively; and
is the particle momentum in GeV/. These cuts were selected to optimize
the separation of electrons (that produce electromagnetic showers) from
pions (that deposit energy mostly through ionizations).
We also required there to be
only one hit in the CC, with its signal consistent
with those from the EC and the TOF in both hit position and timing.
Pions were determined from a mass cut of GeV/ and
a TOF cut ns. The expected
flight time of the pion, , was calculated from the
particle’s momentum in combination with the timing of the electron.
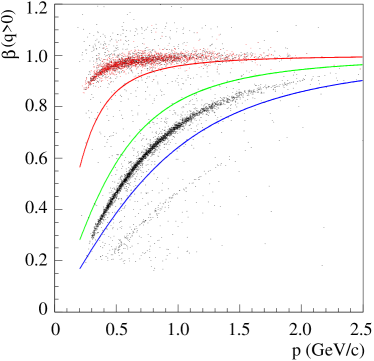
Figure 5 shows the effect of the TOF cut
on the vs. momentum distributions, where
is the velocity amplitude (speed) of the particle. The TOF cut used
clearly selected pions out of other particle background.
Figure 5: vs. for all positively charged particles,
with (red) and without (black) TOF cut for pions.
The red, green and blue curves correspond to reconstructed masses
of , and GeV, respectively, which are typical cut-off
values used to distinguish between pions and kaons, kaons and protons, and
protons and heavier particles. As can be seen, the positively charged
particles detected consist of significant fractions of protons and heavier
particles and a small fraction of kaons, but the ns TOF cut is
quite effective in selecting pions. These data were collected on the
long top NH3 target during the 3 GeV run period.
For each event, a vertex was used. Here is defined as pointing
along the beam direction with the origin coinciding with the CLAS center.
The polarized target was positioned upstream of the CLAS center during EG4
(see Fig. 2), and the center of the target was determined from
empty target data to be at cm. The cut was optimized to be
(22)
where the range was determined using empty target data to exclude as much
material outside the target as possible. See Fig. 7
in Sec. III.3 for a detailed presentation of the vertex
distribution.
Acceptance cuts, also called “fiducial cuts”, were applied on both
electrons and pions using reconstructed
DC variables. These acceptance cuts exclude regions where the detector
efficiency is not well understood, which often happens on the edge
of the detectors, but could also include regions
where certain parts of the detectors malfunctioned.
Moreover, because the main purpose of EG4 was measurement of the GDH sum, which
only requires detection of inclusively-scattered electrons, not all six
DC sectors were turned on during the run. This caused a variation in the
acceptance of the exclusive channel.
Determination of the acceptance and its effects on the asymmetries will be described in
Sec. III.8.
III.2 Beam properties
As described in the previous section, the helicity of the electron beam
followed a quartet structure. For EG4, the beam helicity of each event
was delayed by 8 pulses (2 quartets) and then recorded in the data stream.
This delayed recording helped to avoid cross-talk between the helicity
signal and the electronics or data acquisition system in the hall.
In the data analysis, the delay of the helicity sequence was corrected
to match each event to its true beam helicity state. During this process,
events with inconsistent recording of the helicity sequence were rejected.
A helicity dependence of the integrated beam charge causes a first-order correction to the measured
physics asymmetry, and thus it is desired to keep the charge asymmetry
as small as possible. The beam charge asymmetry was calculated using the
charge measured by the Faraday cup. It was found to be below the percent
level throughout the EG4 experiment, and for most runs had stable values
at or below the level.
Different methods for deriving the beam energy were
used during EG4. The exact energies were 1.054, 1.338, 1.989, 2.260 and 2.999 GeV.
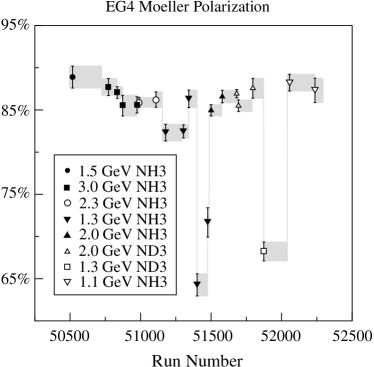
The beam polarization was determined using a Møller
polarimeter Mecking:2003zu in Hall B that measured the asymmetry in
elastic electron-electron scattering.
The results are shown in Fig. 6. Typically, Møller measurements
were performed as soon as a change to the beam configuration was made, and then
intermittently throughout the run period. Therefore, the beam polarization from
each Møller measurement was applied retroactively to runs that immediately follow such configuration
changes, and to runs that follow the Møller measurement until
the next valid measurement is available.
Two additional measurements were done using a Mott
polarimeter Price:1996up ; Price:1997qf ; Price:1998xd ; Steigerwald-MottJLab ,
which is located near the injector where the beam electrons have reached 5 MeV
in energy but before entering the first linac. The Mott polarimeter results
were consistent with those from Møller measurements.
The absolute beam helicity was determined using the -weighted
moment of the beam asymmetry
in the region and comparing with results from previous
experiments Joo:2004mi ; Park:2007tn .
Using the method, it was determined that when the beam IHWP is
inserted, for beam energies
1.3 and 2.3 GeV, the positive DAQ helicity corresponds to the
true negative helicity of the beam electron, while for other
energies the postive DAQ helicity corresponds
to the true positive electron helicity. These results are consistent
with the sign change of the beam polarization measured with the
Møller polarimeter.
Figure 6: Beam polarization from Møller measurements vs. run number for the whole EG4 experiment.
The gray bands represent extrapolations of the beam polarization to the corresponding range of runs
as described in the text.
III.3 Kinematic corrections
Various corrections were applied to the kinematic variables
reconstructed from the detectors thesis:adhikari .
The first is the raster correction: To avoid the electron beam
overheating the target, the beam was rastered in a circular pattern during
EG4 using four magnets located upstream of the target. The values of the
magnet current were recorded in the data stream and were used to calculate
the beam position at the target. The beam position was then used to
re-calculate the vertex position along the beam direction .
After the raster correction was applied, the average value of
the positions of all particles in the same event was taken
as the true vertex position of the event,
see Fig. 7thesis:adhikari . The polar and the azimuthal
angles and
of each particle were also corrected using the new beam and vertex positions.
This procedure took into account the multiple scattering effect
that affected the reconstructed vertex position randomly for each particle.
Figure 7: Electrons’ vertex position before (dashed) and after (solid)
raster corrections, taken with the empty target with the 3 GeV beam. While the
beam line exit window (at cm) can be seen both before and after the
correction, the banjo windows (at and cm), the 4 K heat shield
(14 m aluminum at cm), some target structure at cm,
and several insulating foils (aluminum or aluminumized mylar, between
and cm), become visible only after the raster correction. The vertex
cut, Eq. (22), corresponds to slightly more than in the
target thickness thesis:adhikari .
Because of uncertainties in our knowledge of the drift chamber positions and of the
shape and location of the torus coils, a systematic shift of the particle
momentum was present. To correct for this shift,
the magnitude of the reconstructed particle momentum and the polar angle
were adjusted using sector-dependent parameters. The detailed method
for the momentum correction is described in Ref. CLASNOTE03-005 and results
for this experiment are given in Ref. thesis:adhikari .
For sector 6 equipped with the new Cherenkov counter,
inclusive elastic scattering events were used to optimize the
correction based on the invariant mass position of the elastic
peak. For the other sectors, electron triggers were not available and
hadrons from exclusive events such as ,
, and exclusive events
were used to optimize the corrections.
Finally, the momentum of each particle was corrected for the energy loss
from passage through material enclosed in the target banjo and the target windows.
For electrons a single value MeV/(g/cm2)
was used, while for other particles the Bethe-Bloch equation Beringer:2012
was used to calculate the ionization loss.
Figure 8 shows the effect on the missing mass spectrum
for the channel from kinematic corrections.
Figure 8: Missing mass spectrum for the channel
before (dashed) and after all kinematics corrections (solid), from six
3.0-GeV long top NH3 target runs. After all corrections, the peak center
is closer to the expected value (the neutron mass).
III.4 Elastic scattering for extracting
The product of the beam and the target polarizations is needed to directly
correct the exclusive channel asymmetries.
During EG4, the target polarization was measured by NMR and the beam polarization
by the Møller polarimetry. However, due to reasons described in Sec. II.3,
the NMR measurements had large uncertainties and an alternate method had to be used.
For EG4 we extracted for all beam energies by comparing the double spin
asymmetry of elastic events to the expected value:
(23)
where the measured elastic asymmetry was extracted from data using
(24)
with the elastic dilution factor to account for the effect of events scattered
from unpolarized material in the target.
The raw asymmetry was evaluated as
(25)
where and are the elastic event yield and the
beam charge for the right- (left-)handed beam electrons, respectively.
The expected elastic-scattering asymmetry
was calculated using
(26)
with .
The proton form factor fits from Ref. Bosted:1994tm were used:
(27)
and
(28)
with in GeV/.
Using a more updated fit of the proton form factors than Ref. Bosted:1994tm
would change the asymmetry value by less than 2% relative.
Elastic events were identified using two methods: (1) inclusive elastic events where only the
scattered electron was detected and a cut on the invariant mass near the proton peak
was applied;
(2) exclusive elastic events where both the scattered proton and electron were detected and
cuts were applied to the electron and the proton azimuthal angles: ,
the polar angles of the proton and the electron’s momentum transfer ,
, and the missing energy GeV. The exclusive
analysis had limited statistics and only worked for the 3.0 and the 2.3 GeV data sets. For
lower beam energies, the proton’s scattering angle was typically greater than ,
and was blocked by the polarized target coils. Therefore the value extracted from exclusive
elastic events was only used as a cross-check of the from inclusive events.
The presence of unpolarized material reduces the measured asymmetry, and this effect is
described as a dilution factor in the analysis.
The dilution factor for the inclusive elastic events, , was extracted by
comparing the invariant mass spectrum of the polarized target to that computed for
the unpolarized material.
The beam-charge-normalized spectrum for the unpolarized material in the polarized
target, denoted as ,
was calculated using the spectra of the carbon and the empty target,
the known thickness and density of the carbon and the empty
target, and the polarized target’s packing factor
defined as the absolute length of the polarized material in the polarized target:
(29)
where and are
the yield and the beam charge of the carbon (empty) target data. The scaling factors are
(30)
(31)
where
is the thickness of the carbon foil in the carbon target, is the sum of thicknesses of
other unpolarized material in the target, is the target
banjo length (1.0 cm for the long target and 0.5 cm for the short target),
and are the bound-nucleon fractions of the
carbon target and other unpolarized material in the target, respectively.
The values
of for the various materials are given in Table 2.
The bound-nucleon fraction for the NH3 target takes into account both
the fraction of bound nucleons and a correction for the extra
neutron in the 15N: with
and are the calculated elastic cross sections for the proton and the neutron, respectively.
Table 2: Material used for the EG4 target and their locations in increasing order of ,
in the range cm. The ratios were used in the dilution factor analysis of the
exclusive channel, see Sec.III.6.
location (cm)
Material
Density (g/cm3)
Thickness
-101.9
banjo entrance window, Al
m
varies
target entrance window, kapton
m
varies
NH3
varies
long 12C
mm
varies
liquid 4He
varies
target entrance window kapton
m
-99.6
banjo exit window Al
m
a is the banjo length and is either the packing factor (for NH3 targets) or the carbon
foil thickness (for carbon targets).
After the contribution from the unpolarized material was known, the dilution factor was
calculated using
(32)
where is the total number of events from the NH3 target.
The dilution correction to the elastic asymmetry was then applied using Eq. (24).
In the present analysis, elastic events below (GeV/)2 could not be used because of
electrons scattered elastically from nuclei in the target, such as 4He and nitrogen.
These low bins were rejected in the analysis.
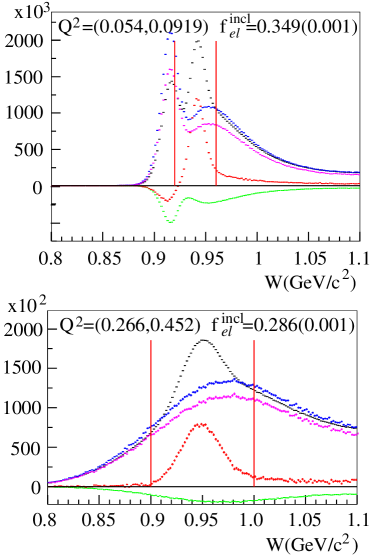
Figure 9 shows the spectrum decomposition for 1.1 and
3.0 GeV inclusive elastic scattering data for two bins. The low
bin (top) is to illustrate the effect of the nuclear elastic scattering and these bins
were rejected from the analysis. The high bin (bottom) shows no such effect
and the extracted are considered reliable.
After the value was extracted for individual bins, the results were checked
to ensure there was no systematic -dependence, which would imply a problem with the
analysis.
The results were then averaged over all bins above (GeV/)2.
This was done for each individual run and the run-by-run,
-averaged results were used to correct the asymmetries from
the exclusive channel.
Figure 10 illustrates the variation of during the experiment.
Figure 9: spectrum for dilution calculation for inclusive elastic analysis.
(Top) 1.1-GeV data on NH3 long bottom target in the (GeV/)2 bin;
(bottom) 3.0-GeV data on NH3 long top target in the (GeV/)2 bin.
For each panel, histograms from the carbon target (blue) and empty target
(green) were scaled using Eqs. (30) and (31)
using a packing factor of 0.75 cm for 1.1 GeV and
0.65 cm for 3.0 GeV, respectively, and their sum gave the estimated contribution
from unpolarized material in the NH3 target (magenta). This unpolarized background
was then subtracted from the NH3 spectrum (black) to estimate the contribution
from polarized protons in the target (red).
The calculated elastic dilution factors are shown for each set of data with their uncertainties
in the brackets.
The cuts
used to select elastic events are shown as the two red vertical lines.
Note that the scaled empty target spectrum (green) is negative, indicating that for the
chosen packing factor we have scaled up the carbon data and then subtracted the extra helium
to reproduce the unpolarized background in NH3. For bins below
0.156 (GeV/)2, the nuclear elastic event contaminates the elastic peak
and the extraction of the dilution
factor is not reliable. For this reason, data with (GeV/)2
were rejected from the elastic analysis.
Figure 10: Magnitude of extracted from inclusive elastic scattering events for
all runs used in the present analysis that were taken on
the polarized NH3 target.
For illustration purposes, results from adjacent
runs that shared the same beam insertable half-wave plate status were combined and
are shown as one data point here.
The error bars shown are statistical uncertainties
determined by the number of available elastic events.
The uncertainty of the packing factor used in the analysis was checked
using the spectrum below (GeV/), because an incorrect normalization
would yield an over- or
an under-subtraction of the yield from unpolarized material.
For the 2.3 and 3.0 GeV data the value of was confirmed by
comparing the value extracted from the inclusive to that from the exclusive elastic events.
The packing factor and its uncertainty also affect the dilution analysis
of the exclusive channel, to be described in the next sections, thus the
final results on for each combination
of beam energy and polarized target type are shown together
with the exclusive channel dilution results in Table 3.
The relatively larger error bar for the 1.1 GeV NH3 long bottom target is
because most of the data were affected by the nuclear elastic scattering and
there are very limited bins available for the elastic analysis.
In addition to checking the spectrum and the comparison between inclusive and exclusive
elastic events, the channel was also used to check because
these events come primarily from the unpolarized neutrons of the nitrogen
in the target and thus should have a dilution factor of zero.
The events were analyzed for all beam energies
and it was found the dilution factors calculated using the values
in Table 3 were indeed consistent with zero.
As a last check, the run-by-run values of were compared with the
numerous target material and configuration changes during the
experiment, and were found to be consistent with the physical changes of the target.
III.5 Extraction of exclusive channel asymmetries
To extract the exclusive channel asymmetries, the channel events
were divided into four-dimensional bins in , , , and
and then the asymmetries were extracted from the counts in each bin.
The event counts for the four combinations of
beam helicities and target polarization can be written, based on Eq. (5), as
(33)
(34)
(35)
(36)
where the arrows in the subscripts of are for the beam helicities
( or ) and the target spin directions ( or ), respectively,
with and being positive helicity or parallel to the beam direction
and and being negative helicity or anti-parallel to the beam direction.
The parameters and are the statistically-averaged target or beam
polarizations when the target spin is aligned and anti-aligned to the beamline,
respectively. The dilution factor for the exclusive channel
is defined
as the fractional yield from the polarized proton in the NH3 target, which
effectively changes the target polarization.
The four parameters , relating event counts to cross sections, are
related to
the total beam charge, target thickness, spectrometer acceptance, and detector
efficiencies for each configuration. For stable running periods with no significant
change in the target cell, the spectrometer setting and the detector status, the
factor is strictly proportional to the accumulated beam charge in each setting.
From Eqs. (33)–(36), one can form the asymmetries as:
(37)
(38)
(39)
III.6 Dilution factor for the exclusive channel
In contrast to the dilution for inclusive analysis that has only
dependence (Sec. III.4), the dilution for
exclusive pion production could vary with all four kinematic variables , ,
and thesis:DeVita . To evaluate
the dilution factor for all four-dimensional bins of (, , , ),
the yield from the unpolarized material inside the polarized NH3 target was constructed
using the missing mass spectra from the carbon and the empty targets. Scaling factors
for the carbon and empty target data were calculated
following a prescription similar to Eqs. (29)–(31), but
with the bound-nucleon fraction replaced by the ratio (Table 2)
for the [() for the ] channel.
For NH3 one should use to account for only
unpolarized protons. We obtain:
(40)
where
(41)
(42)
Similar to elastic analysis, the value of from
Eq. (42) could be either positive or negative depending on the
input packing factor.
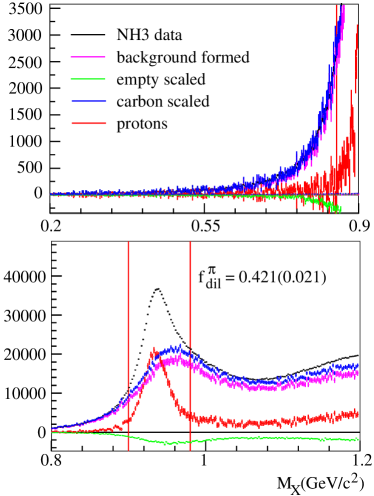
Figure 11 shows the dilution factor evaluation for the
3.0 GeV data using the NH3 long top target.
Figure 11: Missing mass spectrum for deriving the dilution factor for the
channel. (Top) Missing mass below the neutron mass peak;
(bottom) missing mass around the neutron mass peak. The data shown are for the 3.0 GeV run period
using the NH3 long top target.
Here, the spectrum for the nuclear material (magenta) in the polarized NH3 target
was constructed using the spectra for the carbon target (blue), the empty target (green),
with an input packing factor cm.
The nuclear contribution was then subtracted from the NH3 target spectrum (black)
to give the polarized-proton spectrum (red). The dilution factor was evaluated using the
region around the neutron peak and is shown in the bottom panel with the uncertainty in the bracket.
The histogram and the dilution uncertainties include both statistical uncertainties and the
uncertainty in the scaling or packing factors.
Note that the empty target (green) spectrum is negative, indicating
we have scaled up the carbon data and then subtracted the extra helium (empty target)
to reproduce the unpolarized background in NH3.
Results for the dilution factor is shown in the bottom plot.
The cuts GeV/ used in the dilution and the asymmetry analysis are
shown by the two red vertical lines.
From Eqs. (38) and (39) one can see that the
uncertainties in and should be evaluated at the same time
because both depend on the packing factor.
Table 3 shows all and dilution results for the packing factor
range used in the elastic analysis. For each setting of beam energy and
target, we varied the packing factor by one standard deviation and evaluated
and . We used
the observed difference in the product as the uncertainty from
the packing factor, labeled as . For the total uncertainty
(total), we added the following terms
in quadrature:
(1) statistical uncertainty of inclusive elastic events used in the analysis;
(2) statistical uncertainty of the carbon and empty target counts used to calculate
the dilution factor for inclusive elastic events;
(3) statistical
uncertainty in the exclusive channel from limited statistics of carbon and
empty target data (stat.); and (4) the observed variation in
when the input packing factor was varied within its uncertainty.
The resulting total uncertainties on were used for the evalulation
of the uncertainty of the double-spin asymmetry .
For the target asymmetry , the uncertainty was evaluated by combining the
uncertainty of and the uncertainty of the Møller measurements
on the beam polarization. The uncertainty from the polarizations and the dilution is the largest
systematic uncertainty of the present analysis.
Table 3: Dilution factor
and the product for the exclusive channel.
The results extracted from
inclusive elastic scattering, described in Sec. III.4, and their
uncertainties are also shown. For , the three errors are from
statistical uncertainty of the elastic events, the statistical uncertainty of the
carbon and empty target counts used to calculate
the dilution factor for inclusive elastic analysis,
and the uncertainty of the packing factor.
values from Møller and NMR measurements are shown for comparison,
although the NMR measurements are unreliable as decribed in Sec. II.3.
The products are used to correct
the exclusive channel asymmetries.
The total uncertainties in include uncertainties of
, statistical uncertainties of , and the uncertainties
from the packing factor (p.f.), all added
in quadrature. These total uncertainties will be used as systematic uncertainties on the
extracted exclusive channel asymmetries.
Target
p.f.
Møller
(stat.)(p.f.)
(GeV)
(NH3)
(cm)
NMR
(total)
3.0
top
2.3
top
short
2.0
top
bottom
1.3
top
bottom
short
1.1
bottom
The uncertainty in the input packing factor of Table 3 was
checked using not only the spectrum of elastic events (as described in
Sec. III.4), but also the dilution factor of the
channel analyzed using a similar prescription as
Eqs. (40)–(42). The
dilution factor of the channel should be consistent with zero
in all kinematic bins.
Overall, the lower bound in the packing factor was cross-checked between the
dilution result and the elastic spectrum, and
the upper bound in the packing factor was determined always by the
elastic spectrum.
The kinematics dependence of the dilution factor on , , and the pion center-of-mass
angles and have been studied, and multi-dimensional fits of the
dependence were performed. The limited statistics
of the carbon and the empty target data prevented fitting the
dependence simultaneously. Instead, two
bi-dimensional fits were used, one for the dependence and one for the
dependence, with the following ad hoc parametrizations:
(43)
where is in GeV and
(44)
The resulting two fits were then multiplied to give the overall -dimensional
fit for .
To check the validity of the fit, the results from
were integrated over three of the four
variables, and then compared with the dilution extracted directly from data
binned in the fourth variable. This comparison is shown in
Fig. 12. One can see that the dilution
factors obtained from this method agree with data very well. The -dimensional
fit was used to correct the
asymmetries and for the specific bin using
Eqs. (38) and (39).
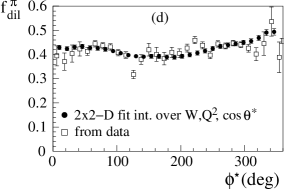
Figure 12: Dependence of dilution on: (a) , (b) , (c) , and (d) ,
for the 3.0 GeV NH3 long top target, channel, obtained directly
from the data (open squares) and from multiplying the two 2D fits of
Eqs. (43) and (44) then integrating over three of the four
variables (solid circles). The error bars for the dilution extracted from data are
statistical only.
III.7 Effect of nitrogen polarization on the asymmetry
The 15N in the NH3 target is polarizable and can affect the measured asymmetry.
In this section we estimate this effect and show that it is negligible. Therefore
no correction was made to the extracted exclusive channel asymmetries.
The nitrogen polarization in 15NH3 can be estimated based on the equal spin
temperature (EST) prediction Crabb:1995xi :
(45)
where and are the magnetic moments of the 15N and the
proton, respectively, is the magnetic field of the target, is the Boltzmann
constant and is the spin
temperature that describes the Boltzmann distribution of spins inside the target.
The EST prediction was demonstrated to apply to the 15N and H of the ammonia molecule
by several experiments starting with the Spin Muon Collaboration Adeva:1997kz .
The SLAC E143 collaboration performed an empirical fit and showed Abe:1998wq :
(46)
which gives when and when .
The 15N polarization is carried by the unpaired proton and its effect relative
to the three free protons in NH3 is
(47)
where the additional factor of comes from the wavefunction of the unpaired
proton in the 15N RondonAramayo:1999da .
The effect on the asymmetry from the polarized proton in the 15N is thus
at the level,
and is negligible compared to the statistical uncertainty
of the asymmetry and the systematic uncertainty from the polarizations and the dilution
factor.
III.8 Acceptance corrections
When studying how the asymmetries vary with very small bins in all
four kinematic variables – the electron’s , and the pion’s center-of-mass
angles and – the effect of the detector acceptance and efficiency
in principle cancel and therefore do not affect the interpretation of the asymmetry results.
The effect of acceptance only becomes relevant when integration of the asymmetry over
a subset of these four variables is necessary, which is the case for all results presented
in Sec. IV.
For results presented in Sec. IV, we evaluated the acceptance of each
bin based on acceptance cuts for both electrons and pions. The acceptance correction was then applied
on an event-by-event basis: instead of using the measured counts ,
where each event counts as , we first divided by the acceptance of that particular
event, then the sum was taken and used as in the formula from
Sec. III.5, Eqs. (37)-(39).
The asymmetries extracted this way were integrated over certain kinematic ranges and
compared directly with theoretical predictions.
Zero-acceptance bins could not be corrected this way when integrating the data. When
integrating the theoretical calculations, we excluded bins where there were no data,
and thus removed the zero-acceptance bins from the theory curves as well.
III.9 Radiative corrections
Radiative corrections were calculated for both and using the code EXCLURAD EXCLURAD
and the MAID2007 model Drechsel:2007if . It was found that overall the correction is fairly small and typically no larger
than 0.03. Considering the size of the statistical uncertainty of the
measurement, radiative corrections were not applied to the asymmetries, but
rather are quoted as a systematic uncertainty of throughout the
accessed kinematics.
III.10 Summary of all systematic uncertainties
The systematic uncertainty of the exclusive channel is dominated by
that from the product , shown in Table 3.
The uncertainty of takes into account the
uncertainties in the target packing factor, as well as the thickness and density of
various materials in the target. Other non-neglible systematic uncertainties include a
relative due to the 15N in NH3 and a due to radiative
corrections.
Adding these uncertainties in quadrature, we arrive at
Table 4 for our asymmetry results.
For the asymmetry , one does not need to normalize by . We relied on the
elastic results and combined in quadrature their uncertainties with the
uncertainty in the Møller polarization to obtain the
uncertainty on alone.
Table 4: Summary of systematic uncertainties from the target and beam polarizations and the
dilution factor for different beam and target combinations. The relative uncertainty
from 15N and the absolute uncertainty from radiative corrections must
be added in quadrature to the values here to obtain the total systematic uncertainty.
Target
(GeV)
(NH3)
(syst)
(syst)
3.0
top
2.3
top
short
2.0
top
1.3
top
bottom
1.1
bottom
IV Asymmetry Results
Results for the target asymmetry and the double-spin asymmetry
are available on a four-dimensional grid of , , , and
. There are bins logarithmically spaced between
and (GeV/)2, bins between and GeV,
bins between and ,
and 20 bins between and . This binning
scheme is referred to as “asymmetry bins”.
To allow a meaningful comparison with theoretical calculations, we
integrated the data over 3 bins, 8 bins, 5 bins and
5 bins. These will be referred to as “combined bins”
hereafter. The resulting combined bins are ,
and GeV, allowing an examination of the first, the second,
and the third nucleon resonance regions, respectively.
The method of integrating the data for the combined bins
was built upon the acceptance correction described in Sec. III.8:
To correct for the acceptance, each event in the asymmetry bin was
divided by the acceptance of that particular event, then summed to be used as
in Eqs. (37)–(39).
To integrate from asymmetry bins into combined bins, these acceptance-corrected
from each asymmetry bin was summed, and used
as the combined to evaluate the asymmetries for the combined bin.
Using this method, the integrated asymmetries are direct reflections of the
ratio of the physical cross sections integrated over the combined bin except
for regions that had zero acceptance.
To compare with theory, we calculated the cross sections
for each asymmetry bin,
then summed the calculated cross sections over combined bins except for asymmetry bins
where there was no data (zero acceptance). The ratio of the summed cross
sections [Eqs. (20) and (21)] was taken
as the calculated asymmetry for the combined bin.
In the following we will present some representative results.
IV.1 Results on target asymmetry
Figure 13 shows, in increasing ranges, the results as
a function of for three bins , ,
, and integrated over .
Results for the and have less statistics
and are not shown. Results for the bin have comparable
statistics as Fig. 13 but are not shown here for brevity.
In general, we see that the agreement between these results and the four calculations,
MAID2007 (solid) Drechsel:2007if ,
JANR (dashed) Aznauryan:2009mx ,
SAID (dash-dotted) Arndt:2009nv ,
and DMT2001 (dotted) Kamalov:1999hs ,
is very good in the (GeV/) region, but for the region
(GeV/), all four calculations differ from each other and
none agrees well with data, although the MAID2007 curve (solid)
approximates the data better than the other three.
To study these results further for different regions,
we show in Fig. 14 results as
a function of for three ranges and between and (GeV/)2.
Results for lower ranges, down to (GeV/)2, are available from the 1.1 GeV
data but only cover (GeV/) and thus are not presented here.
From Fig. 14, for the lower two bins and
GeV, the four calculations provide similar predictions and all agree with
data. But for the GeV region, only the MAID2007 (solid) and the DMT2001 (dotted)
calculations provide the correct sign, and MAID2007 approximates the data better than the other three
although it does not agree with data perfectly.
It is clear that all four calculations can be improved in
the GeV region throughout the range shown.
IV.2 Results on the double-spin asymmetry
Figure 15 shows the double-spin asymmetry results as
a function of for eight bins, three bins, and integrated over
.
These results are compared with four calculations: MAID2007 (solid) Drechsel:2007if ,
JANR (dashed) Aznauryan:2009mx ,
SAID (dash-dotted) Arndt:2009nv ,
and DMT2001 (dotted) Kamalov:1999hs .
Note that our definiton for has the opposite sign
from theories; see Sec. I.1.
Results for the and bins have less statistics
and are not shown. Results for the bin have comparable
statistics as Fig. 13 but are not shown here for brevity.
Overall the data agree very well with all four calculations.
For all bins, the sign of in the region of the and the
is positive in the high , but start to cross or approach zero in the lower
bin, within (GeV/)2
for and within (GeV/)2 for , respectively.
This is in agreement with the
suggestion in Sec. I that turns to positive at
high values from helicity conservation, but may become negative near the real photon point.
V Summary
We present here data on the target and double-spin asymmetry and
on the channel using data taken on a polarized NH3 target,
from the EG4 experiment using CLAS in Hall B of Jefferson Lab. These data
have reached a low region from to (GeV/)2 that was not
accessed previously. They suggest a transition in from positive at higher
to negative values below (GeV/)2 in the region GeV,
in agreement with both previous data from CLAS
(high ) EG1b-Pierce-thesis ; Bosted:2016leu and the real photon data at .
Our results show that while all model calculations agree well with ,
in general there is room for improvements for in the high-mass
resonance region GeV where predications from various models
differ significantly.
Acknowledgements.
The authors gratefully acknowledge the work of Jefferson Lab staff
in the Accelerator and Physics Divisions that
resulted in the successful completion of the experiment. This work was supported by:
the U.S. Department of Energy (DOE),
the U.S. National Science Foundation,
the U.S. Jeffress Memorial Trust;
the United Kingdom’s Science and Technology Facilities Council (STFC)
under grant numbers ST/L005719/1 and GR/T08708/01; the Italian Istituto Nazionale di Fisica Nucleare;
the French Institut National de Physique Nucléaire et de Physique des Particules,
the French Centre National de la Recherche Scientifique;
and the National Research Foundation of Korea.
This material is based upon work supported by the U.S. Department of Energy, Office of Science, Office of Nuclear Physics under contract DE-AC05-06OR23177.
Figure 13: Results on the target spin symmetries for the channel
as a function of the invariant mass in GeV, integrated over ,
in increasing ranges and three 60∘ bins.
From top to bottom the bins are
and
(1.1 GeV NH3 long bottom target),
and
(1.3 GeV NH3 long top target),
(2.0 GeV NH3 long top target),
,
, and
(GeV/)2 (3.0 GeV NH3 long top target).
From left to right the bins are
,
and
.
In each panel, the horizontal scale is from 1.1 to 2 GeV in and the vertical scale is
from to .
Data are compared to four calculations:
MAID2007 (solid) Drechsel:2007if , JANR (dashed) Aznauryan:2009mx ,
SAID (dash-dotted) Arndt:2009nv ,
and DMT2001 (dotted) Kamalov:1999hs .
Figure 14: Results on for the channel
as a function of azimuthal angle , integrated over ,
for six bins and three bins.
From top to bottom the six bins are:
[1.3 NH3 long target for and GeV,
and 2.0 NH3 long top target for GeV];
and
(GeV/)2 (2.0 GeV NH3 long top target);
,
and
(GeV/)2 (3.0 GeV NH3 long top target);
from left to right the bins are:
,
,
GeV.
In each panel, the horizontal scale is from 0 to in and the vertical scale is
from to .
Data are compared to four calculations:
MAID2007 (solid) Drechsel:2007if , JANR (dashed) Aznauryan:2009mx ,
SAID (dash-dotted) Arndt:2009nv ,
and DMT2001 (dotted) Kamalov:1999hs .
Figure 15: Results on the double-spin symmetries for the channel
as a function of the invariant mass in GeV, integrated over ,
for increasing ranges and three 60∘ bins.
From top to bottom the bins are
and (1.1 GeV NH3 long bottom target),
and
(1.3 GeV NH3 long top target),
(2.0 GeV NH3 long top target),
,
, and
(GeV/)2 (3.0 GeV NH3 long top target).
From left to right the bins are
,
and
.
In each panel, the horizontal scale is from 1.1 to 2 GeV in and the vertical scale is
from to .
Data are compared to four calculations:
MAID2007 (solid) Drechsel:2007if , JANR (dashed) Aznauryan:2009mx ,
SAID (dash-dotted) Arndt:2009nv ,
and DMT2001 (dotted) Kamalov:1999hs .
References
(1)
D. J. Gross and F. Wilczek,
Phys. Rev. Lett. 30, 1343 (1973).
doi:10.1103/PhysRevLett.30.1343
(2)
H. D. Politzer,
Phys. Rev. Lett. 30, 1346 (1973).
doi:10.1103/PhysRevLett.30.1346
(3)
V. D. Burkert and T. S. H. Lee,
Int. J. Mod. Phys. E 13, 1035 (2004)
doi:10.1142/S0218301304002545
[nucl-ex/0407020].
(4)
I. G. Aznauryan and V. D. Burkert,
Prog. Part. Nucl. Phys. 67, 1 (2012).
doi:10.1016/j.ppnp.2011.08.001
[arXiv:1109.1720 [hep-ph]].
(5)
C. Hoelbling,
Acta Phys. Polon. B 45, no. 12, 2143 (2014).
doi:10.5506/APhysPolB.45.2143
[arXiv:1410.3403 [hep-lat]].
(6)
A. Ukawa,
J. Statist. Phys. 160, 1081 (2015).
doi:10.1007/s10955-015-1197-x
[arXiv:1501.04215 [hep-lat]].
(7)
V. Bernard, N. Kaiser, T. S. H. Lee and U. G. Meissner,
Phys. Rept. 246, 315 (1994)
doi:10.1016/0370-1573(94)90088-4
[hep-ph/9310329].
(8)
V. Bernard, N. Kaiser and U. G. Meissner,
Nucl. Phys. A 607, 379 (1996)
Erratum: [Nucl. Phys. A 633, 695 (1998)]
doi:10.1016/0375-9474(96)00184-4, 10.1016/S0375-9474(98)00189-4
[hep-ph/9601267].
(9)
X. Zheng et al. [Jefferson Lab Hall A Collaboration],
Phys. Rev. Lett. 92, 012004 (2004)
doi:10.1103/PhysRevLett.92.012004
[nucl-ex/0308011].
(10)
X. Zheng et al. [Jefferson Lab Hall A Collaboration],
Phys. Rev. C 70, 065207 (2004).
doi:10.1103/PhysRevC.70.065207
[nucl-ex/0405006].
(11)
M. Warns, W. Pfeil and H. Rollnik,
Phys. Rev. D 42, 2215 (1990).
doi:10.1103/PhysRevD.42.2215
(12)
V. D. Burkert, R. De Vita, M. Battaglieri, M. Ripani and V. Mokeev,
Phys. Rev. C 67, 035204 (2003)
doi:10.1103/PhysRevC.67.035204
[hep-ph/0212108].
(13)
D. Drechsel, S. S. Kamalov and L. Tiator,
Eur. Phys. J. A 34, 69 (2007)
doi:10.1140/epja/i2007-10490-6
[arXiv:0710.0306 [nucl-th]].
(14)
I. G. Aznauryan et al. [CLAS Collaboration],
Phys. Rev. C 80, 055203 (2009)
doi:10.1103/PhysRevC.80.055203
[arXiv:0909.2349 [nucl-ex]].
(15)
R. A. Arndt, W. J. Briscoe, M. W. Paris, I. I. Strakovsky and R. L. Workman,
Chin. Phys. C 33, 1063 (2009)
doi:10.1088/1674-1137/33/12/004
[arXiv:0906.3709 [nucl-th]].
(16)
S. S. Kamalov and S. N. Yang,
Phys. Rev. Lett. 83, 4494 (1999)
doi:10.1103/PhysRevLett.83.4494
[nucl-th/9904072].
(17)
R. De Vita et al. [CLAS Collaboration],
Phys. Rev. Lett. 88, 082001 (2002)
Erratum: [Phys. Rev. Lett. 88, 189903 (2002)]
doi:10.1103/PhysRevLett.88.082001
[hep-ex/0111074].
(18)
R. De Vita [CLAS Collaboration],
Nucl. Phys. A 699, 128 (2002).
doi:10.1016/S0375-9474(01)01479-8
(19)
A. S. Biselli et al. [CLAS Collaboration],
Phys. Rev. C 68, 035202 (2003)
doi:10.1103/PhysRevC.68.035202
[nucl-ex/0307004].
(20)
J. Pierce, Double Spin Asymmetry in Exclusive Electroproduction with CLAS,
Ph.D. thesis, University of Virginia (2008).
(21)
S. Careccia, Single and Double Spin Asymmetries for Electroproduction
from the Deuteron in the Resonance Region, Ph.D. thesis, Old Dominion University (2012).
(22)
P. E. Bosted et al. [CLAS Collaboration],
arXiv:1604.04350 [nucl-ex].
(23)
Particle Data Group, D.E. Groom et al.,
Eur. Phys. J. C 15, 1, (2000).
(24)
S. Capstick,
Phys. Rev. D 46, 2864 (1992).
doi:10.1103/PhysRevD.46.2864
(25)
M. Gottschall et al. [CBELSA/TAPS Collaboration],
Phys. Rev. Lett. 112, no. 1, 012003 (2014)
doi:10.1103/PhysRevLett.112.012003
[arXiv:1312.2187 [nucl-ex]].
(26)
H. Iwamoto [CLAS Collaboration],
AIP Conf. Proc. 1432, 275 (2012).
doi:10.1063/1.3701229
(27)
D. Schott et al. [CLAS Collaboration],
AIP Conf. Proc. 1735, 030016 (2016).
doi:10.1063/1.4949399
[arXiv:1512.03046 [nucl-ex]].
(28)
JLab CLAS Experiment 04-102, D. I. Sober, M. Khandaker, D. G. Crabb,
Helicity Structure of Pion Photoproduction.
(29)
JLab CLAS Experiment 03-006, M. Battaglieri, R. De Vita, A. Deur and M. Ripani,
The GDH Sum Rule with nearly real photons and the proton structure
function at low momentum transfer.
(30)
JLab Proposal 05-111, A. Deur, G. Dodge and K. Slifer, Measurement of
the Gerasimov-Drell-Hearn Integral at low on the Neutron and Deuteron.
(31)
S. B. Gerasimov,
Sov. J. Nucl. Phys. 2, 430 (1966)
[Yad. Fiz. 2, 598 (1965)].
(32)
S. D. Drell and A. C. Hearn,
Phys. Rev. Lett. 16, 908 (1966).
doi:10.1103/PhysRevLett.16.908
(33)
M. Anselmino, B. L. Ioffe and E. Leader,
Sov. J. Nucl. Phys. 49, 136 (1989)
[Yad. Fiz. 49, 214 (1989)].
(34)
X. Ji, C. W. Kao and J. Osborne,
Nucl. Phys. A 684, 363 (2001).
doi:10.1016/S0375-9474(01)00383-9
(35)
Hyekoo Kang, Measurement of the proton spin structure functions at very
low momentum transfer, Seoul National University (2015).
(36)
B. A. Mecking et al. [CLAS Collaboration],
Nucl. Instrum. Meth. A 503, 513 (2003).
doi:10.1016/S0168-9002(03)01001-5
(37)
G. Adams et al.,
Nucl. Instrum. Meth. A 465, 414 (2001).
doi:10.1016/S0168-9002(00)01313-9
(38)
E. Cisbani et al.,
Nucl. Instrum. Meth. A 496, 305 (2003).
doi:10.1016/S0168-9002(02)01747-3
(39)
D. G. Crabb and D. B. Day,
Nucl. Instrum. Meth. A 356, 9 (1995).
doi:10.1016/0168-9002(94)01436-1
(40)
C. D. Keith et al.,
Nucl. Instrum. Meth. A 501, 327 (2003).
doi:10.1016/S0168-9002(03)00429-7
(41)
J. S. Price et al., 5-MeV Mott polarimeter for rapid precise electron beam polarization measurements,
in “High-energy spin physics. Proceedings, 12th International Symposium, SPIN 96, Amsterdam, Netherlands, September 10-14, 1996,” Singapore, Singapore: World Scientific (1997),
p.727. doi:10.1016/S0168-9002(02)01747-3
(42)
J. S. Price et al., 5-MeV Mott polarimeter development at Jefferson Lab,
in “Polarized gas targets and polarized beams. Proceedings, 7th International Workshop, Urbana, USA, August 18-22, 1997,” p.446.
(43)
J. S. Price et al., Recent measurements with the Jefferson Lab 5-MeV Mott polarimeter,
in “High-energy spin physics. Proceedings, 13th International Symposium, SPIN’98, Protvino, Russia, September 8-12, 1998,”
Singapore, Singapore: World Scientific (1999), p.554.
(44)
M. Steigerwald,
MeV Mott polarimetry at Jefferson Lab,
http://www.jlab.org/accel/inj_group/mott/mott.pdf
(45)
K. Joo et al. [CLAS Collaboration],
Phys. Rev. C 70, 042201 (2004).
doi:10.1103/PhysRevC.70.042201
[nucl-ex/0407013].
(46)
K. Park et al. [CLAS Collaboration],
Phys. Rev. C 77, 015208 (2008).
doi:10.1103/PhysRevC.77.015208
[arXiv:0709.1946 [nucl-ex]].
(47)
K. Adhikari, Measurement of the Spin Structure Function of
the Deuteron and Its Moments at Low , Ph.D. thesis, Old Dominion University (2013).
(48)
CLAS-NOTE 2003-005, A. Klimenko and S. Kuhn, Momentum Corrections for E6.
http://www.jlab.org/Hall-B/notes/clas_notes03/03-005.pdf
(49)
J. Beringer et al. (Particle Data Group), Phys. Rev. D86, 010001 (2012).
(50)
P. E. Bosted,
Phys. Rev. C 51, 409 (1995).
doi:10.1103/PhysRevC.51.409
(51)
R. De Vita, Measurement of the Double Spin Asymmetry in
Electroproduction with CLAS, Ph.D. Thesis, Università di Genova (2000).
(52)
B. Adeva et al. [Spin Muon Collaboration],
Nucl. Instrum. Meth. A 419, 60 (1998).
doi:10.1016/S0168-9002(98)00916-4
(53)
K. Abe et al. [E143 Collaboration],
Phys. Rev. D 58, 112003 (1998).
doi:10.1103/PhysRevD.58.112003
[hep-ph/9802357].
(54)
O. A. Rondon-Aramayo,
Phys. Rev. C 60, 035201 (1999).
doi:10.1103/PhysRevC.60.035201
(55)
A. Afanasev, I. Akushevich, V. Burkert and K. Joo,
Phys. Rev. D 66, 074004 (2002)
doi:10.1103/PhysRevD.66.074004
[hep-ph/0208183].
J. Gilfoyle et al, URL: http://www.richmond.edu/ggilfoyl/research/RC/wvo.html.