e-mail: ]ivlev@mpe.mpg.de
Ionization and dust charging in protoplanetary disks
Abstract
Ionization-recombination balance in dense interstellar and circumstellar environments is a key factor for a variety of important physical processes, such as chemical reactions, dust charging and coagulation, coupling of the gas with magnetic field and development of instabilities in protoplanetary disks. We determine a critical gas density above which the recombination of electrons and ions on the grain surface dominates over the gas-phase recombination. For this regime, we present a self-consistent analytical model which allows us to exactly calculate abundances of charged species in dusty gas, without making assumptions on the grain charge distribution. To demonstrate the importance of the proposed approach, we check whether the conventional approximation of low grain charges is valid for typical protoplanetary disks, and discuss the implications for dust coagulation and development of the “dead zone” in the disk. The presented model is applicable for arbitrary grain-size distributions and, for given dust properties and conditions of the disk, has only one free parameter – the effective mass of the ions, shown to have a low effect on results. The model can be easily included in numerical simulations following the dust evolution in dense molecular clouds and protoplanetary disks.
Subject headings:
ISM: dust – protoplanetary disks – ISM: clouds – ISM: cosmic rays – astrochemistryI. Introduction
An accurate calculation of ionization-recombination balance in dense protoplanetary conditions is essential for understanding various fundamental problems, such as coupling of the gas with magnetic field (Li et al., 2014), accretion processes (Turner et al., 2014), chemistry (Semenov et al., 2004; Larsson et al., 2012) and dust evolution (Okuzumi et al., 2011b; Akimkin, 2015). Both the ionization and recombination processes can arise from several sources. While the treatment of ionization, despite the variety of ionization sources, could be reduced to a single (total) ionization rate, the description of recombination is less straightforward. At sufficiently high densities, the dominant sink of free electrons and ions are dust grains, and the recombination rate non-trivially depends on properties of the grains. Furthermore, collection of electrons and ions leads to non-zero grain charges, which effectively changes the grain-grain (Okuzumi, 2009) and ion-grain (Weingartner & Draine, 1999) interactions as well as the grain dynamics.
Depletion of electrons caused by the presence of dust grains significantly reduces the degree of ionization in dense interstellar conditions (Umebayashi, 1983; Umebayashi & Nakano, 1990; Nishi et al., 1991): In comparison with dust-free gas, the electron-to-ion ratio may drop by as much as a square root of the effective ion-to-electron mass ratio (which is a factor of 74 for a plasma with dominant H ions, or 231 for N2H+/HCO+ ions). As the ionization controls the coupling of the gas to the magnetic field, and hence the development of the magnetorotational instability (MRI, e.g., Velikhov, 1959; Balbus & Hawley, 1991), dust is the essential ingredient for any MRI model. It has been shown that the grain size critically affects the size of a disk’s “dead zone” (Sano et al., 2000; Salmeron & Wardle, 2008; Bai, 2011a, b; Dudorov & Khaibrakhmanov, 2014). Nevertheless, analysis of MRI has been usually carried out assuming that properties of dust are fixed.
In dense protoplanetary environments, the coagulation of sub-m interstellar dust particles becomes an important process. The planet formation in protoplanetary disks requires the dust to form larger and larger aggregates, until gravitational forces become dominant (e.g., Testi et al., 2014, and references therein). There is a clear evidence of grain growth to millimeter and centimeter sizes within protoplanetary disks (e.g., Pérez et al., 2015; van der Marel et al., 2015). However, significant difficulties are found during this coagulation process, such as bouncing barriers (e.g., Zsom et al., 2010) and particle fragmentation (Birnstiel et al., 2012) after initial grain compaction and growth. Many theoretical and laboratory studies have greatly advanced our understanding of grain growth and planetesimal formation in recent years (Dominik et al., 2007; Johansen et al., 2014, and references therein), with particular attention dedicated to dust traps, now detected with ALMA toward protoplanetary disks (van der Marel et al., 2013, 2015; Pinilla et al., 2015; Flock et al., 2015; Zhang et al., 2016; Ruge et al., 2016). In dust traps, particles are expected to grow more easily due to the locally enhanced dust-to-gas mass ratio (Booth & Clarke, 2016; Surville et al., 2016), although the details of this coagulation process are far from being understood, considering the largely unknown dust properties.
As has been already pointed out, the ionization does not only determine dynamical and chemical processes occurring in protoplanetary disks, but also leads to the dust charging and thus affects the coagulation. Collection of electrons and ions results in (on average) negative grain charges due to higher electron velocities. Recently, it has been shown that the coagulation of larger aggregates in protoplanetary disks can be inhibited due to growing Coulomb repulsion between them – the resulting electrostatic potential barrier is roughly proportional to the aggregate size (Okuzumi, 2009; Okuzumi et al., 2011a, b). Along with the plasma charging, other charging mechanisms can operate in protoplanetary disks. In Akimkin (2015) the photoelectric emission from grains, induced by stellar radiation and leading to their positive charging, was considered as a mechanism to overcome the electrostatic barrier in upper disk regions. A similar mechanism – photoelectric charging due to H2 fluorescence induced by cosmic rays (CRs) – operates in much deeper regions at the disk periphery (Ivlev et al., 2015). However, both mechanisms become negligible in dense regions of the disk. We notice that the (still poorly investigated) effect of charging on the dust evolution has recently received increased interest (Carballido et al., 2016).
It is noteworthy to mention that the coagulation in protoplanetary disks is accompanied by the formation of porous aggregates characterized by an open, fluffy structure (e.g., Dominik et al., 2007; Okuzumi et al., 2009). The porosity has been pointed out to have a strong impact on the ionization in protoplanetary disks (Okuzumi, 2009; Dzyurkevich et al., 2013; Mori & Okuzumi, 2016). However, while the growth of uncharged aggregates is well studied, an accurate description of their charging as well as of the charging feedback on their further growth poses a serious problem. One of the fundamental difficulties is that, unlike compact spherical grains (whose charging is described using the Orbital Motion Limited (OML) approximation, e.g., Whipple, 1981; Fortov et al., 2005), no accurate approximation is known for the electron and ion collection by irregular fluffy aggregates. Given these difficulties, here we leave completely aside in-depth discussion of the porosity effects.
In this paper, we present an analytical model which becomes exact in sufficiently dense astrophysical environments and allows us to self-consistently calculate densities of the charged species, in particular – to obtain the dust charges for arbitrary grain-size distributions. Unlike other known approaches (Ilgner & Nelson, 2006; Okuzumi, 2009; Fujii et al., 2011; Dzyurkevich et al., 2013; Mori & Okuzumi, 2016), our model does not make assumptions on the form of the charge distribution, and yields closed analytical expressions for important limiting cases. The latter enables convenient analysis of results in a general form, in terms of a few dimensionless numbers.
The presented model has only one free parameter (the effective mass of the ions, which we show to have a low effect on results), and can be easily included in numerical simulations following the dust evolution in dense molecular clouds and protoplanetary disks. We employ the model to verify whether the broadly used approximation of low grain charges is valid for typical protoplanetary disks. Furthermore, we identify a “dust-dust” plasma regime, where the grain charge distribution becomes quasi-symmetric with respect to uncharged state. This leads to removal of the repulsive electrostatic barrier and opens a “coagulation window” for large aggregates, operating in the inner dense region of protoplanetary disks. Also, we discuss the importance of self-consistent analysis of the ionization and the grain evolution, as there processes are mutually coupled via several mechanisms operating in the disks.
The paper is organized as follows. In Section II we consider the overall ionization-recombination balance and introduce a recombination threshold – the gas density above which the electron-ion recombination is dominated by the processes on the dust surface. In Section III we present the grain charge distribution determined by collection of electrons and ions, and point out limiting cases of “big” and “small” grains. In Section IV we derive the governing equations for the dust-phase recombination regime, complemented with the grain charge distribution, which allow us to calculate densities of the charged species in a general form; to reveal generic properties of the solution, we consider “monodisperse” dust (grains of the same size) and investigate separately the big- and small-grain limits. The effect of the grain-size distribution is studied in Section V. We discuss implications of the proposed model for protoplanetary disks in Section VI, and summarize the results in Section VII.
II. Dust-phase recombination regime
The ionization-recombination balance for electrons is generally governed by the following equation:
| (1) |
where is the total ionization rate111The magnitude of is determined by a combination of different ionization mechanisms (due to CRs, X-rays, UV, and radionuclides) whose relative importance varies across the disk (e.g., Armitage, 2015). of gas with the number density . The recombination is represented by the two terms. The first one, , describes the gas-phase recombination of electrons (with the density ) and ions, where is the rate of recombination for the th ion species (with the density , the summation is over all ion species). The second recombination term, , describes the electron collection on dust (with the density ; in equilibrium, the electron collection is equal to the collection of all ion species). The dust-phase recombination rate (where is the thermal velocity scale for electrons) is determined by the normalized potential of a grain of radius (Fortov et al., 2005). It is assumed that dust comprises a small mass fraction of gas (typically, of the order of in the interstellar medium), i.e., the dust density is proportional to the gas density:
| (2) |
where is the mass of a grain and is the mean mass of a gas particle (expressed in units of the proton mass ). We note that generation of local dust traps in the disk (van der Marel et al., 2013; Flock et al., 2015; Ruge et al., 2016) as well as dust settling to the midplane (Zsom et al., 2011) may substantially increase the value of .
To evaluate the relative contribution of the two recombination terms, one can set (this is verified in Section IV.1). We substitute Equation (2) in Equations (1) and obtain a quadratic equation for . The solution suggests that for sufficiently low the gas-phase recombination is the dominant process (i.e., is negligible), and varies with the gas density as .222When includes both the dissociative recombination and the radiative recombination with heavy metal ions, the scaling for may change between and , depending on the density of metals and the magnitude of . Such a behavior is typical for different regions of molecular clouds (e.g., Oppenheimer & Dalgarno, 1974). At higher the situation is reversed: when the gas density exceeds a dust-phase recombination threshold,333The recombination threshold is defined as the gas density at which .
| (3) |
(where is the characteristic gas-phase recombination rate), the electron/ion density is primarily determined by the recombination on grains. By substituting typical values s-1 and K, and taking into account that cm3s-1 (e.g., Okuzumi, 2009), for micron-size grains we obtain that the gas-phase recombination in a heavy-ion HCO+/N2H+ plasma () is negligible for cm-3; for a H plasma () the recombination threshold is an order of magnitude lower. The characteristic recombination rate depends on details of the gas-phase reactions (Oppenheimer & Dalgarno, 1974), and therefore generally the value of is known only approximately.
Thus, for – below we call this the dust-phase recombination regime – the ionization degree is (practically) not affected by a variety of reactions occurring in the gas phase. The emergence of this regime reflects the growing importance of dust in the global ionization-recombination balance. When the grain-size polydispersity is taken into account, then (depending on the particular shape of the size distribution) the value of can be decreased significantly (see Section V).
III. Grain charge distribution
A stationary discrete charge distribution is obtained from the detailed equilibrium of the charging master equation (Draine & Sutin, 1987; Draine, 2011), as presented in Appendix B. The charge distribution, derived for dust grains of a given size and normalized to the total differential dust density at that size,
| (4) |
depends on two dimensionless numbers.
The first number is the effective ion-to-electron mass ratio , determined by the partial contributions of all ions. It is defined as (Draine & Sutin, 1987; Ivlev et al., 2015)
| (5) |
where is the total ion density and is the atomic mass number (in amu) of the th ion species; the identity in Equation (5) introduces the effective atomic mass of ions . The value of has well-defined upper and lower bounds: When dust does not noticeably affect the overall charge neutrality, we have and therefore ; when the contribution of the negatively charged dust is important, electrons become depleted and one can show (see Section IV) that asymptotically tends to unity (i.e., tends to a small constant of ), in order to satisfy the charge neutrality.
The second number is the grain potential energy of the unit charge, , normalized by (Ivlev et al., 2015),
| (6) |
(equivalently, is the inverse reduced temperature, Draine & Sutin, 1987). The value of can, in principle, be arbitrary small or large. The case corresponds to situations where grains grow beyond several microns or/and the ambient gas temperature exceeds a few hundred Kelvin – such conditions are at best matched in the inner midplane region of the disk (Armitage, 2007). The opposite limit, corresponding to small grains with m or/and low temperatures of K, primarily represents the initial coagulation stage or a stage where the particle fragmentation barrier is reached after initial grain growth; this may also represent the outer (colder) disk regions, where the gas density is nevertheless high enough to satisfy condition (3).
¿From Equations (B2) and (B3) we obtain the charge distribution for two limiting cases: Irrespective of the magnitude of , for the distribution tends to a Gaussian form (Draine & Sutin, 1987),
| (7) |
the average charge and the charge variance are determined by the normalized potential , which is the solution of the charging equation,
| (8) |
For the distribution is essentially discrete – the singly-charged states are
| (9) |
i.e., grains with are the most abundant; the multiply charged states () are usually exponentially small and practically negligible. We notice that the Gaussian charge distribution, usually assumed in ionization models (Okuzumi, 2009; Fujii et al., 2011; Dzyurkevich et al., 2013; Mori & Okuzumi, 2016), may only be employed for .
In Section IV.2 we identify a narrow range of where a gradual transition between the charge triplet (9) and the Gaussian distribution (7) occurs. Also, we discuss the role of the polarization interactions (Draine & Sutin, 1987), neglected in our consideration, and show that they have practically no effect on the obtained results.
IV. Densities of charged species
In the dust-phase recombination regime, the self-consistent ionization degree and the grain charge distribution are determined by a set of two equations: the ionization-recombination balance equation and the charge-neutrality equation.
| Symbol | Meaning |
|---|---|
| effective atomic mass of ions [amu] | |
| dust grain radius [cm] | |
| dust-to-gas mass ratio | |
| mass of a gas particle, dust grain (of radius ), electron, and proton [g] | |
| effective ion-to-electron mass ratio | |
| discrete charge distribution of grains of radius [cm-4] | |
| differential size distribution of grains [cm-4] | |
| number density of gas particles, electrons, and the total number density of ions [cm-3] | |
| number density of an electron-ion (EI) plasma [cm-3] | |
| recombination threshold, separating the gas-phase and dust-phase recombination regimes [cm-3] | |
| electron depletion threshold, at the transition to a dust-ion (DI) plasma [cm-3] | |
| asymptotic threshold, at the transition to a dust-dust (DD) plasma [cm-3] | |
| gas-phase and dust-phase recombination rates [cm-3 s-1] | |
| gas/dust temperature (same for all species) [K] | |
| thermal velocity scale of electrons, ions (of the atomic mass ), and grains (of radius ) [cm s-1] | |
| grain charge state and average charge number | |
| characteristic rate coefficient for the gas-phase recombination [cm3 s-1] | |
| rate coefficient for the dust-phase recombination [cm3 s-1] | |
| total ionization rate [s-1] | |
| normalized grain potential of the unit charge | |
| normalized grain potential for charge number (limiting case ) |
We start with the derivation of the ionization-recombination equation. The equilibrium charge distribution discussed above is determined by the detailed balance of the electron and ion fluxes on a grain surface, and therefore it does not matter which of these fluxes is used to calculate the recombination. For convenience, we consider the ion collection term, which can be presented in the following general form:
| (10) |
where is the effective thermal velocity scale of ions and is the effective number density of grains of radius , obtained for the ion collection in Appendix C. By substituting from Equation (C1), we derive the equation
| (11) |
Note that the sign of the index in is inverted, so that the summation is in fact performed over non-positive charge states ().
Next, we obtain the charge-neutrality equation. The charge density of dust grains (of a given size) is , where the summation over positive charges can be eliminated by using Equation (B2). Then the integration over the size distribution yields
| (12) |
where the summation is over negative charge states.
Equations (11) and (12) are complemented with the normalization condition for the dust density, Equation (4). Again, by eliminating the summation over positive charges we obtain
| (13) |
The derived set of governing Equations (11)–(13), along with the relation
and Equation (B3), allows us to calculate self-consistent charge distributions for arbitrary grain-size distributions, and obtain the corresponding electron and (total) ion densities. The grain-size distribution , the gas density , and the ionization rate (which is generally a decreasing function of ) are the input parameters for the derived model. The effective atomic mass of the ions is the only free parameter (entering through the effective mass ratio and the velocity scale ). The model is exact as long as the gas-phase recombination plays no role, i.e., when the strong condition (3) is satisfied.
The numerical solution of the derived equations, obtained for conditions of a typical protoplanetary disk and for several characteristic grain-size distributions, is presented in Section VI. However, before discussing these results, in the following Sections we study important limiting cases – this allows us to reveal and better understand a critical role of different physical mechanisms controlling ionization and dust charging. First, in Sections IV.1 and IV.2 we study analytically the two limiting cases of and , assuming that all grains have the same size. Then, in Section V we analyze generic effects introduced by the size polydispersity and show how the results derived for monodisperse particles can be generalized for an arbitrary size distribution.
For convenience, in Table 1 we summarize the main notations used throughout the paper.
IV.1. Case (big grains or/and high temperature)
The charge distribution for , Equation (7), is a broad Gaussian function (), so the summation over can be replaced with the integration. Moreover, as we show later, in this case can be well approximated by a shifted delta-function, (where is the density of monodisperse particles of radius ; the integration over in the governing equations is removed). By substituting the delta-function in Equations (11) and (12), employing Equation (8), and neglecting small terms , we reduce the governing equations to the following form:
| (14) | |||
| (15) |
where the dust and gas densities are related by Equation (2). Together with the charging equation (8), these equations are solved for , , and ; they can be reduced to a single nonlinear equation for , which depends on the input parameters via the ratio . The presented approach is equivalent to that used by Okuzumi (2009).
The generic behavior of the solution can be easily understood from a simple scaling analysis: As , from Equation (14) it follows that . Since is generally a decreasing function of , we conclude that the lhs of Equation (15) does not increase with , while the rhs scales as . The latter describes a contribution of the negatively charged dust to the overall charge neutrality. As long as is sufficiently small, the dust contribution is negligible and the charge neutrality is reduced to . This corresponds to “regular” electron-ion (EI) plasmas, where does not depend on and is determined from Equation (8) with . The dust contribution becomes crucial at larger , where Equation (15) can only be satisfied if and, therefore, decrease with , i.e., if the electron density is depleted. Hence, there exists a certain electron depletion threshold for the gas density – it identifies a crossover from EI to dust-ion (DI) plasmas, where the charge neutrality is regulated by positive ions and negatively charged dust grains.
We define the electron depletion threshold as at which the dust charge density, given by the rhs of Equation (15), becomes equal to the electron density.444Mathematically, this is equivalent to the condition that the total ion density , obtained from Equation (14), is two times the dust charge density. This yields
| (16) |
where is a function of . To obtain the magnitude of , we set for simplicity const and assume typical values used to estimate from Equation (3); e.g., for this yields . To distinguish between the gas-phase and dust-phase recombination regimes in EI plasmas, below we adopt notations EI[g] and EI[d] for the respective density ranges (of and ).

In EI plasmas, the density of electrons (ions) is directly obtained from Equation (14) with . This can be expressed in terms of as
| (17) |
i.e., the ratio does not depend on (note that it is also independent of ). Simultaneously, this equation provides a convenient normalization for the electron and ion densities in DI plasmas. In this case, and can be approximately calculated by neglecting in Equation (15). Together with Equations (14), (16) and (17), this leads to the following simple relations for :
| (18) | |||||
| (19) |
To derive , one has to substitute from Equation (18) and from Equation (17) in Equation (19). The electron density is obtained by substituting in Equation (8), and noting that . This yields
| (20) |
Equations (18)–(20) show that, in a DI plasma, and hence the average charge monotonically decrease with and, when , tend to zero as . Correspondingly, tends to times . The density ratio approaches a small (but finite) value of .
We remind that the results presented in this Section are obtained by substituting a shifted delta-function for the Gaussian charge distribution (Equation (7), entering the governing equations (11) and (12)). This approximation is formally justified as long as the average charge exceeds the charge variance , i.e., for . Remarkably, it turns out that the derived results remain valid also for : Equations (11) and (12), solved in this case with the Gaussian distribution, directly yield relations (18)–(20).
The condition (or, equivalently, ) corresponds to another characteristic gas density, the asymptotic threshold . Using Equation (18), we obtain
| (21) |
This threshold identifies the next important crossover, now from DI to dust-dust (DD) plasmas, where the charge neutrality is increasingly dominated by a balance between negatively and positively charged grains. For the average charge becomes less than unity. Since for any , the Gaussian charge distribution becomes asymptotically symmetric with respect to .
We see that the obtained results are completely characterized by the normalized potential as well as by the characteristic densities and (we notice that the asymptotic and depletion thresholds are related by Equation (21)). All these parameters are functions of the effective atomic mass of ions , which is the only free parameter of our model. The left panel in Figure 1 shows as well as the asymptotic density ratio , both plotted versus . In the right panel, functions representing the dependencies and are depicted (recall that ). In principle, may vary between unity (hydrogen ions) and some large numbers (e.g., 56 for iron ions), but astrochemical models (Semenov et al., 2004) suggest that molecular and metal ions, such as HCO+/N2H+ () and Mg+ (), usually dominate in very dense molecular clouds and protoplanetary disks. From Figure 1 we see that the uncertainty in and , associated with the plasma composition in this case, does not exceed a few dozens of percent. This effect is practically negligible next to uncertainties introduced by poorly known grain-size distribution (e.g., Kim et al., 1994; Weingartner & Draine, 2001) and grain morphology (the latter determines dependence of the grain mass on its effective size).
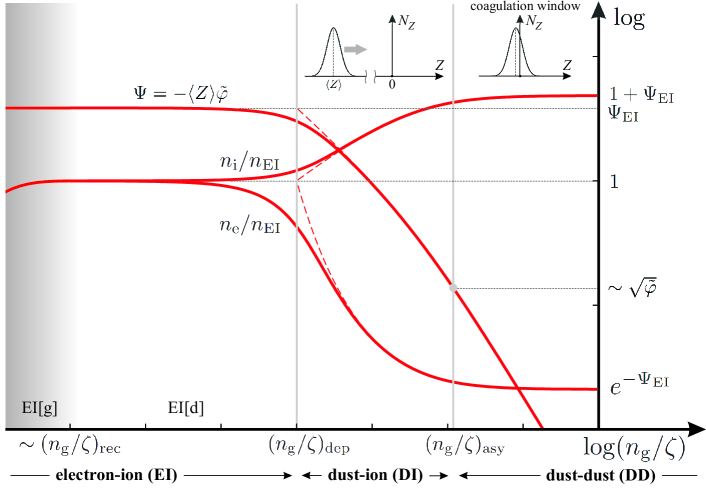
Figure 2 summarizes the behavior of the average dust charge and of the electron and ion densities in the entire dust-phase recombination regime, and also illustrates modification of the dust charge distribution with increasing . The densities are normalized by , so for we have . The value of weakly depends on the average atomic mass of ions (the plotted curves are for HCO+/N2H+ ions). The solid red lines show the exact solution of the governing Equations (14) and (15) together with the charging Equation (8), which are equivalent to Equations (32)–(34) of Okuzumi (2009). With the used normalization, the curves have a universal form, applicable for arbitrary set of parameters in the dust-phase recombination regime. The behavior at is well reproduced by approximate relations (18)–(20), shown by the red dashed lines, with the maximum deviation at (where the ion density is underestimated by , while the grain potential and the electron density are overestimated by and a factor of , respectively). Note that is an arbitrary small parameter in the considered case, and therefore the point (which identifies the crossover to a DD plasma) could in principle be located below the asymptotic value of .
So far we have assumed that the gas temperature is constant. In protoplanetary disks, the relative temperature increase toward the center is usually not as strong as the increase of the gas density. Nevertheless, this is a noticeable effect which can in fact be straightforwardly incorporated in our model – the temperature simply becomes an additional input parameter. Moreover, it turns out that in many cases, for instance – in the disk midplane, and are related by a simple power-law dependence, (e.g., with , see Armitage, 2007). We notice that the gas temperature enters and , thus affecting the electron depletion threshold . From this we immediately infer that the ratio on the lhs of Equations (16) should be replaced with (then the rhs is properly normalized with the respective density scale entering the dependence); both ratios on the rhs of Equation (18) are replaced in the same way. As regards , the lhs of Equation (17) should be multiplied with , i.e., falls off with gas density as .
When considering recombination on grains, we have so far also implicitly assumed that only free electrons and ions contribute to this process. Such an approach is natural since the thermal velocities of plasma species are much larger than typical thermal velocities of grains, and therefore the terms describing recombination due to mutual dust collisions (Umebayashi, 1983; Umebayashi & Nakano, 1990; Marchand et al., 2016) are omitted in Equation (11). On the other hand, in a DD plasma grains become the most abundant charged species and, thus, collisions between them may provide an important contribution to the net recombination rate. This occurs when the product becomes comparable to the thermal ion flux , where is the relevant (thermal or non-thermal) scale for the relative velocity of grains. By substituting the asymptotic expression for we conclude that the recombination mechanism due to mutual dust collisions should be important at . If the thermal motion dominates dust dynamics, the corresponding gas density exceeds by many orders of magnitudes: e.g., for micron-size grains in a HCO+ plasma, should be of the order of ). However, the condition can be significantly relaxed for grains exhibiting strong non-thermal motion, e.g., due to differential drift or sedimentation (Testi et al., 2014). Furthermore, since , an increase of the dust fraction occurring due to various processes operating in the disk midplane (see Section VI.1) also promotes this mechanism of recombination.
IV.2. Case (small grains or/and low temperature)
In this case the charge distribution is very different from the Gaussian form – practically, it is limited by the singly-charged and neutral states, as it follows from Equation (9). By substituting the charge distribution in Equation (13) we derive
| (22) | |||
| (23) |
where small terms were neglected. The governing Equations (11) and (12) are reduced to
| (24) | |||
| (25) |
where . By substituting Equation (23) in Equation (25) we obtain the average charge
| (26) |
which is always smaller than unity and, as expected, tends to zero when .
For an EI plasma one should set and neglect the rhs of the charge-neutrality Equation (25), exactly as in the case . The corresponding electron depletion threshold is determined by
| (27) |
and the plasma density for is
| (28) |
We take into account that is very large, so the terms and are omitted in both expressions (whereas the retained terms may be arbitrary large in the considered case).
For a DI plasma, , we derive the following relations:
| (29) | |||
| (30) |
Equation (29) yields the solution for and, hence, for ; the dependence is obtained by substituting in Equation (30). Asymptotically we obtain and .
Thus, the qualitative behavior of , , and remains exactly the same as in the case . On the other hand, the values of (Equations (16) or (27)) and (Equations (17) or (28)) can be quite different in the two cases – their relative magnitudes depend on and (for the corresponding case). Nevertheless, the curves for the normalized electron and ion densities, plotted versus the normalized gas density in the case , look similar to those in Figure 2. Interestingly, the absolute value of the asymptotic ion density for is exactly a half of that derived for . The dust charge distribution gradually changes at , from the asymmetric triplet with the maximum at , as given by Equation (9) with , to a quasi-symmetric triplet with the peak at . This latter asymptotic form represents a DD plasma discussed in Section IV.1.
Above, we have completely neglected the polarization interactions of electrons and ions with dust grains. These interactions noticeably increase the electron/ion collection cross sections by uncharged (or weakly charged) grains in the case (Draine & Sutin, 1987). As a result, the relative abundances in Equation (9) are increased by the factor of . Correspondingly, in Equations (22) and (23) should be multiplied with this factor, while in Equation (24) should be multiplied with , and Equation (25) is left unchanged. In practice, such modification does not affect the characteristic densities given by Equations (27) and (28), as this becomes important only for extremely large values of ( for a HCO+/N2H+ plasma).
To conclude this Section, let us make a note on a crossover between the limiting cases and . In an EI plasma, the magnitude of the average charge given by Equation (26) is always significantly smaller than ) for . This fact does not allow us to smoothly match these two cases: From Equations (16) and (27) we conclude that the value of for is a factor of larger than that for , when compared at the formal “matching point” . Similarly, from Equations (17) and (28) we obtain that calculated at the matching point for is times the value for . Setting for simplicity const and taking a HCO+/N2H+ plasma as an example, we obtain the relative mismatch of for and for . The reason for the discrepancy is obvious: Equations (B1) and (B2) imply that the negatively charged states with , neglected in Equations (24) and (25), rapidly become dominant when decreases below a value of ( for a HCO+/N2H+ plasma). Hence, there is a relatively narrow range (of ) where a gradual transition between the triplet (9) and the Gaussian distribution (7) takes place.
V. Effect of grain-size distribution
The grain polydispersity, i.e., the presence of grains of different sizes, plays an exceptionally important role in the discussed processes. The reason for that is twofold, as one can directly see from the governing equations: (i) The integral in the ionization-recombination Equation (11) determines the magnitude of the plasma recombination rate on the grain surface and, hence, the equilibrium plasma (ion) density. The integral can be dominated by different parts of the size distribution, depending on its particular form. (ii) In the same way, the size distribution affects the integral determining the contribution of charged grains in the charge-neutrality Equation (12).
Let us first consider the case which, remarkably, allows us to obtain rigorous results for arbitrary size distribution from the solution derived in Section IV.1 for single-size grains. Indeed, keeping the integrals in Equations (11) and (12) yields in this case Equations (14) and (15) with the modified rhs: The “recombination factor” in the former equation is replaced with , and, similarly, the “charge-neutrality factor” in the latter equation is replaced with (we remind that ). Thus, the effects of polydispersity are factorized, leading to a simple renormalization of the characteristic densities.
For illustration, we employ a widely used power-law dependence for the differential dust density,
| (31) |
defined for the size range (here, we naturally assume that the condition is satisfied for all sizes down to ). The constant is determined from the dust-to-gas density ratio, Equation (2), where should be replaced by the integral . For certainty, we assume that the power-law index does not exceed the MRN value of 3.5 (Kim et al., 1994; Weingartner & Draine, 2001), so the mass integral is always dominated by the upper-size cutoff . For this size distribution, the integral in the modified Equations (14) is equal to multiplied by the following renormalization factor:
| (32) |
Here, and is the effective dust density determined by the condition , with . For the sake of clarity we do not consider situations with (where the contributions of the upper and lower cutoffs are comparable), which allows us to neglect small terms . Similarly, the integral in the modified Equation (15) is equal to multiplied by the renormalization factor
| (33) |
where . We see that the contribution of smaller grains can become dominant when decreases sufficiently steeply with size. This lowers the plasma density (due to enhanced recombination) and increases the average grain charge, as described by Equations (32) and (33), respectively.
¿From Equations (32) and (33) we infer that the characteristic densities can be dramatically decreased for polydisperse grains: From Equation (3) we conclude that the resulting recombination threshold is inversely proportional to the squared dust-phase recombination rate and, hence, is reduced by the squared factor (32). For the MRN distribution this implies a decrease by a factor of about (Mathis et al., 1977). As for the electron depletion threshold , its value is inversely proportional to the product of the two factors, i.e., the rhs of Equation (16) should be divided by
| (34) |
Again, taking the MRN distribution as an extreme example, we obtain a reduction by almost three orders of magnitude! Finally, the density of an EI plasma, Equation (17), is directly derived from Equation (14). Therefore, for polydisperse grains should be divided by the factor (32).
In the case , the effects of polydispersity are generally no longer factorized: Now, the factors and on the rhs of Equations (24) and (25), respectively, should be replaced with integrals. Using Equations (22) and (23) we obtain the respective integrals, and . One can see that a renormalization of the characteristic densities is only possible when the range of (corresponding to a given range of grain sizes) does not overlap with the value of . As the latter decreases monotonically with , from for a HCO+/N2H+ plasma) to unity, such situation appears unlikely, and thus the governing equations should be solved numerically. Nevertheless, in the following Section (where the numerical results are presented) we demonstrate that the qualitative effects of polydispersity remain similar to those discussed above for the case .
| Grain-size distribution | , cm-3 | , cm-3 | , cm-3 |
|---|---|---|---|
| MRN | |||
| m |
For convenience, in Table 2 we summarize characteristic values of the threshold gas densities. Using these values and taking into account the following scaling dependencies (for compact grains): , , and , one can deduce the thresholds for arbitrary parameters.
VI. Implications for Protoplanetary Disks
In this Section we employ a typical protoplanetary disk model to numerically calculate the gas ionization and dust charging. In particular, the results are aimed to answer the following questions:
-
•
May the “coagulation window” be opened, to overcome the electrostatic barrier?
-
•
How accurate is the (conventional) assumption of low dust charges?
We restrict ourselves by considering the disk midplane region, where the gas and dust mass is concentrated. The gas surface density of the disk is assumed to obey a power-law dependence on the disk radius, with g/cm2 and , which leads to the disk mass of ( for the outer radius of AU ( AU). We consider a sharp cutoff, as a tapered power-law profile does not qualitatively change the results. Furthermore, we assume that the disk thermal structure is determined by re-radiation of the central star emission. The gas/dust temperature is calculated from (Brauer et al., 2008) with the effective star temperature K, stellar radius , and for the sine of the grazing angle.555The additional gas heating due to accretion may increase the inner disk temperature, leading to thermal ionization. Here we neglect this effect, since it is only important at high temperatures above K. The disk is assumed to be vertically isothermal, with the vertical density structure derived from the hydrostatic equilibrium for the central star mass of . We consider CRs, stellar X-rays and radionuclides as primary sources of ionization in the midplane (Turner & Sano, 2008),
| (35) |
where s-1 is the (unattenuated) CR-ionization rate with the attenuation surface density of g/cm2, s-1 is the X-ray ionization rate at 1 AU (which corresponds to the X-ray luminosity of the central star of erg/s) with the attenuation surface density of g/cm2, and s-1 is the ionization rate due to long-lived radioactive nuclei.
An important ingredient of any disk model are dust properties, i.e., the dust density, size distribution, and grain morphology. Below we consider four characteristic models for the dust size distribution – two “monodisperse” (single-size) populations of grains, and two MRN-like distributions (Mathis et al., 1977), given by Equation (31) with :
-
•
monodisperse, m;
-
•
monodisperse, m;
-
•
MRN: m, m;
-
•
evolved MRN: m, m.
For all models, grains are supposed to be compact spheres, and the dust-to-gas ratio is the same and equal to at any location in the disk. We adopt 3.5 g/cm3 for the solid mass density of dust grains, and assume that N2H+ or HCO+ are the dominant ions ().
VI.1. May the “coagulation window” be opened?

The electrostatic barrier against the dust growth, caused by the mutual repulsion of the negatively charged grains (Okuzumi, 2009), presents a fundamental but still poorly investigated issue of the modern dust evolution models. The issue stems from estimates (Okuzumi, 2009) showing that, in most regions of a protoplanetary disk, the average electrostatic energy of interaction between grains at their contact can exceed their relative kinetic energy. Indeed, for “big” grains () in EI plasmas, the ratio of the electrostatic energy to the thermal energy, , is always very large.
The two obvious ways to overcome the electrostatic barrier are to decrease the magnitude of the grain charges or to increase the relative velocity of the grains. Recently it was shown that the photoelectric emission caused by stellar UV radiation may drive grain charges to positive values and thus allow dust coagulation at intermediate heights of the protoplanetary disks (Akimkin, 2015); similarly, the photoelectric grain charging due to CR-induced H2 fluorescence can operate in the much deeper, outer midplane regions of the disk (Ivlev et al., 2015). None of these mechanisms, however, is able to affect dust charging in dense disk regions. Okuzumi et al. (2011a) suggested that the presence of a large number of small grains may remove free electrons from the gas in these regions, and thus make larger grains less charged. Let us elaborate on the latter mechanism.
Under low-density/high-ionization conditions with (EI plasmas), grains are highly charged due to abundance of free electrons. The average grain charge in this case tends to the maximum possible value of , determined by the ion mass and temperature, and therefore the coagulation of micron-size (or larger) grains is usually hampered. In denser regions of the disk, where (DI plasmas), the grain charges lower due to depletion of free electrons. A specific feature of DI plasmas is that charging of grains of a given size is determined by the entire dust ensemble. By moving into the densest disk regions, where (DD plasmas), the depletion of electrons eventually becomes so strong that their accretion onto a neutral grain is practically equal to the ion accretion. Thus, the grain charge distribution becomes practically symmetric with respect to zero, opening up the opportunity for barrier-free coagulation.
The threshold parameters , , and , identifying boundaries between different plasma regions, vary across the disk. As introduced above, is determined by equal gas and dust contributions to the recombination rates, corresponds to equal number densities of free electrons and electrons carried by dust grains, while at the total positive charge is equally distributed between free ions and grains. We express these parameters in terms of the gas density, with the ionization rate according to Equation (35), and depict the resulting plasma regions EI[g], EI[d], DI, and DD in Figure 3 for the four dust models.
Figure 3 shows that for the monodisperse m dust model (upper left panel), the DD plasma region is limited to AU and the EI region is at AU (with the DI region filling the gap between them). Introducing the grain polydispersity leads to a strong shift of the plasma boundaries: for the MRN model (lower left panel), the DD plasma region extends up to AU, while the DI region continues beyond AU. These results confirm conclusions of Section V, demonstrating that excess of small particles in a broad size distribution may dramatically reduce the values of and . The increase of the overall grain size has the opposite effect: According to the results of Sections IV.1 and IV.2, the boundaries between different plasma regions in this case are shifted to much higher (i.e., to smaller ), with the strongest effect being on (for monodisperse grains). Indeed, the right panels in Figure 3, depicting the results for monodisperse m grains and for the evolved MRN model, show no presence of a DD plasma.
Thus, the (initial) MRN size distribution ensures that the coagulation window is opened (DD plasma state) in the entire inner disk, promoting rapid dust growth. However, the latter process rapidly modifies the overall charge balance towards DI and EI plasmas: for the evolved dust distributions (only by two orders of magnitude in size, as in the right panels of Figure 3) the electrostatic barrier is completely restored (EI plasma state) for AU. The excess of small grains makes the coagulation conditions more favorable, but this factor alone is insufficient for further efficient dust growth.
We conclude that some feedbacks are necessary to facilitate the coagulation. This could be dust fragmentation leading to, e.g., a bimodal small/big size distribution (where small grains provide conditions for a reduced potential barrier between big grains, Okuzumi et al., 2011a); or this could be an increase in the dust-to-gas ratio (Booth & Clarke, 2016; Surville et al., 2016), since both the EI-DI and DI-DD plasma boundaries are determined by the value of . Such feedbacks may be achieved due to turbulent motion outside of the dead zone (see Section VI.3) – which simultaneously increases the relative grain velocities (Testi et al., 2014) and hence further reduces the effect of the electrostatic barrier. Turbulence generates local dust traps (van der Marel et al., 2013; Flock et al., 2015; Ruge et al., 2016) where can become as high as a few (Johansen & Youdin, 2007; Surville et al., 2016). With such values of , the coagulation window opens up at AU even for the monodisperse m dust (while for the evolved MRN, is sufficient).
VI.2. Low charges for dust grains: Is this always justified?

In the contemporary MRI and astrochemical models of protoplanetary disks, it is routinely assumed that the charge states of dust grains are around zero (). This is generally true for small dust grains (m) in low-temperature gas ( K) (Tielens, 2005, see Equation (5.75)). However, such small grains cannot be representative for the dense protoplanetary environments. As the average charge of larger grains scales linearly with the size, the coagulation inevitably leads to the breakdown of the low-charge assumption (see also Perez-Becker & Chiang, 2011; Ilgner, 2012).
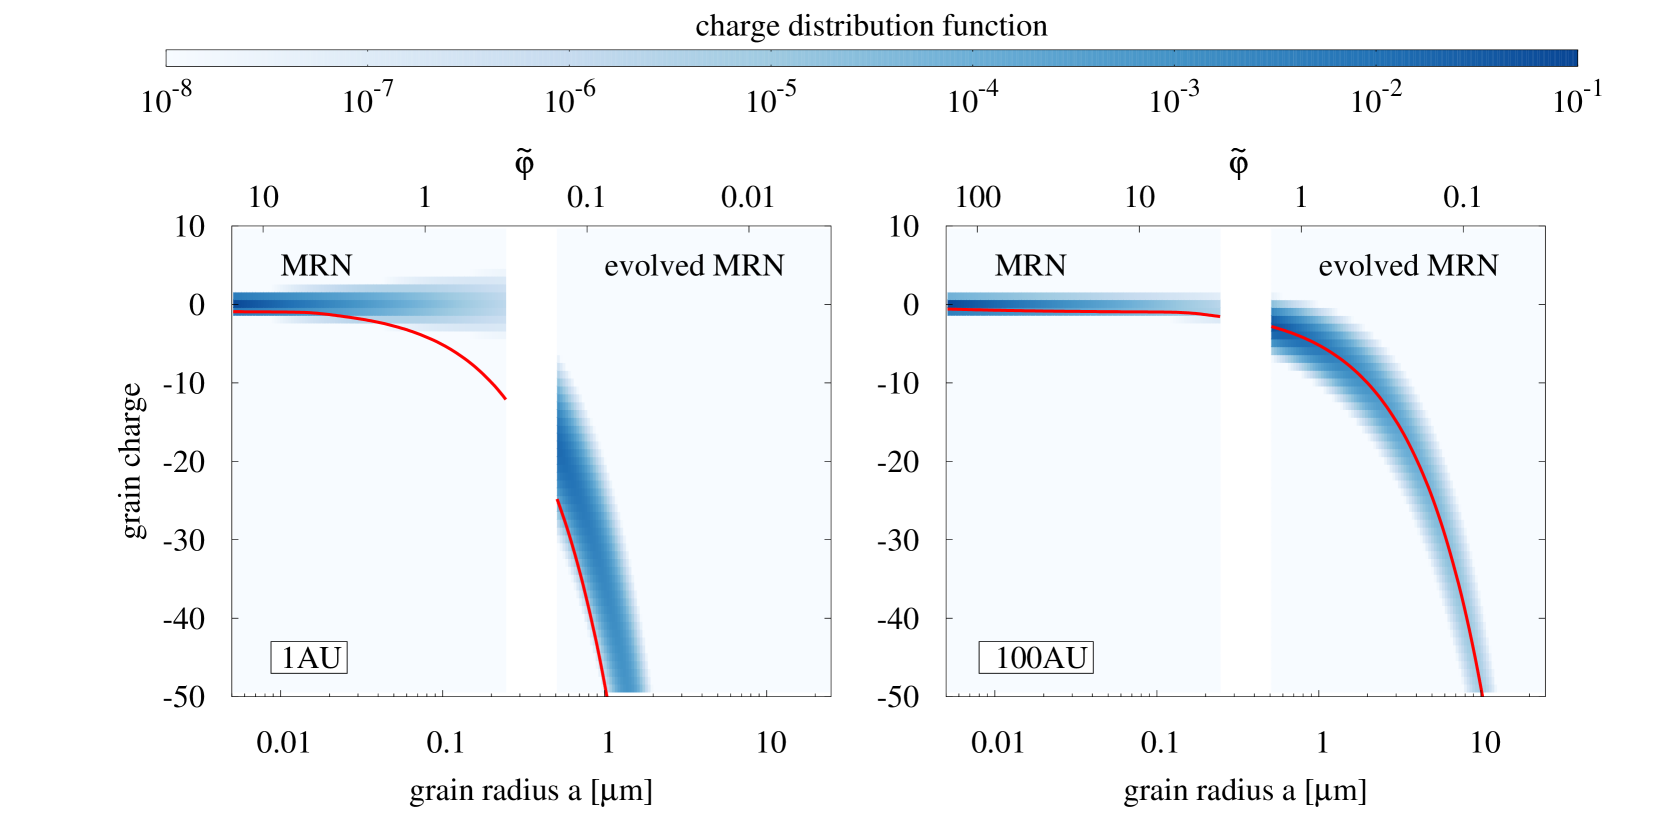
In Figure 4 we demonstrate the grain charge distributions for the MRN and evolved MRN models, plotted at the radial distance of 1 AU (left) and 100 AU (right). Note that different dust models correspond to independent simulations and are only shown on the same plot to facilitate the comparison.
In the MRN case shown in Figure 4 most grains, indeed, carry low charges. For AU, the charge distribution is practically symmetric with respect to the zero state. This symmetry is a characteristic feature of DD plasmas, where the singly-charged positive and negative grains are the dominant charge carriers. For AU, the charge distribution is slightly shifted to the negative values, representing DI plasmas. Low grain charges in the MRN case are due to a large number of small (m) grains – they effectively reduce the abundance of free electrons and prevent larger (sub-micron) grains from being multiply charged. However, as small grains are expected to disappear rapidly during the initial stages of coagulations, larger grains become dominant in the size distribution.
For the evolved MRN distribution in Figure 4, the average grain charge exhibits a linear scaling with the size; the charge may be as high as for m grains. We notice that the results for AU and 100 AU represent, respectively, DI plasmas and EI plasmas (as follows from the lower right panel of Figure 3), so their direct comparison may appear counterintuitive: for otherwise the same parameters, dust charges in DI plasmas should be lower than in EI plasmas. The observed “discrepancy” is, however, due to the fact that temperatures are higher at smaller .
The derived charge distributions show that one should be careful assuming low-charge states for protoplanetary disk conditions. A moderate increase of the average grain size (above m) can easily break this assumption.
VI.3. Discussion
The “dead zone” is a region of the protoplanetary disk where the development of MRI is suppressed by non-ideal MHD effects (e.g., Armitage, 2007). It is well known that the size of the dead zone should strongly depend on dust properties (Sano et al., 2000; Bai, 2011a, b; Dudorov & Khaibrakhmanov, 2014). The inner boundary of the dead zone is associated with the thermal ionization near the central star, and is usually located at distances well below 1 AU (Chatterjee & Tan, 2014). To roughly estimate the position of the outer boundary, one can use the condition that the magnetic Reynolds number,
| (36) |
exceeds unity outside of the dead zone (see, e.g., Equation (170) of Armitage, 2015). Here, is the turbulent alpha-parameter (outside of the dead zone), is the sound speed, and is the Keplerian angular velocity. For the estimates, we assume that the magnetic diffusivity at high gas densities is determined by the Ohmic term (Xu & Bai, 2016), which can be approximated by for a weakly ionized gas (Spitzer, 1962; Armitage, 2011).666For the sake of simplicity, here we do not discuss the Hall and ambipolar diffusion, as their role in the development of the dead zone requires more complex analysis (e.g., Lesur et al., 2014).
To demonstrate the influence of the grain-size distribution on the size of the dead zone, in Figure 5 we plot the abundances of the major charged species, calculated for different dust models. One can see that even a moderate increase in the average grain size leads to significant changes in the ionization degree which, in turn, strongly affects the position of the outer dead-zone boundary, marked by the vertical dashed line in each panel: The resulting size of the dead zone is about 30, 10, 3 and 2 AU for, respectively, the MRN, monodisperse m, evolved MRN, and monodisperse m dust size distribution.
As was pointed out in Section VI.1, dust coagulation increases the ionization degree which, in turn, leads to higher grain charges and prevents further coagulation due to growing electrostatic barrier. On the other hand, higher ionization favors the development of MRI and thus stimulates the coagulation via turbulent dust motion. The situation become even more complicated when the turbulence leads to the fragmentation of dust aggregates – apart from destruction, this process generates new populations of small dust which may reduce the electrostatic barrier and promote coagulation of larger grains. Altogether, this suggests the existence of positive and negative feedback loops that may unpredictably halt or accelerate the coagulation at different locations in the disk, and also highlights the importance of self-consistent analysis of the ionization and dust evolution processes.
VII. Summary
We have developed an exact analytical model which describes ionization and dust charging in dense protoplanetary disk conditions, for arbitrary grain-size distribution. Unlike previously developed approaches (Ilgner & Nelson, 2006; Okuzumi, 2009; Fujii et al., 2011; Dzyurkevich et al., 2013; Mori & Okuzumi, 2016), our model does not make assumptions on the form of the grain charge distribution, and enables convenient analysis of results in a general form, in terms of a few dimensionless numbers, which allows us to identify universality in the behavior of the charged species. The governing equations for different cases are summarized in Appendix A, Table 3.
For given dust properties and conditions of the disk, the presented model has only one free parameter (the effective mass of the ions ), and is developed for the regime where the dust-phase recombination of free electrons and ions dominates over the gas-phase recombination. A transition to this regime occurs in an electron-ion (EI) plasma (where charged grains still do not play any role in the overall charge neutrality), and is characterized by the dust-phase recombination threshold for the gas density.
At higher gas densities, , charged grains play an increasingly important role in the charge neutrality. We have determined two characteristic parameters, the electron depletion threshold and the asymptotic threshold , marking, respectively, transitions from the EI to dust-ion (DI) plasma state, and then to the dust-dust (DD) state. The thresholds are determined in such a way that at electrons and negative grains equally contribute to the total negative charge, while at ions and positive grains provide equal contribution to the total positive charge.
The immediate important implications of the derived results for protoplanetary disks are as follows:
-
1.
Unless the dust size distribution is dominated by grains much smaller than m, larger grains are typically multiply (negatively) charged. In this case, irrespective of the location in the disk, the average grain charge scales linearly with the size. As the size distribution in protoplanetary disk conditions develops towards bigger grains, the conventional approximation of low grain charges may only be used for (very) initial stages of the disk evolution. The presented results are obtained assuming compact dust, and therefore the implication for porous aggregates (which are expected to carry higher charges due to bigger effective sizes) is even stronger. In situations where an aggregate is approximated by a sphere, the effects of porosity can be straightforwardly included by adopting a fractal scaling law , relating the dust mass and the effective size (with appropriate fractal dimensionality , which is known to vary during the dust evolution, Okuzumi et al., 2009).
-
2.
The asymptotic transition to a DD plasma implies that the grain charge distribution becomes quasi-symmetric with respect to . This completely removes the repulsive electrostatic barrier and opens a “coagulation window” for large aggregates, operating in the inner dense region of protoplanetary disks. On the other hand, the DD plasma state only “delays” the formation of the barrier: the coagulation itself leads to decreasing dust number density and a gradual shift back to DI/EI plasmas. The (re)appearance of the electrostatic barrier in this case, with the maximum achieved in the EI state (where the energy of the barrier normalized to the thermal energy of grains, , is always very large), may completely inhibit further dust growth. The effect of the barrier can be reduced by various feedback mechanisms operating in the disk and leading to increased local gas-to-dust ratio, such as the dust trapping or moderate fragmentation.
We point out that the dust evolution, change in the charged species abundances, and development of MRI are strongly interrelated processes whose mutual effect is poorly understood: The dust coagulation increases the ionization degree which, in turn, leads to higher grain charges and prevents further coagulation due to growing electrostatic barrier. On the other hand, higher ionization favors the development of MRI, making a disk turbulent; a moderate turbulence facilitates dust growth by increasing the relative grain velocities, while strong turbulence leads to dust fragmentation. The latter generates small grains, which may decrease the electron fraction (asymptotically, by a factor of ) and lead to MRI quenching. A complex interplay of these nonlinear processes suggests the existence of multiple positive and negative feedback loops that may dramatically affect the ultimate dust evolution.
A rigorous treatment of the ionization fraction and dust evolution could be critical during all stages in the process that links molecular clouds to stellar systems – this is the motivation behind our work. The exact analytical model presented here can be easily implemented in non-ideal MHD simulations, to properly follow the ionization fraction and the dust growth during the process of protoplanetary disk formation (e.g., Zhao et al., 2016) and evolution (e.g., Dullemond et al., 2007; Armitage, 2011, and references therein).
We provide a FORTRAN source code, applicable for arbitrary dust size distributions and also for porous grains, to calculate abundances of the charged species: http://www.inasan.ru/~akimkin/codes.html
Acknowledgements
This research made use of NASA’s Astrophysics Data System. The authors thank an anonymous referee for detailed comments and suggestions, and Dr. Bo Zhao and Dr. Sergey Khaibrakhmanov for useful discussions. VVA acknowledges financial support from Russian Foundation for Basic Research (16-32-00012 mol_a) and from a grant of the President of the Russian Federation (NSh-9576.2016.2). PC acknowledges financial support from the European Research Council (ERC Advanced Grant PALs 320620).
Appendix A Appendix A: Summary of governing equations
For convenience, in Table 3 we list the equations to be used in a general case, as well as in different limiting cases.
Appendix B Appendix B: Grain charge distribution
When the photoemission from grains as well as other emission mechanisms are negligible, is determined by the collection of electrons and ions from the ambient plasma. The sticking probabilities of electrons and ions are both assumed equal to unity. The collection cross sections, determined by the electrostatic interactions with a charged grain, are derived from the OML approximation (Whipple, 1981; Fortov et al., 2005). For positive charge states, the detailed equilibrium yields (Draine & Sutin, 1987; Draine, 2011)
| (B1) |
negative charge states are related to the respective positive states via
| (B2) |
From Equation (B1) we derive
| (B3) |
is readily obtained by using Equation (B2). Note that the charge distribution is slightly modified when the polarization interactions are taken into account (e.g., Equations (3.3) and (3.4) in Draine & Sutin, 1987). If needed, this effect can easily be included in Equations (B1)–(B3) (Ivlev et al., 2015). To include the stickling probabilities of electrons, , and ions, , the rhs of Equation (B1) should be multiplied by the ratio .
Appendix C Appendix C: Effective dust density for the ion collection
The effective number density of grains of radius , entering the dust-phase recombination term in Equation (10), takes into account the electrostatic interaction between ions by charged grains. Depending on the sign of the grain charge, the (geometrical) cross section of the ion collection by the grain is increased or decreased; the corresponding factors are derived from the OML approximation. Summing up partial contributions of all charged states yields
We use Equation (B2) to eliminate the summation over positive charges, and employ the recurrent relation (B1) to rewrite in the identical form,
| (C1) |
which is more convenient for the analysis (see Sections IV.1 and IV.2).
References
- Akimkin (2015) Akimkin, V. V. 2015, ARep, 59, 747
- Armitage (2007) Armitage, P. J. 2007, arXiv:astro-ph/0701485
- Armitage (2011) —. 2011, ARA&A, 49, 195
- Armitage (2015) —. 2015, arXiv:1509.06382
- Bai (2011a) Bai, X.-N. 2011a, ApJ, 739, 50
- Bai (2011b) —. 2011b, ApJ, 739, 51
- Balbus & Hawley (1991) Balbus, S. A., & Hawley, J. F. 1991, ApJ, 376, 214
- Birnstiel et al. (2012) Birnstiel, T., Klahr, H., & Ercolano, B. 2012, A&A, 539, A148
- Booth & Clarke (2016) Booth, R. A., & Clarke, C. J. 2016, MNRAS, 458, 2676
- Brauer et al. (2008) Brauer, F., Dullemond, C. P., & Henning, T. 2008, A&A, 480, 859
- Carballido et al. (2016) Carballido, A., Matthews, L. S., & Hyde, T. W. 2016, ApJ, 823, 80
- Chatterjee & Tan (2014) Chatterjee, S., & Tan, J. C. 2014, ApJ, 780, 53
- Dominik et al. (2007) Dominik, C., Blum, J., Cuzzi, J. N., & Wurm, G. 2007, in Protostars and Planets V, ed. B. Reipurth, D. Jewitt, & K. Keil (Tucson, AZ: Univ. Arizona Press), 783–800
- Draine (2011) Draine, B. T. 2011, Physics of the Interstellar and Intergalactic Medium (Princeton, NJ: Princeton Univ. Press)
- Draine & Sutin (1987) Draine, B. T., & Sutin, B. 1987, ApJ, 320, 803
- Dudorov & Khaibrakhmanov (2014) Dudorov, A. E., & Khaibrakhmanov, S. A. 2014, Ap&SS, 352, 103
- Dullemond et al. (2007) Dullemond, C. P., Henning, T., Visser, R., et al. 2007, A&A, 473, 457
- Dzyurkevich et al. (2013) Dzyurkevich, N., Turner, N. J., Henning, T., & Kley, W. 2013, ApJ, 765, 114
- Flock et al. (2015) Flock, M., Ruge, J. P., Dzyurkevich, N., et al. 2015, A&A, 574, A68
- Fortov et al. (2005) Fortov, V. E., Ivlev, A. V., Khrapak, S. A., Khrapak, A. G., & Morfill, G. E. 2005, PhR, 421, 1
- Fujii et al. (2011) Fujii, Y. I., Okuzumi, S., & Inutsuka, S.-i. 2011, ApJ, 743, 53
- Ilgner (2012) Ilgner, M. 2012, A&A, 538, A124
- Ilgner & Nelson (2006) Ilgner, M., & Nelson, R. P. 2006, A&A, 445, 205
- Ivlev et al. (2015) Ivlev, A. V., Padovani, M., Galli, D., & Caselli, P. 2015, ApJ, 812, 135
- Johansen et al. (2014) Johansen, A., Blum, J., Tanaka, H., et al. 2014, in Protostars and Planets VI, ed. H. Beuther, R. Klessen, C. Dullemond, & T. Henning (Tucson, AZ: Univ. Arizona Press), 547–570
- Johansen & Youdin (2007) Johansen, A., & Youdin, A. 2007, ApJ, 662, 627
- Kim et al. (1994) Kim, S.-H., Martin, P. G., & Hendry, P. D. 1994, ApJ, 422, 164
- Larsson et al. (2012) Larsson, M., Geppert, W. D., & Nyman, G. 2012, RPPh, 75, 066901
- Lesur et al. (2014) Lesur, G., Kunz, M. W., & Fromang, S. 2014, A&A, 566, A56
- Li et al. (2014) Li, H.-B., Goodman, A., Sridharan, T. K., et al. 2014, in Protostars and Planets VI, ed. H. Beuther, R. Klessen, C. Dullemond, & T. Henning (Tucson, AZ: Univ. Arizona Press), 101–123
- Marchand et al. (2016) Marchand, P., Masson, J., Chabrier, G., et al. 2016, A&A, 592, A18
- Mathis et al. (1977) Mathis, J. S., Rumpl, W., & Nordsieck, K. H. 1977, ApJ, 217, 425
- Mori & Okuzumi (2016) Mori, S., & Okuzumi, S. 2016, ApJ, 817, 52
- Nishi et al. (1991) Nishi, R., Nakano, T., & Umebayashi, T. 1991, ApJ, 368, 181
- Okuzumi (2009) Okuzumi, S. 2009, ApJ, 698, 1122
- Okuzumi et al. (2009) Okuzumi, S., Tanaka, H., & Sakagami, M.-a. 2009, ApJ, 707, 1247
- Okuzumi et al. (2011a) Okuzumi, S., Tanaka, H., Takeuchi, T., & Sakagami, M.-a. 2011a, ApJ, 731, 95
- Okuzumi et al. (2011b) —. 2011b, ApJ, 731, 96
- Oppenheimer & Dalgarno (1974) Oppenheimer, M., & Dalgarno, A. 1974, ApJ, 192, 29
- Pérez et al. (2015) Pérez, L. M., Chandler, C. J., Isella, A., et al. 2015, ApJ, 813, 41
- Perez-Becker & Chiang (2011) Perez-Becker, D., & Chiang, E. 2011, ApJ, 727, 2
- Pinilla et al. (2015) Pinilla, P., de Boer, J., Benisty, M., et al. 2015, A&A, 584, L4
- Ruge et al. (2016) Ruge, J. P., Flock, M., Wolf, S., et al. 2016, A&A, 590, A17
- Salmeron & Wardle (2008) Salmeron, R., & Wardle, M. 2008, MNRAS, 388, 1223
- Sano et al. (2000) Sano, T., Miyama, S. M., Umebayashi, T., & Nakano, T. 2000, ApJ, 543, 486
- Semenov et al. (2004) Semenov, D., Wiebe, D., & Henning, T. 2004, A&A, 417, 93
- Spitzer (1962) Spitzer, L. 1962, Physics of Fully Ionized Gases, 2nd edn. (New York: Interscience)
- Surville et al. (2016) Surville, C., Mayer, L., & Lin, D. N. C. 2016, arXiv:1601.05945
- Testi et al. (2014) Testi, L., Birnstiel, T., Ricci, L., et al. 2014, in Protostars and Planets VI, ed. H. Beuther, R. Klessen, C. Dullemond, & T. Henning (Tucson, AZ: Univ. Arizona Press), 339–361
- Tielens (2005) Tielens, A. G. G. M. 2005, The Physics and Chemistry of the Interstellar Medium (Cambridge, UK: Cambridge University Press)
- Turner et al. (2014) Turner, N. J., Fromang, S., Gammie, C., et al. 2014, in Protostars and Planets VI, ed. H. Beuther, R. Klessen, C. Dullemond, & T. Henning (Tucson, AZ: Univ. Arizona Press), 411–432
- Turner & Sano (2008) Turner, N. J., & Sano, T. 2008, ApJ, 679, L131
- Umebayashi (1983) Umebayashi, T. 1983, PThPh, 69, 480
- Umebayashi & Nakano (1990) Umebayashi, T., & Nakano, T. 1990, MNRAS, 243, 103
- van der Marel et al. (2015) van der Marel, N., Pinilla, P., Tobin, J., et al. 2015, ApJ, 810, L7
- van der Marel et al. (2013) van der Marel, N., van Dishoeck, E. F., Bruderer, S., et al. 2013, Sci, 340, 1199
- Velikhov (1959) Velikhov, E. P. 1959, JETP, 36, 1398
- Weingartner & Draine (1999) Weingartner, J. C., & Draine, B. T. 1999, ApJ, 517, 292
- Weingartner & Draine (2001) —. 2001, ApJ, 548, 296
- Whipple (1981) Whipple, E. C. 1981, RPPh, 44, 1197
- Xu & Bai (2016) Xu, R., & Bai, X.-N. 2016, ApJ, 819, 68
- Zhang et al. (2016) Zhang, K., Bergin, E. A., Blake, G. A., et al. 2016, ApJ, 818, L16
- Zhao et al. (2016) Zhao, B., Caselli, P., Li, Z.-Y., et al. 2016, MNRAS, 460, 2050
- Zsom et al. (2011) Zsom, A., Ormel, C. W., Dullemond, C. P., & Henning, T. 2011, A&A, 534, A73
- Zsom et al. (2010) Zsom, A., Ormel, C. W., Güttler, C., Blum, J., & Dullemond, C. P. 2010, A&A, 513, A57