Spatial variations of PAH properties in M17SW revealed by /IRS spectral mapping
Abstract
We present /IRS mid-infrared spectral maps of the Galactic star-forming region M17 as well as IRSF/SIRIUS Br and Nobeyama 45-m/FOREST 13CO (=1–0) maps. The spectra show prominent features due to polycyclic aromatic hydrocarbons (PAHs) at wavelengths of 6.2, 7.7, 8.6, 11.3, 12.0, 12.7, 13.5, and 14.2 . We find that the PAH emission features are bright in the region between the HII region traced by Br and the molecular cloud traced by 13CO, supporting that the PAH emission originates mostly from photo-dissociation regions. Based on the spatially-resolved /IRS maps, we examine spatial variations of the PAH properties in detail. As a result, we find that the interband ratio of PAH 7.7 /PAH 11.3 varies locally near M17SW, but rather independently of the distance from the OB stars in M17, suggesting that the degree of PAH ionization is mainly controlled by local conditions rather than the global UV environments determined by the OB stars in M17. We also find that the interband ratios of the PAH 12.0 , 12.7 , 13.5 , and 14.2 features to the PAH 11.3 feature are high near the M17 center, which suggests structural changes of PAHs through processing due to intense UV radiation, producing abundant edgy irregular PAHs near the M17 center.
1 Introduction
Spectral bands due to polycyclic aromatic hydrocarbon (PAH) emissions are dominant features in the near- and mid-infrared (IR; 3–20 ). Since PAHs are excited by far-UV photons (6–13.6 eV), the PAH emission features are characteristic of photo-dissociation regions (PDRs). The PAH emission features are observed at wavelengths of 3.3, 6.2, 7.7, 8.6, 11.3, 12.0, 12.7, 13.5, 14.2, 15.8, 16.4, 17.4, 17.8 and 18.9 , which are attributed to vibrations of C-H or C-C bonds in hydrocarbons. Those features, especially main features at 6.2, 7.7, 8.6, 11.3, and 12.7 , are theoretically and observationally well-studied (e.g., Chan et al. 2001; Draine & Li 2007; Tielens 2008; Bauschlicher et al. 2009). Past studies have shown that the PAH interband ratios are useful probes to study the properties of PAHs. Among these, the degree of PAH ionization is best studied through interband ratios involving the 6.2, 7.7 and 11.3 PAH interband ratios. Here the 6.2 and 7.7 bands, due to C-C vibrations, are representative of ionized PAHs and the 11.3 band, due to C-H vibrations, representative of neutral PAHs (e.g., Allamandola et al. 1999; Peeters et al. 2002). It is expected that the degree of PAH ionization is relatively high near exciting sources while that is low in molecular clouds. Another important property is the edge structure of PAHs, which is probed by using the interband ratios of the PAH features at 11.3, 12.0, 12.7, 13.5, and 14.2 ; likely origins of these features are all C-H in-plane bending, but the numbers of adjacent C-H bonds in a benzene ring are different (PAH 11.3 : solo; PAH 12.0 : duo; PAH 12.7 : trio; PAH 13.5 and PAH 14.2 : quartet; Draine 2003; Tielens 2005). For example, edgy PAHs are expected to show the strong PAH 12.0, 12.7, 13.5, and 14.2 features relative to the PAH 11.3 feature. The structures of PAHs may change from region to region depending on the surrounding radiation field (Boersma et al. 2013; Kaneda et al. 2014). Therefore examining the PAH ionization together with the PAH edge structure may be helpful to discuss variations of the PAH properties.
Recently, variations in the PAH properties have been intensively studied for a variety of targets mainly with and (e.g., Peeters et al. 2002; Smith et al. 2007b; Boersma et al. 2012; Yamagishi et al. 2012). Most of such studies, however, discussed PAHs in individual areas, and did not intensively examine spatial variations of PAHs. In order to examine the effects of the surrounding interstellar environment on the PAH properties, spatially-resolved observations are essential (e.g., Crété et al. 1999; Rapacioli et al. 2005; Berné et al. 2007; Sakon et al. 2007; Kaneda et al. 2005, 2008; Fleming et al. 2010; Yamagishi et al. 2010; Berné & Tielens 2012; Pilleri et al. 2012; Egusa et al. 2013; Croiset et al. 2016). One of the most intensive spatially-resolved studies in PAHs was carried out by Boersma et al. (2013, 2014, 2015). They analyzed /IRS spectral maps of the reflection nebula NGC 7023 and decomposed the observed spectra to the emission features from ionized and neutral PAHs. As a result, they found clear spatial variations in the degree of PAH ionization along the direction from the exciting B-type star to PDR and molecular-cloud regions. Stock et al. (2016) also examined the PAH interband ratios of seven Galactic HII regions and three reflection nebulae with /IRS spectral maps, although they did not discuss spatial variations of the ratios in the target regions. Haraguchi et al. (2012) examined the degree of PAH ionization in the Orion nebula based on their ground-based near-IR narrow-band observations. The number of such spatially-resolved studies of PAHs is, however, still limited.
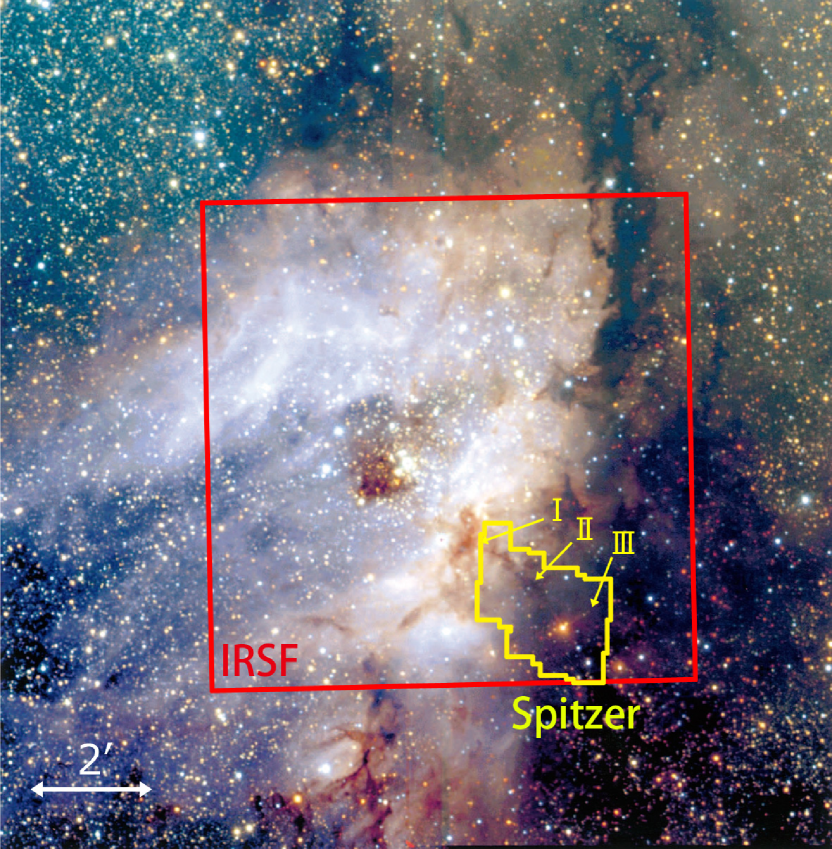
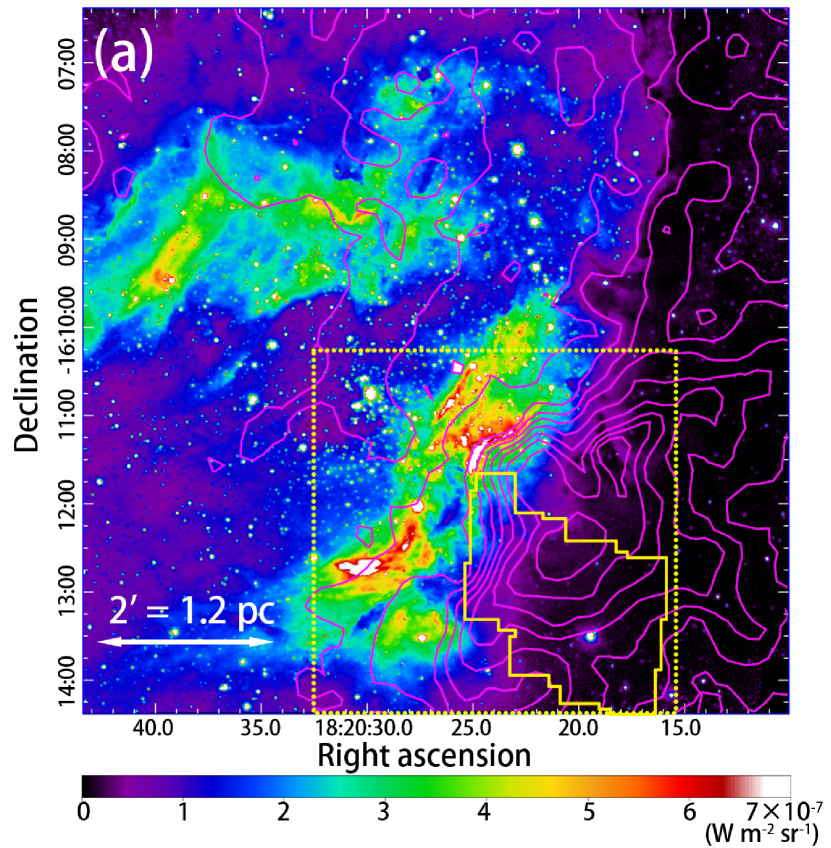
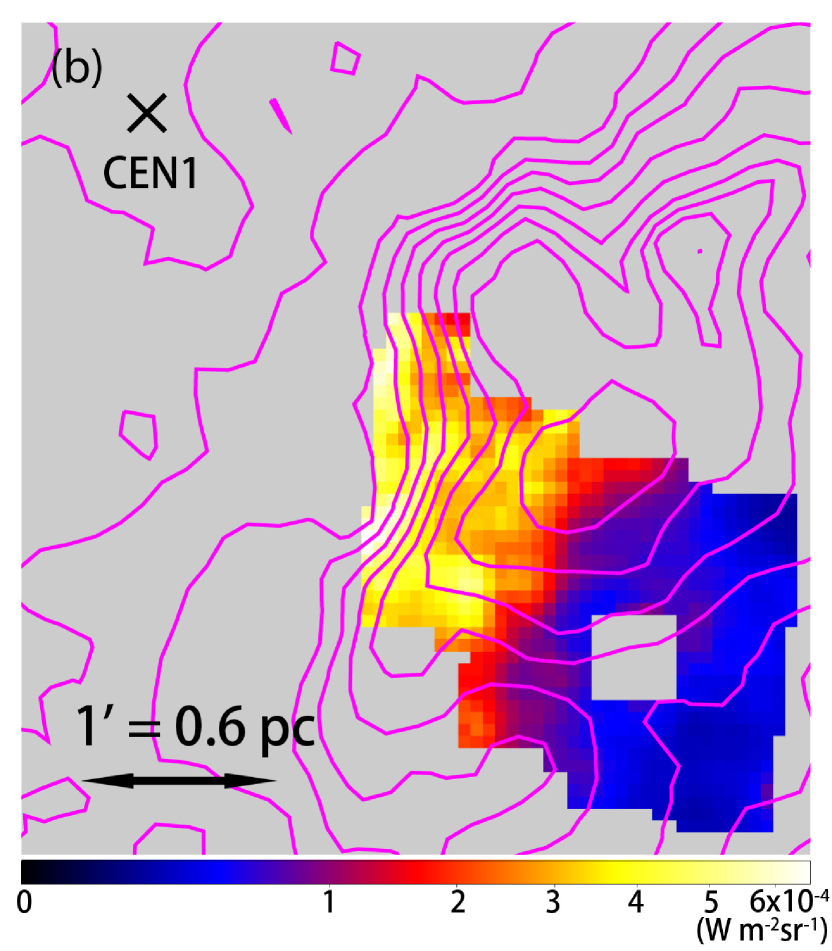
In this paper, we present /IRS spectral maps of the mid-IR PAH features in the Galactic star-forming region M17 as well as Br and 13CO(=1–0) maps covering the same region. M17 is young (1 Myr; Hanson et al. 1997) and one of the well-studied active Galactic star-forming regions (e.g., Stutzki & Guesten 1990; Giard et al. 1992, 1994; Cesarsky et al. 1996; Povich et al. 2007), which contains more than 100 OB stars in the central cluster, NGC 6618 (Lada et al. 1991). Among them, the most active ionizing source is CEN1, a binary of O4+O4 stars (Chini et al. 1980). Assuming the distance of 2 kpc (Xu et al. 2011), the area of the spectral maps in the present study is pc2 which is 80 times larger than that in the study of NGC 7023 (Boersma et al. 2013). Based on the wide-area spectral maps, we examine the effects of the intense star-forming activity on the properties of PAHs in detail.
2 Observations and Data Reduction
2.1 /IRS
We analyzed archival /IRS spectral mapping data (AORKEY: 17976320, 17976576, 17977344, and 17977600), which were retrieved from the Heritage Archives. The observed area is shown in Fig. 1. The used module is short-wavelength-low-resolution (SL) covering a wavelength range of 5.2–14.5 with a spectral resolution of =64–128 (Houck et al. 2004). We used CUbe Builder for IRS Spectra Maps ver. 1.8 (CUBISM; Smith et al. 2007a) with the default setting to reduce the data, and obtained spectral and its uncertainty cubes for the three orders named SL1 (7.4–14.5 ), SL2 (5.2–7.7 ), and SL3 (7.3–8.6 ), separately. We checked bad pixels with eyes and removed them. In the data reduction, background spectra were not considered. The major background in the mid-IR is the zodiacal light, the spectra of which have smooth continua without prominent spectral features (Reach et al. 1996). The intensity of the zodiacal light is 60 MJy/sr at a wavelength of 18 around M17 (Kondo et al. 2016). The contribution of the zodiacal light in M17 spectra is negligible near the center, while that is not in outer regions. We, therefore, do not discuss the continuum emission in the present study. After unifying the pixel scale from the original size to 3.6 for the three FITS cubes to correct differences in the spatial resolution at each wavelength range, the intensity levels for SL1 and SL2 were adjusted to coincide with SL3 in the overlapped wavelength ranges. Finally, we obtained 990 independent mid-IR spectra.
2.2 IRSF/SIRIUS
We performed narrow-band imaging of M17 with the SIRIUS camera on the IRSF 1.4 m telescope (Nagashima et al. 1999; Nagayama et al. 2003). SIRIUS has a field of view of 7.7 7.7 with a pixel scale of 0.45. We observed M17 using the two narrow-band filters tuned for the Pa 1.28 and Br 2.16 lines, simultaneously. The effective band widths of the filters are 0.029 for Pa and 0.038 for Br. The observation was carried out on 2013 June 10 with an integration time of 75 seconds and 20 dithering. The observed area is also shown in Fig. 1. In the present study, we analyzed only the Br image which is less affected by the interstellar extinction than the Pa image.
We reduced the image data based on the standard data reduction procedure including dark subtraction, flat-fielding, sky subtraction and dithered-image-combining. Since we did not subtract a continuum image, free-free continuum emission may be contaminated in the Br image. Photometric calibration was performed by comparing point-source fluxes in the image with those in the 2MASS Point Source Catalog (Skrutskie et al. 2006), where we assumed that the magnitude of each point source is the same between the -band and the narrow-band images. We used sufficiently isolated (11) point sources with the -band flux in a range of 9.0–11.0 mag and with errors smaller than 0.05 mag. As a result, the uncertainty of the photometric calibration coefficient is 5 %. The final 1 noise level is .
2.3 Nobeyama 45-m/FOREST
We analyzed CO mapping data of M17, which were taken in the framework of the FUGIN (FOREST Ultra-Wide Galactic plane survey In Nobeyama; Minamidani et al. 2016b) legacy survey covering a wide area of the Galactic plane (=10–50∘, 198–236∘, ) with a high spatial resolution of 15 and 1 noise level of 0.4 K in the scale at 1 km/s velocity resolution. FOREST (Minamidani et al. 2016a) is a four-beam receiver, and has a capability of simultaneous on-the-fly mapping observations using the three CO lines, 12CO (=1-0), 13CO (=1-0), and C18O (=1-0). Pointing errors were corrected every 1.5 hours by observing SiO maser sources. As a result, the pointing accuracy of the telescope is kept to be . We used calibrated 13CO map (internal team release version 1.3) because it is likely optically thin and traces overall molecular cloud structures in star forming regions. The 13CO map has spatial resolution of 18 and 1 noise level of 0.8 K in the scale at 1 km/s velocity resolution as an intermediate product of the survey project. The detail of the survey observations and data reductions will be described in Umemoto et al. in prep.
3 Analyses and Results
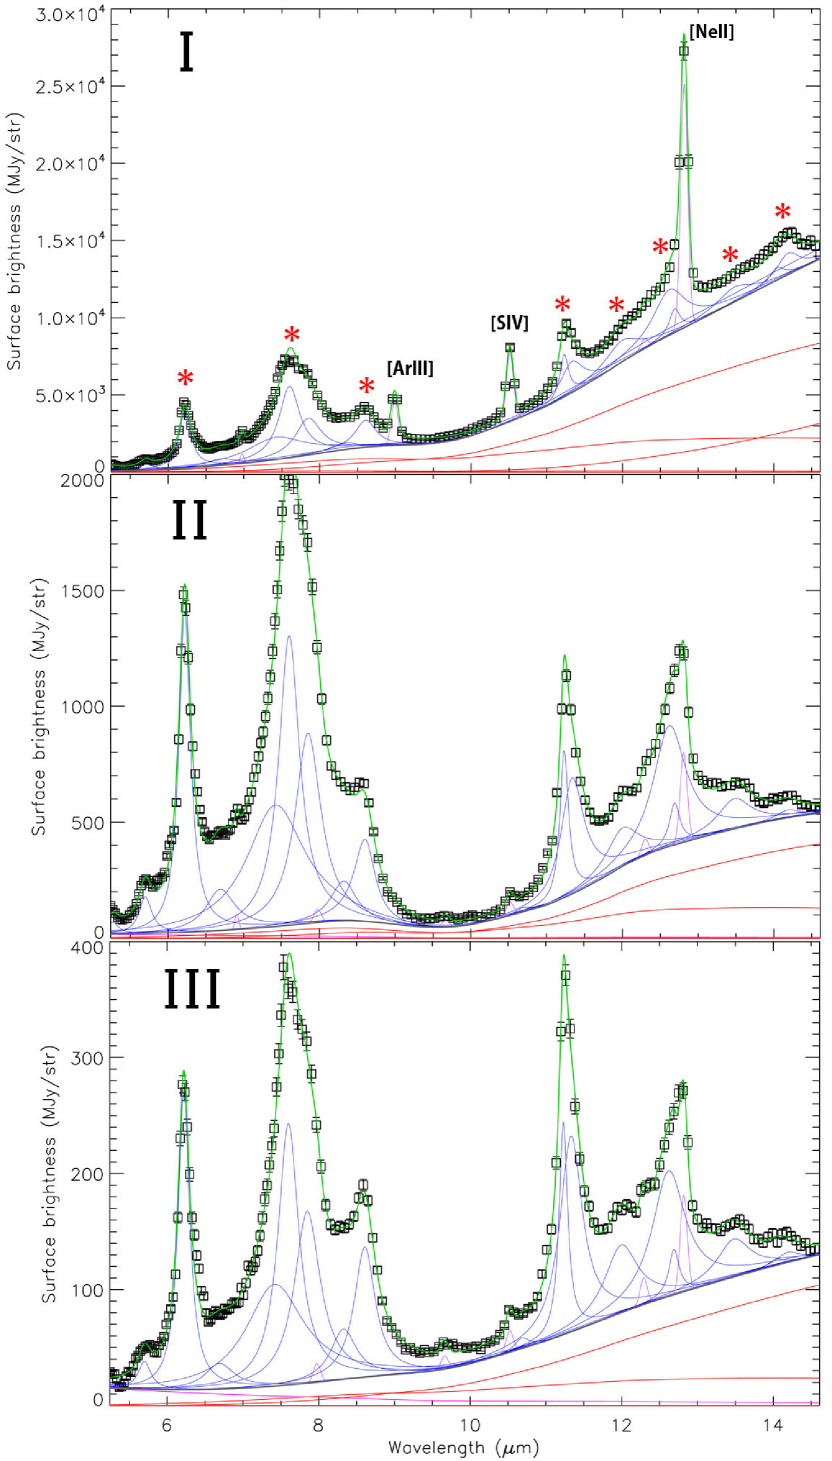
Figure 2 shows examples of the spectra extracted from positions I, II, and III which are labeled in Fig. 1. The spectra show a variety of emission features due to PAHs at 6.2, 7.7, 8.6, 11.3, 12.0, 12.7, 13.5, and 14.2 , and fine-structure lines ([NeII], [ArIII], and [SIV]). The fine-structure lines are dominant at position I which is nearest to the M17 center, while the PAH features are dominant at positions II and III. In order to examine variations of the PAH intensities and interband ratios, we decomposed the spectra using PAHFIT (Smith et al. 2007b), which is designed to fit various spectral features in /IRS SL spectra including silicate dust absorption around 9.7 . We used PAHFIT assuming screen dust extinction, and reconstructed the spectral maps of the mid-IR features. In the mid-IR spectra, the PAH 7.7 , 11.3 , and 12.7 features are treated as PAH complexes which have multiple components. As treated in Smith et al. (2007b), we calculated a sum of the three components centered at 7.42 , 7.60 , and 7.85 for the intensity of the PAH 7.7 complex, the two components centered at 11.23 and 11.33 for the intensity of the PAH 11.3 complex, and the two components centered at 12.62 and 12.69 for the intensity of the PAH 12.7 complex. In the fitting procedure, we considered the systematic error of 2 % (Lebouteiller et al. 2011) in addition to random errors provided by CUBISM. Figure 2 also shows the results of PAHFIT, where PAHFIT reproduces the example spectra very well.
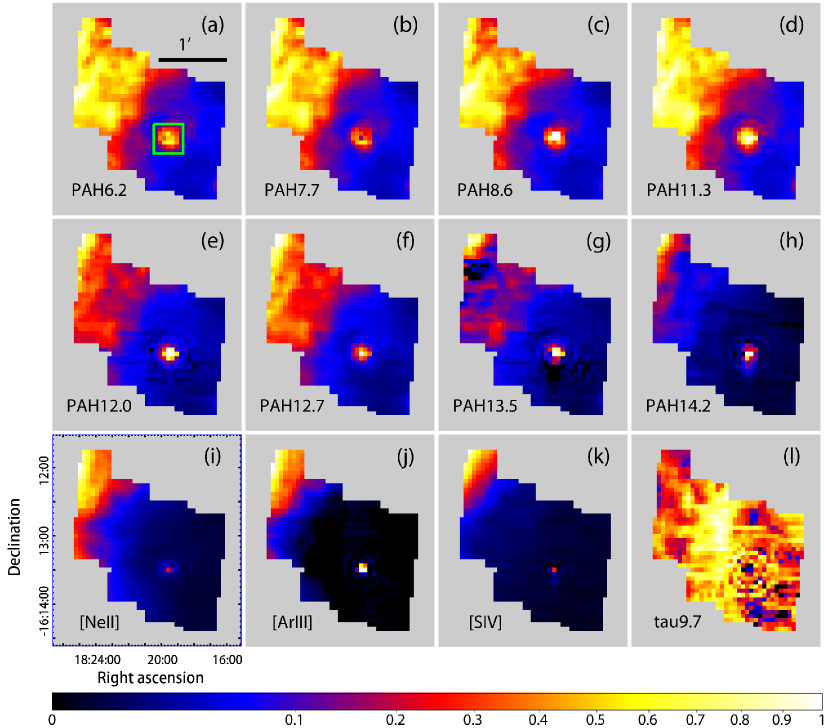
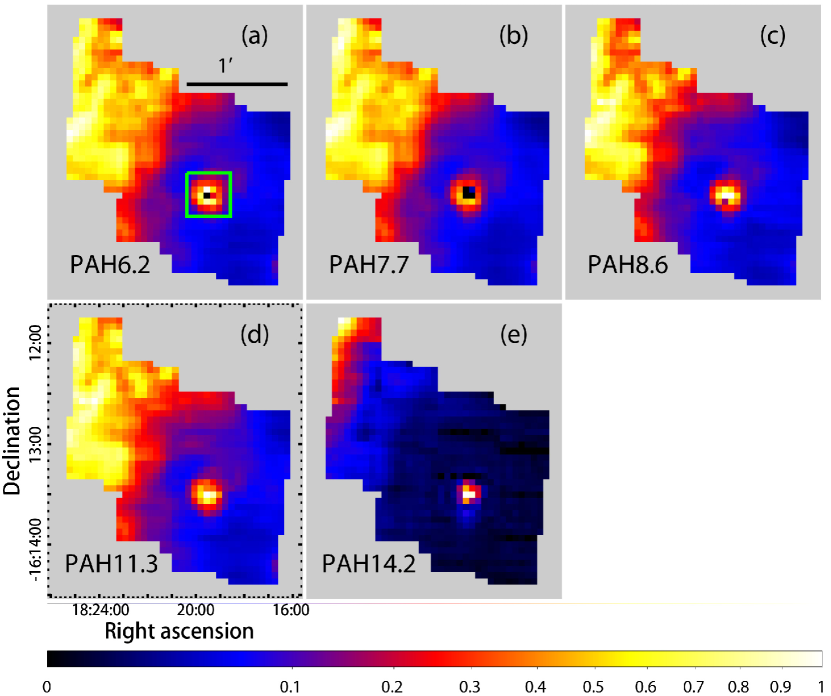
Figure 3 shows the resultant spectral maps obtained for the mid-IR features (PAH features at 6.2, 7.7, 8.6, 11.3, 12.0, 12.7, 13.5, and 14.2 , [NeII], [ArIII], [SIV], and optical depth of silicate dust absorption at 9.7 ), where the interstellar extinction is corrected. In the maps, there is a large-scale gradient from the north-east to the south-west. In the PAH maps, there are also local structures especially on the east side, suggesting that PAHs are not only globally but also locally affected by the surrounding interstellar environments. It is notable that the maps of the PAH 12.7 and 12.0 features are similar to each other. They are both probably attributed to C-H out-of-plane bending modes, and the former is blended with the strong [NeII] line, while the latter is not. Therefore, this similarity suggests that PAHFIT has successfully decomposed emissions from the PAH 12.7 feature and the [NeII] line. In the fine-structure line maps, a spatial extent in the [NeII] map is large, while that in [SIV] is small, which presumably corresponds to the difference in the ionization potential; the energies required to ionize Ne0, Ar+, and S++ are 21.6 eV, 27.6 eV, and 34.8 eV, respectively. In the optical depth map, there is a ridge structure in the north-south direction. We confirm that the optical depth estimated by using PAHFIT is consistent with that estimated in Stock et al. (2016).
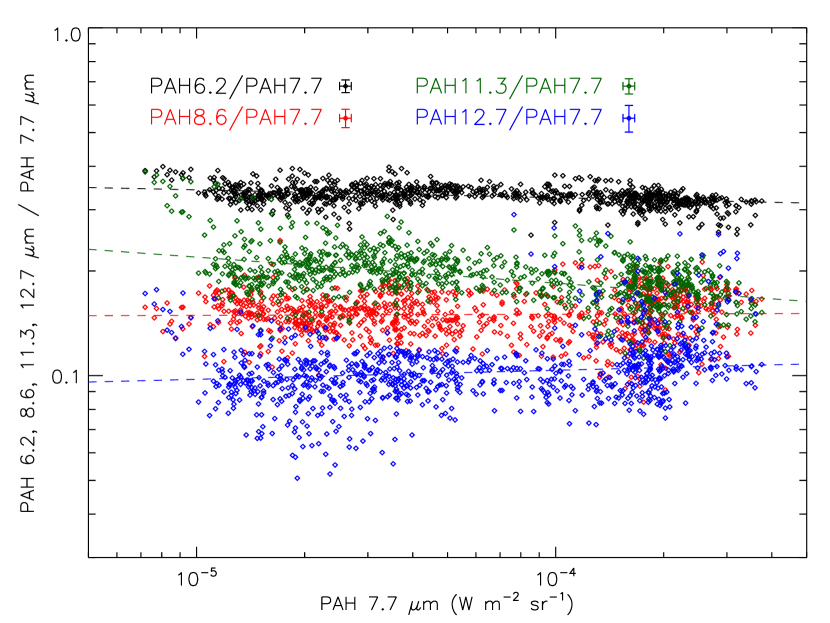
Figure 4 shows the PAH interband ratios of the PAH 6.2 , 8.6 , 11.3 , and 12.7 features to the PAH 7.7 feature plotted against intensities of the PAH 7.7 feature. The dashed lines in Fig. 4 indicate the best-fit power-law relation for each of the PAH interband ratio. It is notable that the best-fit lines are nearly flat, indicating that there are no clear systematic variations in the PAH interband ratios for various interstellar environments. By contrast, there are clear differences in the dispersion along the vertical axis from ratio to ratio. We calculated 1 standard deviations of the PAH interband ratios. As a result, we find that the PAH 6.2 /PAH 7.7 ratios show the smallest variations (PAH 6.2 /PAH 7.7 : 0.028 dex (decimal exponent), PAH 8.6 /PAH 7.7 : 0.065 dex, PAH 11.3 /PAH 7.7 : 0.086 dex, PAH 12.7 /PAH 7.7 : 0.11 dex). Probable origins of the PAH 6.2 and 7.7 features are C-C bonds, while those of the other PAH features are C-H bonds (Allamandola et al. 1989; Draine & Li 2007). Therefore, the difference in the variations in the interband ratios may reflect spatial variations in the properties of the PAH population.
Figure 5(a) shows the 13CO(=1-0) contour map overlaid on the Br image of M17. The Br emission is detected in an inner region of M17, especially in south-west and north-east areas, but not detected in west and south-west areas. In the regions where Br is not detected, the 13CO emission is strongly detected. The strong peak of the 13CO emission is adjacent to the bright rim of the Br emission. Thanks to the high spatial resolution of the 13CO map and the small extinction in the Br map, a spatial separation of an HII region from the molecular cloud is clearly recognized. Figure 5(b) shows comparison of the total major PAH map (PAH 6.2 +PAH 7.7 +PAH 8.6 +PAH 11.3 +PAH 12.7 ) with the 13CO map. By comparing Fig. 5(a) with Fig. 5(b), it is clear that the PAH emission is bright on the boundary between the Br and 13CO emissions, which strongly supports that the PAH features are emitted from PDRs.
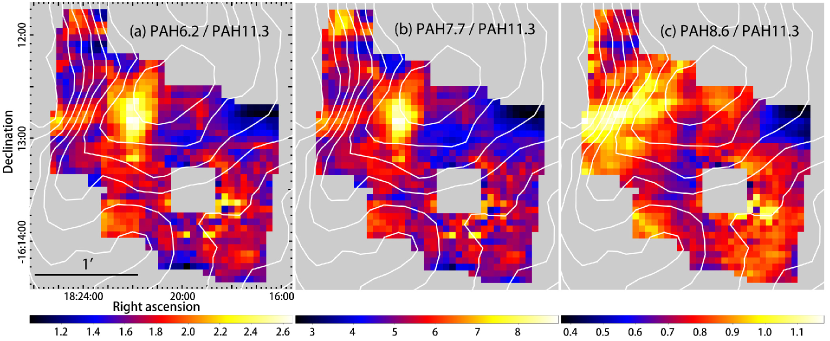
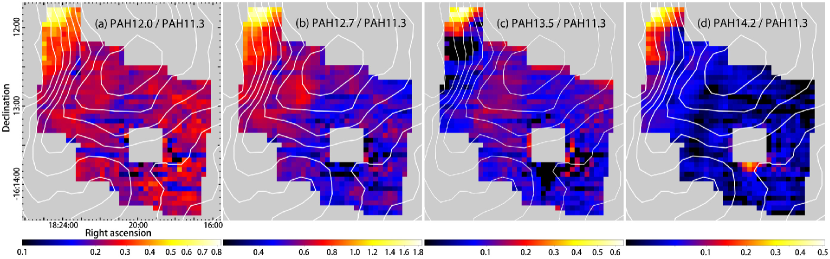
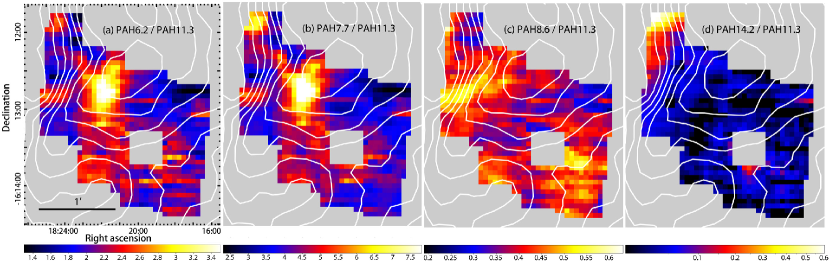
Figure 6 shows the PAH interband ratio maps (PAH 6.2 /PAH 11.3 , PAH 7.7 /PAH 11.3 , and PAH 8.6 /PAH 11.3 ) and their correlation plots. The interband ratios are possible probes of the degree of PAH ionization because the PAH 6.2, 7.7, and 8.6 features are efficiently emitted by ionized PAHs, while the PAH 11.3 feature is emitted by both ionized and neutral PAHs (Allamandola et al. 1999; Peeters et al. 2002). In the maps, there is no clear large-scale gradient as seen in Fig. 3, and local structures are dominant, suggesting that the PAH properties are controlled by local conditions rather than the large-scale UV environment determined by the OB stars in M17. It is notable that these ratios are high near the 13CO peak. Position II in Fig. 1 corresponds to the peak of the PAH 7.7 /PAH 11.3 ratio. The spectrum extracted from position II actually shows a high PAH 7.7 /PAH 11.3 ratio in comparison with those extracted from positions I and III (Fig. 2). This result supports that the degree of PAH ionization is significantly different from position to position. The PAH 6.2 /PAH 11.3 ratios tightly correlate with the PAH 7.7 /PAH 11.3 ratios, while they do not tightly correlate with the PAH 8.6 /PAH 11.3 ratios, although the PAH 8.6 /PAH 11.3 ratio is also known to be a measure of the PAH ionization (e.g., Boersma et al. 2014). Since the probable origin of the PAH 8.6 feature (C-H in-plane-bending mode; Tielens 2005) is different from that of the PAH 6.2 and 7.7 features (C-C stretching mode; Tielens 2005), other factors (e.g., size) may affect the PAH 8.6 /PAH 11.3 ratio (e.g., Bauschlicher et al. 2008, 2009; Ricca et al. 2012). Maps and correlation plots of other four interband ratios (PAH 12.0 /PAH 11.3 , PAH 12.7 /PAH 11.3 , PAH 13.5 /PAH 11.3 , and PAH 14.2 /PAH 11.3 ) are shown in Fig. 7, which are likely probes of the PAH edge structure. The maps show that these ratios are relatively high on the near side of M17, suggesting that PAH structures are not uniform in the region. The plots show global correlations among these interband ratios, supporting the same origin for these features (i.e., C-H out-of-plane bending mode).
In order to check robustness of the above results, we also evaluated the PAH features in the following model-independent manner: we used linear baselines of 5.8–6.5 , 7.1–8.3 , 8.3–8.8 , 10.8–11.8 , and 13.8–14.5 for the PAH 6.2 , 7.7 , 8.6 , 11.3 , and 14.2 features, respectively, to estimate their intensities. Figures 8, 9(a)-9(c), and 9(d) correspond to Figs. 3, 6(a)-6(c), and 7(d), as obtained in this method. We confirm from these figures that the linear-baseline-fitting results show overall consistency with the PAHFIT result. Galliano et al. (2008) showed that the PAH interband ratios are mostly independent of the approach isolating the PAH features.
4 Discussion
4.1 Spatial variations in the degree of PAH ionization
We find that the PAH 7.7 /PAH 11.3 ratio ranges from 2.6 to 9.0 with a median value of 5.2, suggesting that the degree of PAH ionization is significantly variable in M17SW. In order to derive a map of the degree of PAH ionization, we estimate the degree of ionization from the PAH 7.7 /PAH 11.3 ratio using the following equation in Joblin et al. (1996):
| (1) |
where , , and indicate the intensities of the PAH 7.7 and PAH 11.3 features, and the number density of PAHs, respectively. The zero and plus in the superscript indicate the neutral and ionized states, respectively. We assumed , , and to be 1.3, 5.54, and 0.6, respectively (Fleming et al. 2010), and converted the observed to . Finally, we obtained the degree of PAH ionization of .
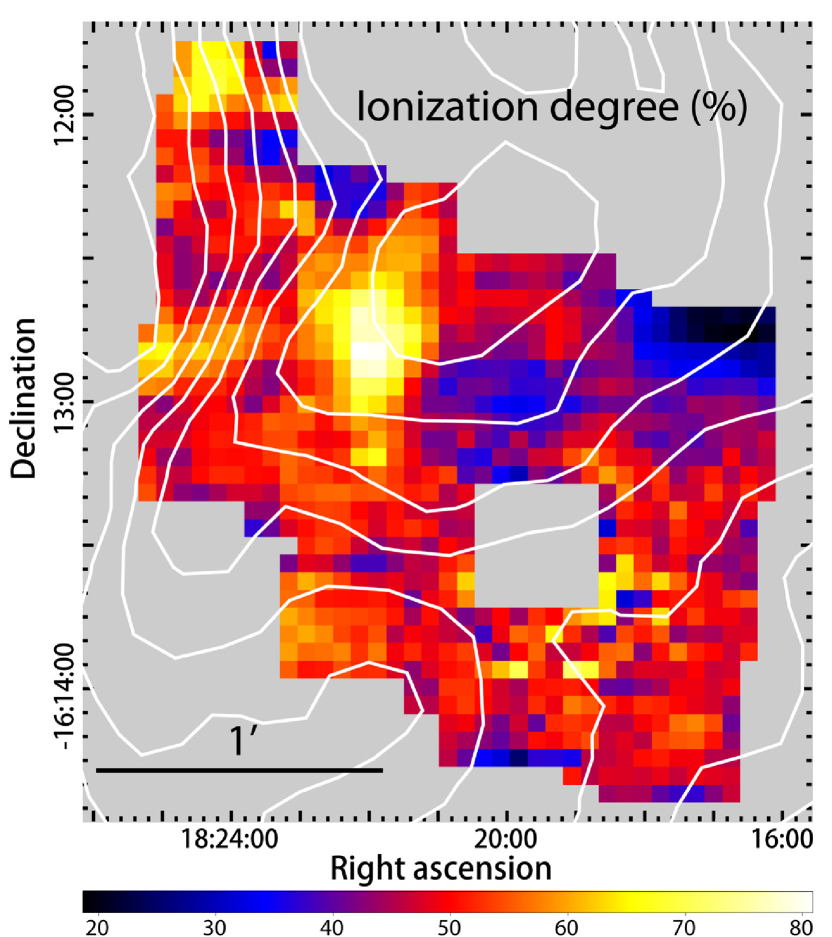
Figure 10 shows a map of the degree of PAH ionization thus derived. In the figure, the degree of PAH ionization ranges from 19 % to 81 % with a median value of 48 %. These values correspond to the ionization parameter, , of 9 to 1 (Tielens 2005), where , , and indicate the far-UV intensity normalized by that of the solar neighborhood, gas temperature, and electron density, respectively, and we assumed the number of carbon atoms in a PAH to be 50. Therefore, the degree of PAH ionization varies in a wide range from region to region, and typical PAHs are moderately ionized in M17SW. Such a situation is similar to the cases of the previous studies; the degree of PAH ionization is 10–70 % and typically 50 % in NGC 7023 (Boersma et al. 2013), while that is 20–100 % and typically 50 % in the Orion Bar (Haraguchi et al. 2012), although the approaches to determine the degree of PAH ionization are different between those studies and the present one. The minimum degree of PAH ionization of 15 % is common among the three objects, suggesting that PAHs in molecular clouds adjacent to star-forming regions are slightly ionized. The maximum degree of PAH ionization of 80% in M17SW is lower than that of Orion Bar and comparable to that in NGC 7023. This difference is presumably due to the difference in the observed positions; the exciting stars are covered in the observational area of Orion Bar, while those are not covered in those of M17 and NGC 7023.
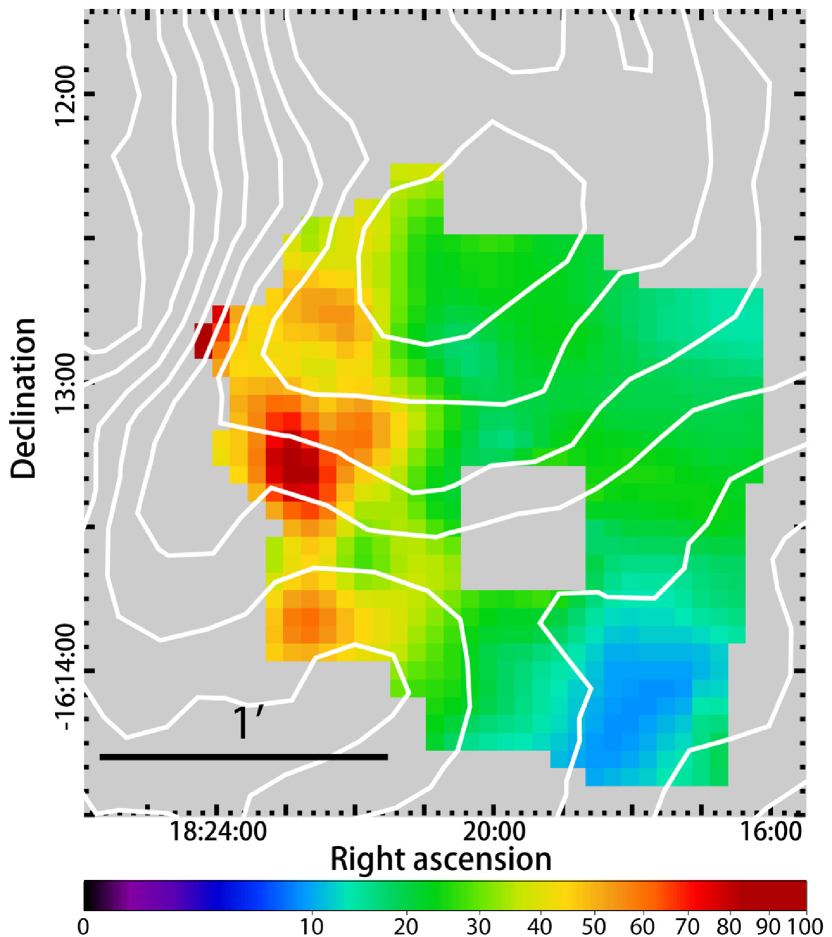
One interesting result in Fig. 10 is that the degree of PAH ionization is high near the peak of the 13CO emission. As expressed in the definition of the ionization parameter, the balance between the ionization and recombination is important in the degree of PAH ionization. The ionization depends on the far-UV radiation field, , while the recombination mainly depends on the electron density, . Therefore, we evaluate and to verify the spatial variation of the degree of PAH ionization. We determined with the Herschel/PACS 70 and 100 maps which we retrieved from NASA/IPAC Infrared Science Archives (Observation ID: 1342192767). We converted a 70 /100 color temperature to assuming the power-law dust emissivity index of =1 and the relation between and , (Boulanger et al. 1996). The derived map is shown in Fig. 11, where obvious HII regions show strong [NeII] () are masked out as the conversion is not applicable to HII regions. Electrons in PDRs are mainly produced by ionization of neutral carbon atoms. Therefore, [CII] is a possible probe of for a nearly constant gas temperature; a [CII] map of this region is obtained by Pérez-Beaupuits et al. (2012).
In Fig. 11, we find that the map exhibits a local maximum near the peak of the degree of PAH ionization, whereas the [CII] map in Pérez-Beaupuits et al. (2012) does not have a local minimum there. These results support the high degree of PAH ionization inside the molecular cloud, which is driven by high rather than low . Although M17SW is one of the most intensively studied regions in our Galaxy, the spatial structure in the line of sight is still unclear; Stutzki & Guesten (1990) and Sheffer & Wolfire (2013) proposed clumpy and bowl-shaped structures in M17SW, respectively. Therefore the local peak of the degree of PAH ionization may be due to geometrical effects, and in reality, this region can be located closely to the M17 center. This situation is, however, rather unlikely, because Fig. 7 shows no corresponding local peak in the interband ratios; such a region should also show variations in the PAH structure due to the intense UV radiation from the M17 center. It should be noted that the region with high PAH ionization degree is associated with dense gas probed by 13CO. Additionally, since PAHs are ionized by far-UV photons, B-type or later stars can substantially ionize PAHs. In this situation, such stars may be reasonable ionizing source candidates because the Br emission is not locally enhanced in the region (Fig. 5). Therefore, it is possible that B-type or later stars buried inside the molecular cloud locally ionize PAHs. As can be seen in Fig. 11, an even stronger peak is found at to the south, where the degree of PAH ionization does not show a significant increase (Fig. 10). Young stellar objects which cannot substantially ionize PAHs may attribute to the peak here.
4.2 Spatial variations of the PAH structure
In Figs. 7(a)-7(d), the ratios of the PAH 12.0, 12.7, 13.5, and 14.2 features to the PAH 11.3 feature have a strong peak near the M17 center. These interband ratios are possible probes of the PAH edge structures. Likely origins of these features are all C-H out-of-plane bending, but the numbers of adjacent C-H bonds in a benzene ring are different (PAH 11.3 : solo; PAH 12.0 : duo; PAH 12.7 : trio; PAH 13.5 and PAH 14.2 : quartet; Hony et al. 2001; Draine 2003; Tielens 2005). Therefore, Fig. 7 suggests that the PAH structure is not uniform in the observed region, but is different especially near the M17 center.
Among the interband ratios, the PAH 13.5 /PAH 11.3 and the PAH 14.2 /PAH 11.3 ratios are more localized toward the center of M17 relative to the PAH 12.0 /PAH 11.3 and the PAH 12.7 /PAH 11.3 ratios. Pencil-beam observations by Hony et al. (2001) observationally showed that the PAH 13.5 /PAH 11.3 and the PAH 14.2 /PAH 11.3 ratios in their HII-region samples tend to be higher than those in PDR samples. Our spectral maps clearly show such spectral variations in M17. One possible interpretation of the high interband ratios is processing of edgy PAHs. Since the survival time of edgy PAHs is short, edgy PAHs observed near the M17 center may be freshly released ones from grain mantles due to the intense UV radiation. Hence Figs. 7(a)-7(d) may suggest the active PAH erosion/destruction process at the PDR surface.
The plots in Figs. 7(e)-7(h) show overall good correlations between the interband ratios. Boersma et al. (2015) showed that the PAH 12.7 /PAH 11.3 ratio depends on both the degree of PAH ionization and the PAH edge structure. Since the spatial positions showing structural changes and high degree of ionization are different in the present study, our data may be useful to examine the dependence of the edge structure and the degree of PAH ionization on the PAH 12.7 /PAH 11.3 ratio. In Figs. 7(e)-7(g), the PAH 12.7 /PAH 11.3 ratios show good correlation with the ratios probing the PAH edge structure; the correlation coefficients are 0.78 (399), 0.76 (284), 0.92 (111), respectively. In Fig. 12, we also examine the correlation between the PAH 12.7 /PAH 11.3 ratios with the PAH 7.7 /PAH 11.3 ratios probing the degree of PAH ionization. In the figure, correlation is relatively weak (0.28, 418), suggesting that the PAH 12.7 /PAH 11.3 ratios depend more strongly on the PAH edge structure rather than the degree of PAH ionization in M17.
Comparing Figs. 7(e)-7(h) in detail, we find that there are small differences in the relation; the PAH 12.0 /PAH 11.3 and PAH 13.5 /PAH 11.3 ratios increase nearly in proportion to the PAH 12.7 /PAH 11.3 and PAH 14.2 /PAH 11.3 ratios, respectively (Figs. 7(e) and 7(h)). On the other hand, the PAH 13.5 /PAH 11.3 and PAH 14.2 /PAH 11.3 ratios do not increase in proportion to the PAH 12.7 /PAH 11.3 ratio, and there are apparent offsets in their relations (Figs. 7(f) and 7(g)). Hence, the PAH 12.0 and 12.7 intensities start to increase first and then increases in the PAH 13.5 and 14.2 intensities follow, relative to the PAH 11.3 intensity. The relative delay in the growth of the PAH 13.5 and 14.2 intensities suggests that processing of PAHs may gradually take place due to the intense (and/or hard) UV. The proportionality of the PAH 13.5 intensity to the PAH 14.2 intensity (Fig. 7(h)) supports that they are of the same origin (quartet C-H in-plane bending mode), as suggested by Tielens (2005).
5 Conclusion
Based on /IRS spectral mapping observations, we have examined spatial variations of the PAH properties around the M17SW region. We analyzed independent 990 spectra, which show prominent PAH features at wavelengths of 6.2, 7.7, 8.6, 11.3, 12.0, 12.7, 13.5, and 14.2 as well as fine-structure lines. We decomposed all the spectral features using PAHFIT (Smith et al. 2007b). As a result, the derived PAH emissions are bright in regions between HII regions traced by Br and molecular cloud regions traced by 13CO. Additionally, the PAH intensity maps show a large-scale gradient from the north-east to south-west, indicating that PAHs are irradiated by UV from the OB stars in the M17 center. By contrast, PAH interband ratio maps show no clear large-scale gradient but they are locally changed. These results suggest that the PAH ionization is mainly controlled by local conditions rather than the large-scale UV environment determined by the OB stars in the M17 center. The degree of PAH ionization estimated from the PAH 7.7 /PAH 11.3 ratios ranges from 19 to 81 % with a median value of 48 %, which is comparable to that in the previous studies for NGC 7023 and the Orion Bar. We also find that the degree of PAH ionization is high near the peak of the 13CO emission. We discuss the ionization balance using the and [CII] maps to find that /[CII] ratios show a local maximum inside the molecular cloud. We conclude that buried B-type or later stars may be important to determine the degree of PAH ionization in local conditions. Additionally, the PAH edge structures are examined by ratios of the PAH 12.0, 12.7, 13.5, and 14.2 features to the PAH 11.3 feature, which suggests that edgy PAHs are processed due to the intense (and/or hard) UV radiation especially near the M17 center.
References
- Allamandola et al. (1999) Allamandola, L. J., Hudgins, D. M., & Sandford, S. A. 1999, ApJ, 511, L115
- Allamandola et al. (1989) Allamandola, L. J., Tielens, A. G. G. M., & Barker, J. R. 1989, ApJS, 71, 733
- Bauschlicher et al. (2008) Bauschlicher, Jr., C. W., Peeters, E., & Allamandola, L. J. 2008, ApJ, 678, 316
- Bauschlicher et al. (2009) —. 2009, ApJ, 697, 311
- Berné & Tielens (2012) Berné, O., & Tielens, A. G. G. M. 2012, Proceedings of the National Academy of Science, 109, 401
- Berné et al. (2007) Berné, O., Joblin, C., Deville, Y., et al. 2007, A&A, 469, 575
- Boersma et al. (2014) Boersma, C., Bregman, J., & Allamandola, L. J. 2014, ApJ, 795, 110
- Boersma et al. (2015) —. 2015, ApJ, 806, 121
- Boersma et al. (2013) Boersma, C., Bregman, J. D., & Allamandola, L. J. 2013, ApJ, 769, 117
- Boersma et al. (2012) Boersma, C., Rubin, R. H., & Allamandola, L. J. 2012, ApJ, 753, 168
- Boulanger et al. (1996) Boulanger, F., Abergel, A., Bernard, J.-P., et al. 1996, A&A, 312, 256
- Cesarsky et al. (1996) Cesarsky, D., Lequeux, J., Abergel, A., et al. 1996, A&A, 315, L309
- Chan et al. (2001) Chan, K.-W., Roellig, T. L., Onaka, T., et al. 2001, ApJ, 546, 273
- Chini et al. (1980) Chini, R., Elsaesser, H., & Neckel, T. 1980, A&A, 91, 186
- Crété et al. (1999) Crété, E., Giard, M., Joblin, C., et al. 1999, A&A, 352, 277
- Croiset et al. (2016) Croiset, B. A., Candian, A., Berné, O., & Tielens, A. G. G. M. 2016, A&A, 590, A26
- Draine (2003) Draine, B. T. 2003, ARA&A, 41, 241
- Draine & Li (2007) Draine, B. T., & Li, A. 2007, ApJ, 657, 810
- Egusa et al. (2013) Egusa, F., Wada, T., Sakon, I., et al. 2013, ApJ, 778, 1
- Fleming et al. (2010) Fleming, B., France, K., Lupu, R. E., & McCandliss, S. R. 2010, ApJ, 725, 159
- Galliano et al. (2008) Galliano, F., Madden, S. C., Tielens, A. G. G. M., Peeters, E., & Jones, A. P. 2008, ApJ, 679, 310
- Giard et al. (1992) Giard, M., Bernard, J. P., & Dennefeld, M. 1992, A&A, 264, 610
- Giard et al. (1994) Giard, M., Bernard, J. P., Lacombe, F., Normand, P., & Rouan, D. 1994, A&A, 291, 239
- Hanson et al. (1997) Hanson, M. M., Howarth, I. D., & Conti, P. S. 1997, ApJ, 489, 698
- Haraguchi et al. (2012) Haraguchi, K., Nagayama, T., Kurita, M., Kino, M., & Sato, S. 2012, PASJ, 64, 127
- Hony et al. (2001) Hony, S., Van Kerckhoven, C., Peeters, E., et al. 2001, A&A, 370, 1030
- Houck et al. (2004) Houck, J. R., Roellig, T. L., van Cleve, J., et al. 2004, ApJS, 154, 18
- Jiang et al. (2002) Jiang, Z., Yao, Y., Yang, J., et al. 2002, ApJ, 577, 245
- Joblin et al. (1996) Joblin, C., Tielens, A. G. G. M., Geballe, T. R., & Wooden, D. H. 1996, ApJ, 460, L119
- Kaneda et al. (2005) Kaneda, H., Onaka, T., & Sakon, I. 2005, ApJ, 632, L83
- Kaneda et al. (2008) Kaneda, H., Suzuki, T., Onaka, T., Okada, Y., & Sakon, I. 2008, PASJ, 60, S467
- Kaneda et al. (2014) Kaneda, H., Ishihara, D., Kobata, K., et al. 2014, Planet. Space Sci., 100, 6
- Kondo et al. (2016) Kondo, T., Ishihara, D., Kaneda, H., et al. 2016, AJ, 151, 71
- Lada et al. (1991) Lada, C. J., Depoy, D. L., Merrill, K. M., & Gatley, I. 1991, ApJ, 374, 533
- Lebouteiller et al. (2011) Lebouteiller, V., Barry, D. J., Spoon, H. W. W., et al. 2011, ApJS, 196, 8
- Minamidani et al. (2016a) Minamidani, T., Nishimura, A., Miyamoto, Y., et al. 2016a, in Millimeter, Submillimeter, and Far-Infrared Detectors and Instrumentation for Astronomy VIII, Vol. 9914, 99141Z–99141Z–10
- Minamidani et al. (2016b) Minamidani, T., Umemoto, T., Nishimura, A., et al. 2016b, in EAS Publications Series, Vol. 75, EAS Publications Series, 193–194
- Nagashima et al. (1999) Nagashima, C., Nagayama, T., Nakajima, Y., et al. 1999, in Star Formation 1999, ed. T. Nakamoto, 397–398
- Nagayama et al. (2003) Nagayama, T., Nagashima, C., Nakajima, Y., et al. 2003, in Society of Photo-Optical Instrumentation Engineers (SPIE) Conference Series, Vol. 4841, Instrument Design and Performance for Optical/Infrared Ground-based Telescopes, ed. M. Iye & A. F. M. Moorwood, 459–464
- Peeters et al. (2002) Peeters, E., Hony, S., Van Kerckhoven, C., et al. 2002, A&A, 390, 1089
- Pérez-Beaupuits et al. (2012) Pérez-Beaupuits, J. P., Wiesemeyer, H., Ossenkopf, V., et al. 2012, A&A, 542, L13
- Pilleri et al. (2012) Pilleri, P., Montillaud, J., Berné, O., & Joblin, C. 2012, A&A, 542, A69
- Povich et al. (2007) Povich, M. S., Stone, J. M., Churchwell, E., et al. 2007, ApJ, 660, 346
- Rapacioli et al. (2005) Rapacioli, M., Joblin, C., & Boissel, P. 2005, A&A, 429, 193
- Reach et al. (1996) Reach, W. T., Abergel, A., Boulanger, F., et al. 1996, A&A, 315, L381
- Ricca et al. (2012) Ricca, A., Bauschlicher, Jr., C. W., Boersma, C., Tielens, A. G. G. M., & Allamandola, L. J. 2012, ApJ, 754, 75
- Sakon et al. (2007) Sakon, I., Onaka, T., Wada, T., et al. 2007, PASJ, 59, S483
- Sheffer & Wolfire (2013) Sheffer, Y., & Wolfire, M. G. 2013, ApJ, 774, L14
- Skrutskie et al. (2006) Skrutskie, M. F., Cutri, R. M., Stiening, R., et al. 2006, AJ, 131, 1163
- Smith et al. (2007a) Smith, J. D. T., Armus, L., Dale, D. A., et al. 2007a, PASP, 119, 1133
- Smith et al. (2007b) Smith, J. D. T., Draine, B. T., Dale, D. A., et al. 2007b, ApJ, 656, 770
- Stock et al. (2016) Stock, D. J., Choi, W. D.-Y., Moya, L. G. V., et al. 2016, ApJ, 819, 65
- Stutzki & Guesten (1990) Stutzki, J., & Guesten, R. 1990, ApJ, 356, 513
- Tielens (2005) Tielens, A. G. G. M. 2005, The Physics and Chemistry of the Interstellar Medium
- Tielens (2008) —. 2008, ARA&A, 46, 289
- Xu et al. (2011) Xu, Y., Moscadelli, L., Reid, M. J., et al. 2011, ApJ, 733, 25
- Yamagishi et al. (2010) Yamagishi, M., Kaneda, H., Ishihara, D., et al. 2010, PASJ, 62, 1085
- Yamagishi et al. (2012) —. 2012, A&A, 541, A10