Dependence of X-Ray Burst Models on Nuclear Reaction Rates
Abstract
X-ray bursts are thermonuclear flashes on the surface of accreting neutron stars and reliable burst models are needed to interpret observations in terms of properties of the neutron star and the binary system. We investigate the dependence of X-ray burst models on uncertainties in (p,), (,), and (,p) nuclear reaction rates using fully self-consistent burst models that account for the feedbacks between changes in nuclear energy generation and changes in astrophysical conditions. A two-step approach first identified sensitive nuclear reaction rates in a single-zone model with ignition conditions chosen to match calculations with a state-of-the-art 1D multi-zone model based on the Kepler stellar evolution code. All relevant reaction rates on neutron deficient isotopes up to mass 106 were individually varied by a factor of 100 up and down. Calculations of the 84 highest impact reaction rate changes were then repeated in the 1D multi-zone model. We find a number of uncertain reaction rates that affect predictions of light curves and burst ashes significantly. The results provide insights into the nuclear processes that shape X-ray burst observables and guidance for future nuclear physics work to reduce nuclear uncertainties in X-ray burst models.
1. Introduction
Type I X-ray bursts are the most frequently observed thermonuclear explosions in nature (Schatz2006a; Strohmayer2006; Lewin93; Parikh2013). They take place on the surface of accreting neutron stars in low-mass X-ray binary systems for a certain range of mass transfer rates, generally within two orders of magnitude below the Eddington mass accretion rate (; Woosley1976; Joss1977; Fujimoto1981; Strohmayer2006). Since these events are not cataclysmic, bursts will repeat with recurrence times ranging from hours to days. The importance of understanding X-ray bursts as a probe of neutron star properties and the underlying physics has been discussed extensively (Lewin93; Steiner2010; Zamfir2012; Ozel2013; Guver2013).
The bursts are powered by the triple- reaction, the p-process and the rapid proton capture process (rp-process; Wallace1981; VanWormer1994; Schatz1998; Schatz2001; Fisker2008; Woosley2004a; Jose2010). These nuclear processes involve hundreds of nuclear species from stable isotopes to the proton drip line. Models predicting burst light curves and the composition of the burst ashes are therefore sensitive to a broad range of uncertain nuclear structure and reaction properties near and beyond the current frontier of experimental knowledge. This limits interpretation of the vast body of observational data that has been accumulated (Galloway2008), for example in the MINBAR data base which will eventually contain X-ray light curve data of over 5000 X-ray bursts (Galloway2010).
Models with reliable nuclear physics are needed to validate the astrophysical model assumptions through comparison with observations, to guide future model developments towards an understanding of the full variety of observed bursting behavior, and to constrain parameters such as distance, accretion rate, accreted composition, and neutron star properties (Heger2007; Galloway2004). An example for the latter are recent attempts to constrain the neutron star surface gravity by matching a set of model bursts to observed light curves (Zamfir2012).
Whereas the X-ray light curve is the main direct observable of X-ray bursts, accurate nuclear physics is also needed to predict the composition of the burst ashes. Reliable calculations of this composition are required to predict potential spectroscopic signatures in the X-ray burst light curve from small amounts of ejected material (Weinberg2006) and to predict the composition of the neutron star crust, which in mass accreting systems is made in part or entirely out of X-ray burst ashes. Of particular importance is the amount of 12C, which may reignite at greater depth (Cumming2001; Strohmayer2002; Cumming2006) and explain the origin of occasionally observed superbursts (Keek2008; Keek2011). The thermal transport properties of the neutron star crust, as well as the amount of heating and cooling through weak interaction processes (Haensel2008; Gupta2007; Schatz2014) also depend sensitively on composition.
The goal of this paper is to identify important reaction rates that affect observables and nucleosynthesis. Besides nuclear reaction rates, burst models also depend on -decay rates and masses of neutron deficient nuclei. All relevant -decay rates have been determined experimentally (Schatz2006a), and corrections due to the high densities and temperatures reached in X-ray bursts are predicted to be small in most cases (FFN1982; Pruet2003). However, the validity of these corrections remains to be evaluated in detail. The majority of the relevant nuclear masses has been measured as well. The impact of remaining mass uncertainties has been discussed elsewhere (Schatz2006; Parikh2009; Kankainen2012). However, the rates for the vast majority of nuclear reactions occurring in X-ray bursts have not been determined experimentally and have large uncertainties. We therefore focus here on the sensitivity of X-ray burst models to nuclear reaction rates to provide guidance for future experimental efforts aimed at reducing the remaining nuclear physics uncertainties in X-ray burst models.
Comprehensive studies of the sensitivity of X-ray burst models to nuclear reaction rates have so far been limited to single-zone post-processing studies. Parikh2008 varied 3500 nuclear processes individually, and concurrently in a Monte Carlo approach, using fixed temperature and density profiles from various previously published X-ray burst models. An important result was the lack of additional sensitivities due to correlations among reaction rates in the Monte Carlo approach, justifying the single reaction rate variation approach to nuclear sensitivity studies for X-ray bursts that we also adopt here.
Post-processing studies with fixed temperature and density profiles, however, are not adequate to study nuclear sensitivities in X-ray bursts (Thielemann2001) because the entire reaction sequence contributes to the energy release driving the burst. Changes in reaction rates inevitably lead to changes in energy production, thereby to changes in the temperature and density evolution of the burst sequence. It is therefore essential to ensure consistency between the nuclear physics input and the temperature and density evolution. Owing to computational limitations, however, sensitivity studies in fully self-consistent dynamic X-ray burst models have so far been limited to variations of a few individual reactions or a few groups of reactions. Thielemann2001 varied the proton capture rates on , , , and together, rather than individually, in a 1D multi-zone X-ray burst model and demonstrated their strong influence on the light curve, in contrast to a post processing study that found these reactions to be unimportant (Iliadis1999). Fisker2004a varied the (,p) and (,p) reaction rates and demonstrated their impact on doubly peaked burst profiles. Woosley2004a varied groups of -decay rates to simulate the potential impact of proton capture rate uncertainties on the burst light curve and found a very strong sensitivity. However, this only provides a crude estimate of how the overall processing speed of the rp-process may affect observables. It does not provide any insights into which proton capture rates may be important, nor whether proton capture rates are important at all. Fisker2006 determined a new lower limit of the (,) reaction rate and showed that bursts disappear altogether when that reaction rate is at that lower limit. Davids11, however, did not find such an effect using a different X-ray burst model. More recently Keek2014 explored the impact of variations of the 3, 15O(,) and 18Ne(,) reaction rates on the transition from unstable to stable burning in a multizone X-ray burst model.
Here we present a comprehensive study of the sensitivity of X-ray burst models to 1931 nuclear reaction rates using for the first time self-consistent X-ray burst models that account for the coupling between nuclear energy generation and the astrophysical conditions that determine the reaction sequences. Our approach is enabled by the use of two models. A calibrated, self-consistent one-zone model (Schatz2001) is used to explore variations of all reaction rates. A subset of relevant rates is then investigated further using a state-of-the-art 1D multi-zone burst model based on the Kepler code (Woosley2004a).
2. Method
In nature, the characteristics of X-ray bursts and the relevant nuclear reaction sequences vary between sources depending on accreted composition and neutron star properties, and even vary, for a given source, with time depending on the mass accretion rate. See Galloway2008 for a comprehensive overview of the range of observed burst properties and their dependence on source state, accretion rate, and accreted fuel composition. Lampe2015 provide a broad exploration of the impact of variations in astrophysical parameters on burst characteristics for the KEPLER burst model also employed here. We focus here on systems that accrete a mix of hydrogen and helium at high accretion rates, resulting in helium ignition in a mixed hydrogen and helium environment (burning regime 3 in Strohmayer2006). Bursts in this regime are powered by the p-process and the rp-process and exhibit extended burst tails. GS 1826-24 is the most studied source in this regime, and has served as a benchmark for X-ray burst models (Heger2007). Other sources in this regime are the low high sources in Fig 14. of Galloway2008 with being the ratio of energy released as persistent flux to energy released in bursts, and being the burst time scale.
To examine the effect of nuclear reactions we use the multi-zone hydrodynamics code Kepler (Woosley2004a). The full 1-D multi-zone model divides the envelope of the star into zones which have independent isotopic abundances. This allows the model to simulate burning processes and energy transport in full 1-D. In addition extended sequences of bursts are calculated where ashes from earlier bursts affect later ones, an effect known as compositional “inertia” (Taam1980). Kepler has been shown to reproduce the GS 1826-24 light curve reasonably well (Heger2007).
Full 1-D models require a large amount of computing time. We therefore use a single-zone model of Schatz2001 to first identify the most sensitive reactions and then determine the multi-zone model sensitivity to this subset of reactions. We have found that our single zone model approximates well the light curve and final composition calculated by Kepler if the ignition conditions are chosen properly. Single-zone models that calculate changes of temperature and density conditions induced by changes in reaction rates self-consistently are more physical than a post-processing calculations, given that many reactions along the rp- and p-processes affect the energy generation in X-ray bursts.
Our approach consists of the following steps: (1) We select ignition conditions for our one-zone model (pressure and composition) from among the conditions in the various zones of our Kepler model just prior to the ignition of a typical burst (see below), such that the light curve and final composition agree as closely as possible with the Kepler results. (2) We select a set of 1931 (p,), (,), and (,p) reactions along and near the reaction sequence in the one-zone model that spans the nuclear mass range of –. (3) We vary each reaction, together with its inverse as determined by detailed balance, by a factor of 100 up and down and we rank reactions by their impact on the light curve and, in a separate ranking, on the composition. (4) We then vary the most important reactions in Kepler, together with other reactions that have been identified as being important in X-ray bursts in the literature.
The factor 100 for the single zone variations was chosen as a worst case uncertainty to ensure no sensitivity is missed. This ensures we err on the inclusive side for the selection of reactions varied in subsequent multi-zone calculations. Such large uncertainties can occur for reactions that are dominated by a small number of resonances (Clement2004) and were also found, as extreme cases, in comparisons of rates calculated with the theoretical Hauser-Feshbach approach (NON-SMOKER) (the majority of reactions investigated here) with experimental data (Parikh2013; Deibel2011). Even with these large variations, the number of reactions that cause significant light curve changes was still manageable. For the reaction rate variations in Kepler we reduce the factor of variation in cases where the reaction rate error is likely to be much smaller. We emphasize that the goal here is not to provide a realistic uncertainty estimate but to identify important reactions. Variations are therefore chosen to overestimate rather than underestimate uncertainties to ensure identification of important reactions. Modifications to the light curve and composition for different variation factors may be roughly estimated using our results, if, for example a detailed analysis of reaction rate uncertainty is carried out in a particular case.
As baseline nuclear physics input, we adopt thermonuclear and ground state weak rates and the corresponding nuclide properties (e.g. masses and partition functions) from the snapshot library ReaclibV1.0 from the JINA REACLIB Database (Cyburt2010), the most up-to-date library at the beginning of this study. We also adopt temperature and density dependent weak rates from FFN1982 and Pruet2003. Test calculations carried out with the rates from Oda1994 did not show any significant differences.
2.1. Multi-zone Model
The 1D multi-zone X-ray burst model used in this study is based on the hydrodynamics code Kepler (WZW78), and is discussed in detail in Woosley2004a. This model couples the energy generation of a complete, adaptive nuclear reaction network of over 1300 isotopes to a one-dimensional hydrodynamic simulation of the accretion on an adaptive Lagrangian grid, nuclear burning, radiative and convective energy transport, and mixing of the isotopic composition both during and between bursts. A “smooth” accretion scheme as well as an updated implementation of electron conduction are employed (Keek2011). The radial dimension of the accreted layer is resolved into typically around 200 zones. The model follows a sequence of bursts taking into account steady state nuclear burning in-between bursts and compositional inertia effects, where ashes from preceding bursts partially mix with freshly accreted material and affect the nuclear processes in subsequent bursts.
The specific accretion model used for these studies is model ZM from Woosley2004a, with solar metallicity material (hydrogen mass fraction , helium mass fraction , and 14N mass fraction 0.0200) accreted at a rate of , roughly of the Eddington mass accretion rate. This model represents a typical burster powered by mixed hydrogen and helium burning producing longer bursts with timescales well beyond s, up to minutes (Galloway2004). A version of this model at slightly lower accretion rate produced the best agreement with observations to date (Heger2007).
The neutron star is taken to be 10 km in radius and to have a mass of . Since this study involves no comparison to observational data, the general relativistic correction from the neutron star frame to an observer at infinity will be neglected (Woosley2004a). All times are therefore given in the reference frame of the neutron star surface.
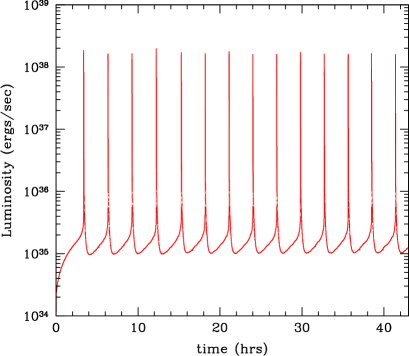
The multi-zone X-ray burst model was first run for a long sequence of bursts () using the unmodified baseline reaction rate database, Reaclib v1.0. The long sequence of bursts serves as a baseline and ensures enough burst statistics to characterize steady state burst properties, including burst-to-burst variations that affect the identification of sensitivities to reaction rate changes. The models with varied reaction rates were run for shorter times for a set number of simulation timesteps. This limits the computational time needed for each run. Because the time step size in Kepler is dynamically adjusted to optimally resolve the time-dependent behavior, the total simulation time varies among the multi-zone simulations. The multi-zone model calculations with individual reaction rate variations generally produced about 14 bursts, but in all cases, a continuous sequence of at least 12 bursts was simulated. This is sufficient to ensure convergence into a steady state bursting behavior.
The burst lightcurves are shown in Fig. 1 and Fig. 4. The first burst is special, because it occurs atop an inert neutron star substrate (assumed as iron for the purpose of heat conduction) though in this model it turns out to be quite similar to the following bursts. Already the second burst is very similar to the remaining bursts and there is no evidence for systematic variation beyond the second burst indicating that reasonable steady state equilibrium is achieved beginning with the third burst. At this point bursts occur rather regularly, with a recurrence time of minutes, peak luminosity of ergs s-1, and a total energy released during the burst, ergs, (all numbers given in the local neutron star surface reference frame). The quoted uncertainties are standard deviations and stem from the remaining intrinsic burst-to-burst variations. These variations do not decrease with the number of bursts and are a feature of the steady state behavior of the model. In steady state, bursts have a rise time of s from to of , and a duration of s. The (rise) to (decline) luminosity burst duration is s.
In Fig. 4 the burst luminosity profiles are shown, shifted in time to align the peak luminosities of all bursts. Burst-to-burst variations not only affect recurrence time and peak luminosity, but also the shape of the light curve.
This study requires direct comparison of two light curve sequences calculated with different nuclear physics. The burst-to-burst variations need to be taken into account for this comparison. In order to define a light curve for comparison, we take the ensemble of bursts starting with the third burst, shift each burst to align the peak luminosity in time, and resample all bursts on a common time grid using linear interpolation. The surface resolution of our model is finer than what was used by Heger2007, with the mass of the outer zone being up to 100 times lower. At times when the burst is brightest, an individual zone near the surface may get a “kick”, and its behavior differs briefly from the rest of the outer zones. To prevent this from influencing the simulated light curve, we average the luminosity of the outer-most 9 zones and smooth over a scale of one second to remove any numerical noise. At each point in time we consider the variations in luminosity from all remaining bursts, and determine the average luminosity and its error. This average light curve with error band is used for our sensitivity study. Using an average is justified because observationally precise burst light curves can also be obtained by averaging long sequences of bursts (Galloway2004).
We also investigate the sensitivity of the steady-state burst ashes to nuclear reaction rate variations. This steady-state burst ashes of a burst sequence is determined in the following way: The deepest zones at the end of our multi-burst simulation sequence are special as they represent the ashes of the first bursts before a steady-state burst behavior was achieved. Similarly to the procedure adopted for the light curves, we therefore remove ashes from the first two bursts from our analysis to prevent anomalous zones from contributing. Too-shallow zones also have to be excluded as they will continue to be modified by subsequent bursts and therefore do not represent the steady-state ashes. Clearly this includes zones that still contain hydrogen. Deep unburned helium, however, can also be burned during heating from bursts occurring in shallower regions (Woosley2004a). This can be seen in Fig. 2 where the helium mass fraction successively decreases with increasing depth. As the helium mass fraction becomes lower, the modifications in the ashes induced by burning of residual helium become less important. We therefore exclude shallow zones with helium mass fractions above from the calculation of our final composition. For a typical burst model used with the reaction rate variations, these constraints result in an averaging of the final composition over a depth range of g (see Fig 2). We chose the time (rounded to nearest 100th time-step, as one in every 100 steps is stored) at which the light curve is minimum after the burst as our point for determining this composition.
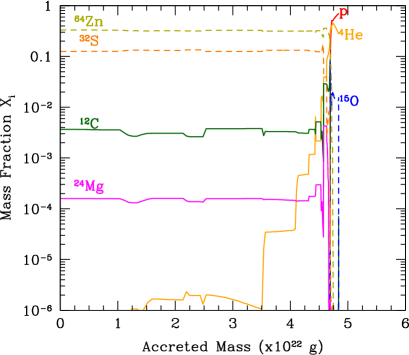
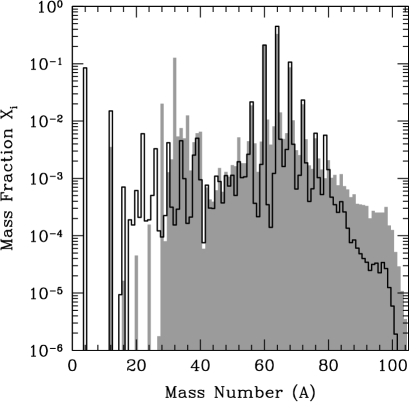
Fig. 3 shows the resulting isobaric ash composition. The abundance peak around stems from the impedance of the nuclear reaction sequence caused by the shell closure at the waiting point, whereas the abundance peaks around are produced by the , , and rp-process waiting points, which have particularly long half-lives despite being located at the proton drip line (Schatz1998). The NiCu and ZnGa cycles further enhance abundances in this mass region (VanWormer1994). The -chain isotopes () are further enhanced by late helium burning once hydrogen is consumed. The time and zone integrated reaction flow during a typical X-ray burst is shown in Fig. LABEL:FigMZ_path to illustrate the type of reactions that occur.
2.2. Single Zone model
The one-zone model ONEZONE is similar to the model of Koike1999 and has been used previously to estimate the reaction sequence of the rp-process (Schatz2001). It evolves thermodynamic conditions and composition in a single zone, neglecting gradients in temperature, density, and composition, as well as radiative transport and convection. ONEZONE assumes nuclear burning at constant pressure . This is justified, as mass accretion during the burst is negligible and only little material is ejected. As the burning happens in a thin layer on the surface, the influence of the neutron star is fully characterized through the surface gravity (neglecting magnetic fields and rotation). The evolution of the temperature starting at burst ignition is calculated for a time step using with the specific heat capacity at constant pressure , the positive specific nuclear energy generation rate , the negative specific surface cooling rate , and the negative specific neutrino loss rate .
| (1) |
is calculated from the abundance changes using atomic mass excesses , assuming positrons emitted in decays are annihilated instantly. For X-ray burst conditions, is entirely due to neutrinos emitted in decays. The respective energy losses are taken from FFN1982; Pruet2003. is approximated as (Fujimoto1981)
| (2) |
where the opacity is calculated according to Schatz1999. is the radiation constant, the speed of light, and the column density. The mass density change during a time step is calculated from and using an equation of state that includes the pressure of the radiation and of a partially degenerate electron gas (Paczynski1983). The model is coupled to an implicitly solved nuclear reaction network including 688 nuclei from hydrogen to tellurium, which for a given and calculates . We used the same reaction rates as in the multi-zone model.
ONEZONE needs to be coupled with a model predicting the ignition conditions. In the past, a full 1D steady-state hydrogen and helium atmosphere model has been used that evolves the composition as a function of depth during the accretion process until a thermal instability criterion is fulfilled (Cumming2000). Pressure and composition at that location are then used as initial conditions for ONEZONE. The ignition temperature is not a critical parameter due to the steep temperature rise at the beginning of an X-ray burst. The initial temperature is chosen to be just high enough to initiate a thermonuclear runaway in ONEZONE on a timescale that is sufficiently short to not modify the composition further by any steady state burning. The results for burst timescale, major reaction sequence, and final composition have been shown to agree reasonably well with the first burst calculated with Kepler (Woosley2004a) and other multi-zone models (Fisker2008; Jose2010). The details of the light curve cannot be predicted accurately, as expected for a one-zone model without radiation transport. As the energy generation and the reaction network are coupled self-consistently, however, ONEZONE can be used to explore the sensitivities of energy generation and the X-ray burst light curve to nuclear reaction rate changes, provided realistic ignition conditions are chosen.
Our goal here is for the single-zone model to most closely resemble a typical burst of the multi-zone model calculation, not the first burst. We therefore extract the ignition conditions for ONEZONE from the baseline calculation of our multi-zone burst model shortly before a typical burst is ignited. The ignition time is defined by significant breakout from the CNO cycle via the 15O(,) reaction, and is identified from a peak in the abundance. The ONEZONE model ignition conditions are taken at that time from the zone for which the ONEZONE results for light curve and final composition most closely resemble the multi-zone model results for total luminosity and steady state composition. The chosen ignition conditions were a temperature of GK, a pressure of erg cm-3, and hydrogen and helium mass fractions of and , respectively.
With these ignition conditions, the peak temperature in ONEZONE agrees with the peak temperature in the hottest zone of the multi-zone model (1.2 GK). Figs. 3 and 4 show that ONEZONE does predict the burst light curve and ashes composition reasonably well. The main difference in the light curve is the sudden drop in luminosity defining the end of the burst in the single-zone model. This is mainly the result of the absence of radiation transport modeling in the one-zone model. As far as the burst ashes are concerned, ONEZONE predicts quite well the main features of the composition, including the peak and subsequent abundance drop, and the main components of the ashes at , , , , , and . The main difference is the additional helium burning in the multi-zone model, which is induced by heating of the ashes in subsequent bursts and is not included in the one-zone approach. Compared to the single-zone results, this helium burning leads to the depletion of helium and other nuclei, which serve as seeds for -capture reactions, and the build up of heavier -chain nuclides at and . A less important difference is the enhancement in the multi-zone calculation of the only weakly produced mass chains with owing to the broader range of rp-process freeze out conditions in multiple zones. The ONEZONE reaction flow shown in Fig. 3.2 is indeed similar to the reaction flow in the multi-zone model during an X-ray bursts (see Fig. LABEL:FigMZ_path).
Based on the similarities between ONEZONE and the multi-zone model we expect that reaction rate sensitivities in the p- and rp-process during a burst can be reasonably well approximated in ONEZONE, with the caveat that lower temperature and density zones contribute to some extent in the multi-zone model. On the other hand, reaction rate sensitivities related to inter-burst burning, for example in the CNO region, and reaction rate sensitivities related to deep helium burning triggered by subsequent bursts, such as sensitivity to -capture reactions, are not expected to be present in ONEZONE as those burning regimes are not included in the single-zone simulation.

3. Results
In order to quantify the impact of a particular reaction rate variation on X-ray burst model light curve predictions, we define
| (3) |
Here, is the lightcurve of each variation , and is the luminosity of the baseline model. For the multi-zone model and are averaged over multiple bursts in the burst sequence. In addition we provide a qualitative classification of the degree of light curve variation caused by the change of a particular reaction rate. Category 1 changes are the largest changes that likely would by themselves affect the interpretation of observational data. Category 2 changes are smaller changes, that may nevertheless be observable given, for example, observational error bars that can be achieved by averaging light curves (Galloway2004). Category 3 changes are insignificant, but confirm that the varied rate is part of the reaction path and may become significant for larger variations.
The composition of the burst ashes is summed by mass number as electron captures will change the isotopic composition with increasing depth within a constant mass number chain. Summing by mass number allows averaging over a greater depth range as it removes the effects of changes in the composition due to the decay of long-lived radioactive isotopes and weak interactions in the ocean and crust of the neutron star, which are not of interest here.
3.1. Single-zone model results
A total of 1,931 (p,), (,p), and () reactions, together with their respective inverse reactions, were varied individually in the single-zone burst model by factors of 100 up and down. The reactions selected were those at or near the time integrated reaction flow sequence of the baseline single zone model (see Fig. 3.2).
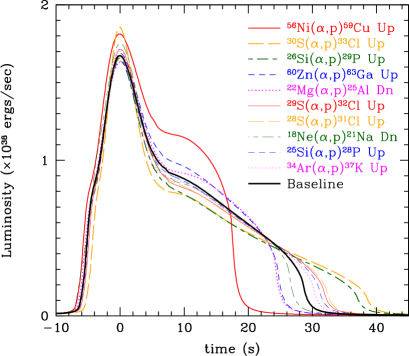
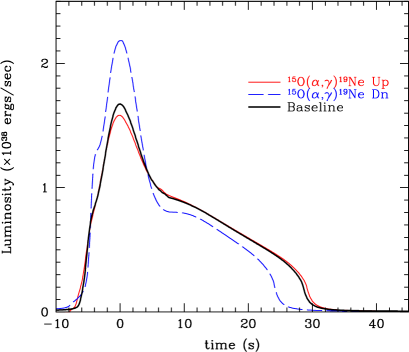
As expected, the number of individual reaction rate variations that affect the burst light curve significantly (Category 1) is rather small. Fig. 5 and Fig. 6 show the largest resulting variations in the light curve. A large light curve change is produced by variations in 7 (p,) reactions, 7 (,p) reactions, and the 15O(,)19Ne reaction (see also Tab. 1 and Fig. 3.2). By far the largest change is produced by varying the 59Cu(p,)60Zn and 59Cu(p,)56Ni rates, because a low 59Cu(p,) rate or a high 59Cu(p,)56Ni rate lead to the formation of a stronger NiCu cycle (VanWormer1994) that strongly limits synthesis of heavier nuclei. The critical quantity determining the strength of the NiCu cycle is the ratio of the (p,) to (p,) reaction rates at 59Cu. The 15O(,)19Ne reaction rate has a strong impact on the total luminosity and leads to a strongly increased peak energy release when lowered. Variations of 4 additional Category 2 reactions listed in Tab. 1 cause smaller, but still significant changes in the light curve. An additional 9 reactions do have some noticeable impact on the light curve, but rate variations of much more than a factor of 100 will be needed for a significant change. We included the top 28 reactions in the multi-zone variations.
| Rank | Reaction | TypeaaUp (U) or down (D) variation that has the largest impact | Sensitivitybb in units of 1017ergs/g/s | Category |
|---|---|---|---|---|
| 1 | (,p) | U | 12.5 | 1 |
| 2 | (p,) | D | 12.1 | 1 |
| 3 | (,) | D | 7.9 | 1 |
| 4 | (,p) | U | 7.8 | 1 |
| 5 | (,p) | U | 5.3 | 1 |
| 6 | (p,) | D | 5.0 | 1 |
| 7 | (p,) | U | 4.8 | 1 |
| 8 | (p,) | D | 4.4 | 1 |
| 9 | (p,) | D | 3.8 | 1 |
| 10 | (,p) | U | 3.6 | 1 |
| 11 | (,p) | D | 3.5 | 1 |
| 12 | (p,) | D | 3.4 | 1 |
| 13 | (,p) | U | 2.8 | 1 |
| 14 | (,p) | U | 2.7 | 1 |
| 15 | (p,) | U | 2.7 | 1 |
| 16 | (p,) | U | 2.5 | 2 |
| 17 | (,p) | D | 2.3 | 2 |
| 18 | (,p) | U | 1.9 | 2 |
| 19 | (p,) | D | 1.7 | 2 |
| 20 | (,p) | U | 1.6 | 3 |
| 21 | (,p) | U | 1.4 | 3 |
| 22 | (p,) | D | 1.1 | 3 |
| 23 | (p,) | U | 1.0 | 3 |
| 24 | (,p) | U | 1.0 | 3 |
| 25 | (p,) | D | 0.9 | 3 |
| 26 | (p,) | D | 0.8 | 3 |
| 27 | (p,) | D | 0.8 | 3 |
| 28 | (p,) | D | 0.8 | 3 |
The composition of the burst ashes is affected by a much larger number of reactions. Tab. 5 and Fig. 3.2 list reactions for which a factor of 100 change (either up or down) of the rate leads to at least a factor of 2 change in the mass fraction of a mass chain with significant () mass fraction. The maximum ratio listed in Tab. 5 gives the largest change in the mass fraction of a mass chain, calculated for each mass chain as or, if less than 1, its inverse. Also listed are the mass chains with changes of a factor of 2 or more and 10 or more, respectively. For 21 reactions, changes in the rate by a factor of 100 lead to mass fraction changes in the composition of the burst ashes of a factor of 10 or more (as defined above). For an additional 75 reactions abundance changes range between a factor of 2 and 9. Whereas most reactions affect only a small number of final mass chains in a significant way, typically mass numbers close to the nuclei involved in the reaction, there are a few reactions that affect the final composition broadly. As expected, these tend to be the same reactions that have a significant impact on the burst light curve (see Tab. 1). In some cases, such as 15O(,)19Ne, the broad compositional changes induced by a reaction that strongly affects the light curve are less than a factor of 2 and therefore do not appear in Tab. 5.
In total 84 reactions were selected to be explored further in the multi-zone model analysis. This includes all reactions that were found to affect the burst light curve significantly, but only a subset of the reactions that affect the final composition (see reactions marked in Tab. 5 and in Fig. LABEL:FigMZ_path).
3.2. Multi-zone model results
The selected 84 reactions were varied individually in the multi-zone model Kepler, for a total of 168 calculations, each with a full sequence of typically 13-15 bursts. The rate variation factors are listed in Tab. 3.2. A factor of less than 100 was chosen in cases where the reaction rate uncertainty is likely much smaller. These are mostly reaction rates calculated with the Hauser-Feshbach approach that are closer to stability, where statistical methods should be well applicable (reduction to a factor of 10), (,p) reactions where limited experimental data hint at a total uncertainty span of a factor of 100 (for example (Parikh2013; Deibel2011), and, in a few cases, reaction rates where some experimental information is available. We do note that with a few exceptions none of the reactions are solely based on direct experimental measurements. The goal was not to determine realistic uncertainties but to err on the side of a larger variation while still minimizing cases where a reaction rate is flagged as important even though it is sufficiently well known. In cases where reaction rates are calculated using shell model information and are dominated by contributions from a few resonances, we calculated upper and lower limits by varying resonance energies by the experimental uncertainty or, when not known experimentally, by 200 keV (see Tab. 3.2). During this study a compilation of reaction rate uncertainties was published for a small subset of the reactions of interest here (Iliadis2010). In cases where the new rate uncertainties did not agree within an order of magnitude and, if available, the larger variation showed a significant impact on light curve and composition, we reran the multi-zone model calculation with a new variation factor estimate based on the data in Iliadis2010 for a confidence range (see Tab. 3.2). This 3 confidence range was chosen to be conservative as we want to make sure we are not missing an important sensitivity.
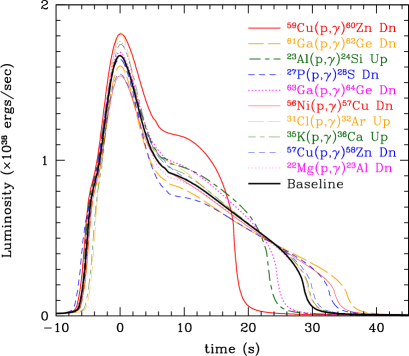
The reaction rate variations that were found to have a significant impact on the burst light curve are listed in order of significance in Tab. 3.2 and Fig. LABEL:FigMZ_path. There are 8 reaction rate variations that affect the light curve strongly (Category 1) (Fig. 3.2). An additional 11 reaction rate variations lead to smaller but still significant changes (Category 2, see Fig. 7 for examples). We also provide the value for as defined in Eq. 3. Note that while tends to be large for reaction rate variations with a strong impact on the light curve, it does not always provide a reliable quantitative measure for ranking the significance of the light curve impact. weighs changes near peak luminosity more strongly (which may be relevant for some model applications but not for others), and it can become artificially large for small shifts in burst rise or decline, as is for example the case for the (,p) rate variation.
Tab. 6 and Fig. LABEL:FigMZ_path summarize the significant composition changes (at least a factor of 2 change for a mass chain with mass fraction , see above) induced by the reaction rate variations explored in the multi-zone model. A total of 47 rate variations produce changes of more than a factor of 2 in at least one mass chain, whereas 14 result in changes of a factor of 10 or more. For the multi-zone calculations, changes are defined as the ratio between the up and the down variation. Note that this definition differs from what was used for the single-zone model analysis, where changes were defined relative to a baseline calculation. This addresses ambiguities in the definition of a baseline in the multi-zone model that are a result of our limited burst statistics, combined with rate dependent changes of recurrence time and burst to burst variations. Figs. 3.2 and LABEL:FigMZ_AB2 show a few examples for composition changes.
The multi-zone model calculations also offer the opportunity to explore the impact of rate changes on the burst recurrence time. Only two reaction variations produce significant changes beyond average burst to burst interval variations, the 15O(,) reaction rate variation leads to a change, and the 14O(,p) reaction rate variation leads to a change. In both cases, only a decrease of the rate has a significant impact and leads to a shortening of the recurrence time (see discussion below).
in the multi zone x-ray burst model.
| Rank | Reaction | TypeaaUp (U) or down (D) variation that has the largest impact | Sensitivitybb in units of 1038ergs/s | Category | ||||||||||||||||||||||||||||||||||||||||||||||||||||||||||||||||||||||||||||||||||||||||||||||||||||
|---|---|---|---|---|---|---|---|---|---|---|---|---|---|---|---|---|---|---|---|---|---|---|---|---|---|---|---|---|---|---|---|---|---|---|---|---|---|---|---|---|---|---|---|---|---|---|---|---|---|---|---|---|---|---|---|---|---|---|---|---|---|---|---|---|---|---|---|---|---|---|---|---|---|---|---|---|---|---|---|---|---|---|---|---|---|---|---|---|---|---|---|---|---|---|---|---|---|---|---|---|---|---|---|---|
|
||||||||||||||||||||||||||||||||||||||||||||||||||||||||||||||||||||||||||||||||||||||||||||||||||||||||
![[Uncaptioned image]](/html/1607.03416/assets/x8.png) ![[Uncaptioned image]](/html/1607.03416/assets/x9.png) ![[Uncaptioned image]](/html/1607.03416/assets/x10.png)
|
||||||||||||||||||||||||||||||||||||||||||||||||||||||||||||||||||||||||||||||||||||||||||||||||||||||||
![[Uncaptioned image]](/html/1607.03416/assets/x11.png) ![[Uncaptioned image]](/html/1607.03416/assets/x12.png) ![[Uncaptioned image]](/html/1607.03416/assets/x13.png)
4. DiscussionThe objective of this study is to identify for the one-zone X-ray burst model ONEZONE the important reaction rates that need to be known to predict the burst light curve and composition, and in addition to use that information to identify as many of such reactions as possible in the full 1D multizone X-ray burst model Kepler. 4.1. X-ray Light CurvesThe reactions that we find to have a significant influence on the burst light curve of the one-zone model are summarized in Fig. 3.2. The breakout reactions of the hot CNO cycle, 15O(,) and 18Ne(,p) affect the burst light curve onset, which sets the initial conditions for the later stages. 14O(,p) does not lead to CNO cycle breakout but opens in the early stages of the burst a rapid pathway from 14O to 15O that accelerates the hot CNO cycle.   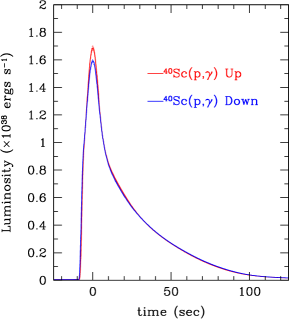 A second set of reactions that are important for the light curve are the (,p) reactions in the p process. In this model they occur on target nuclei 22Mg, 24-26Si, 28-30S, and 34Ar. As the temperature during the burst rise increases, these nuclei serve as waiting points until it is hot enough for the (,p) reactions to turn on. In addition, for 22Mg, 26Si, 30S, and 34Ar, a proton capture pathway can compete with the (,p) reaction. Therefore, proton capture rates in this pathway become also important. Typically the waiting point is in equilibrium with the following isotone because of the low proton capture Q-value and the strong inverse (,p) reaction that enables the much slower (,p) reaction to compete with the proton capture sequence. In this case, proton capture on the isotone determines the strength of the proton capture branch - for 22Mg, 26Si, 30S, and 34Ar these are the proton captures on 23Al, 27P, 31Cl, and 35K, respectively. In the case of 22Mg and 34Ar the proton capture on the waiting point itself also plays a role, indicating that (p,)-(,p) equilibrium is not always established. Also important for the light curve are reactions related to the Ni-Cu and Zn-Ga cycles (VanWormer1994). Of key importance here is the branching into the cycle at 59Cu and 63Ga, which is determined by the competition of the proton capture rate and the (p,) rate. Note the (p,) reactions are listed as (,p) reactions. The proton capture rates in the rp-process are mostly unimportant for determining the burst light curve. This is not surprising, as the process is characterized by proton capture being more rapid than decays, leaving the decay rates, which we did not consider in this study, as the critical parameter that determines energy generation. Nevertheless there are exceptions at particular bottle necks. These are either associated with shell structure - 39Ca and 56Ni are isotopes where the rp-process crosses the and proton shells - or with the rp-process waiting points 60Zn and 64Ge, where half-lives are unusually long and proton capture Q-values are low enough to slow down proton captures. As proton capture Q-values tend to be low, (p,)-(,p) equilibrium tends to play an important role at these waiting points making the proton capture rate on the isotones 40Sc, 57Cu, 61Ga, and 65As the important rate. In the case of 39Ca and 56Ni proton capture on the waiting point is also important. Fig. LABEL:FigMZ_path and Tab. 3.2 summarize the reactions that have been found to influence the light curve in the multi-zone model. The number of important reactions is somewhat smaller than in the single-zone model, largely because we did use smaller variations in several cases. Additional multi-zone calculations demonstrate that the following reactions would appear in Tab. 3.2 when varied by the same factor of 100 as the single-zone calculations: 22Mg(p,)23Si, 29S(,p)32Cl, 30S(,p)33Cl, 31Cl(,p)34Ar (though with a very small effect), 34Ar(,p)37K, 39Ca(p,)40Sc, 35K(p,)36Ca, and 56Ni(p,)57Cu. Taking this into account, the qualitative agreement between the single-zone model and the multi-zone model is quite reasonable, validating the overall approach. Nevertheless, the quantitative impact of the various rate variations can be quite different owing to the different conditions in different zones. Only 6 out of the 28 reactions that impact the light curve in the single-zone model have no impact at all in the multi-zone model. 4 of these are (,p) reactions on the very neutron deficient nuclei 24Si, 25Si, 28S. This may be due to contributions from zones in the multi-zone model, where lower peak temperatures lead to a somewhat less pronounced and less extended p-process. This may also explain the unimportance of 34Ar(p,)35K in the multi-zone model and the fact that in general the (,p) reactions on heavier nuclei are less important in the multi-zone model than they are in the single-zone model. A detailed analysis of the origin of the differences between single zone and multi-zone model sensitivities is beyond the scope of this work and would require considerable additional computational effort. There are also a number of reaction variations that do not impact the light curve in the single-zone model, but have a significant impact on the light curve prediction of the multi-zone model. These reactions fall mostly into two categories: reactions on 17F and 19F that affect the CNO cycles and the helium burning reactions 12C(,)16O and 24Mg(,)28Si. The former group likely affects burning between bursts and in shallower zones where the rp-process is mostly absent or less dominant. The latter group affects the helium burning phase once hydrogen is exhausted and in particular the additional helium burning that occurs when a layer of burst ashes is reheated from the ignition of a subsequent burst above it. Both burning regimes are neglected in the single-zone approximation. We were able to identify these reactions in the multi-zone model because we chose to vary them for other reasons than light curve impact in the single-zone model. We cannot exclude the possibility that there are a few additional reactions not listed here that do not appear to be important in the single zone model, but that would affect the multi-zone model predictions, however. 4.2. CompositionFig. 3.2 and Tab. 5 summarize the reactions that affect the composition of the burst ashes in the single-zone model significantly (by more than a factor of 2 for mass chains with a mass fraction of more than 10-4). Most reactions along the reaction path affect the composition. An exception are reactions between Ca and Ni, where the rp-process splits into multiple parallel paths. There, only reactions on the path closest to stability are important for the final composition, as this is where the longest decay half-lives will be located that define the bottle-necks that determine the composition in this mass region. |
||||||||||||||||||||||||||||||||||||||||||||||||||||||||||||||||||||||||||||||||||||||||||||||||||||||||
![[Uncaptioned image]](/html/1607.03416/assets/x17.png) ![[Uncaptioned image]](/html/1607.03416/assets/x18.png) The most abundant mass chains that dominate the composition of the
burst ashes as calculated by the single-zone model (mass fractions ) are , 56, 60, 64, 68, 72, and 76. Only a small number
of reactions affect these mass chains significantly - these are proton
captures on 56Ni, 61Ga, 65Ge, 67As, 57Cu,
55Co, and 59Cu together with the 56Ni(,p)
reaction. An additional 38 reactions affect mass chains with mass
fractions .
It was not feasible to vary all the important reactions identified in
the single-zone model in individual multi-zone model
runs. Nevertheless, by varying a subset of rates we do find 47
reactions that affect the burst ashes significantly
(Fig. LABEL:FigMZ_path and Tab. 6). We also find 37
reactions that do not affect the composition of the ashes
significantly and that are also indicated in Fig. LABEL:FigMZ_path.
The most important reaction rate uncertainties among the subset of 47
relevant reaction rates will be the ones that affect the most abundant
mass chains, and the ones that affect mass chains that are of
particular interest because of their impact on ocean and crust
physics. The most abundant mass chains in the multi-zone model
() are 28, 32, 56, 60, 64, 68, and 72. Overall these
abundances are quite robust, with no reaction causing a change by more
than a factor of 10. The set of reactions affecting the , and 72 mass chains by more than a factor of 2 is very
small. 56Ni(,p)59Cu affects ,
61Ga(p,)62Ge has a broad impact on , and
68, and both, 69Se(p,)70Br and
71Br(p,)72Kr affect . The mass chain
is affected by 12C(,)16O,
15O(,)19Ne, 16O(,p)19F,
18Ne(,p)21Na, 22Mg(,p)25Al,
23Mg(,p)26Al and
24Mg(,)28Si, whereas is only affected by
15O(,)19Ne. Reactions such as
12C(,)16O, 16O(,p)19F,
and 24Mg(,)28S are not expected to occur in
the presence of hydrogen, as proton capture rates on these target
isotopes are much faster. This indicates late time helium
burning as the source of these abundance peaks, which also explains
their absence in the single-zone model.
The most abundant mass chains that dominate the composition of the
burst ashes as calculated by the single-zone model (mass fractions ) are , 56, 60, 64, 68, 72, and 76. Only a small number
of reactions affect these mass chains significantly - these are proton
captures on 56Ni, 61Ga, 65Ge, 67As, 57Cu,
55Co, and 59Cu together with the 56Ni(,p)
reaction. An additional 38 reactions affect mass chains with mass
fractions .
It was not feasible to vary all the important reactions identified in
the single-zone model in individual multi-zone model
runs. Nevertheless, by varying a subset of rates we do find 47
reactions that affect the burst ashes significantly
(Fig. LABEL:FigMZ_path and Tab. 6). We also find 37
reactions that do not affect the composition of the ashes
significantly and that are also indicated in Fig. LABEL:FigMZ_path.
The most important reaction rate uncertainties among the subset of 47
relevant reaction rates will be the ones that affect the most abundant
mass chains, and the ones that affect mass chains that are of
particular interest because of their impact on ocean and crust
physics. The most abundant mass chains in the multi-zone model
() are 28, 32, 56, 60, 64, 68, and 72. Overall these
abundances are quite robust, with no reaction causing a change by more
than a factor of 10. The set of reactions affecting the , and 72 mass chains by more than a factor of 2 is very
small. 56Ni(,p)59Cu affects ,
61Ga(p,)62Ge has a broad impact on , and
68, and both, 69Se(p,)70Br and
71Br(p,)72Kr affect . The mass chain
is affected by 12C(,)16O,
15O(,)19Ne, 16O(,p)19F,
18Ne(,p)21Na, 22Mg(,p)25Al,
23Mg(,p)26Al and
24Mg(,)28Si, whereas is only affected by
15O(,)19Ne. Reactions such as
12C(,)16O, 16O(,p)19F,
and 24Mg(,)28S are not expected to occur in
the presence of hydrogen, as proton capture rates on these target
isotopes are much faster. This indicates late time helium
burning as the source of these abundance peaks, which also explains
their absence in the single-zone model.
|
| Reaction | VariationbbReaction rates were each multiplied and divided by the factor given. References refer to work that was used in the estimate of the variation factor. | Reaction | VariationbbReaction rates were each multiplied and divided by the factor given. References refer to work that was used in the estimate of the variation factor. | Reaction | VariationbbReaction rates were each multiplied and divided by the factor given. References refer to work that was used in the estimate of the variation factor. | ||||||||||||||||||||||||||||||||||||||||||||||||||||||||||||||||||||||||||||||||||||||||||||||||||||||||||||||||||||||||||||||||||||||||||||||||||||||||||||||||||||||||||||||||||||||||||||||||||||||||||||||||||||||||||||||||||||||||||||||||||||||||||||||||||||||||||||||||||||||||||||||||||||||||||||||||||||||||||||||||||||||||||||||||||||||||||||||||||||||||||||||||||||||||||||||||||||||||||||||||||||||||||||||||||||||||||||||||||||||||||||||||||||||||||||||||||||||||||||||||||||||||||||||||||||||||||||||||||||||||||||||||||||||||||||||||||||||||||||||||||||||||||||||||||||||||||||||||||||||||||||||||||||||||||||||||||||||||||||||||||||||||||||||||||||||||||||||||||||||||||||||||||||||||||||||||||||||||||||||||||||||||||||||||||||||||||||||||||||||||||||||||||||||||||||||||||||||||||||||||||||||||||||||||||||||||||||||||||||||||||||||||||||||||||||||||||||||||||||||||||
|---|---|---|---|---|---|---|---|---|---|---|---|---|---|---|---|---|---|---|---|---|---|---|---|---|---|---|---|---|---|---|---|---|---|---|---|---|---|---|---|---|---|---|---|---|---|---|---|---|---|---|---|---|---|---|---|---|---|---|---|---|---|---|---|---|---|---|---|---|---|---|---|---|---|---|---|---|---|---|---|---|---|---|---|---|---|---|---|---|---|---|---|---|---|---|---|---|---|---|---|---|---|---|---|---|---|---|---|---|---|---|---|---|---|---|---|---|---|---|---|---|---|---|---|---|---|---|---|---|---|---|---|---|---|---|---|---|---|---|---|---|---|---|---|---|---|---|---|---|---|---|---|---|---|---|---|---|---|---|---|---|---|---|---|---|---|---|---|---|---|---|---|---|---|---|---|---|---|---|---|---|---|---|---|---|---|---|---|---|---|---|---|---|---|---|---|---|---|---|---|---|---|---|---|---|---|---|---|---|---|---|---|---|---|---|---|---|---|---|---|---|---|---|---|---|---|---|---|---|---|---|---|---|---|---|---|---|---|---|---|---|---|---|---|---|---|---|---|---|---|---|---|---|---|---|---|---|---|---|---|---|---|---|---|---|---|---|---|---|---|---|---|---|---|---|---|---|---|---|---|---|---|---|---|---|---|---|---|---|---|---|---|---|---|---|---|---|---|---|---|---|---|---|---|---|---|---|---|---|---|---|---|---|---|---|---|---|---|---|---|---|---|---|---|---|---|---|---|---|---|---|---|---|---|---|---|---|---|---|---|---|---|---|---|---|---|---|---|---|---|---|---|---|---|---|---|---|---|---|---|---|---|---|---|---|---|---|---|---|---|---|---|---|---|---|---|---|---|---|---|---|---|---|---|---|---|---|---|---|---|---|---|---|---|---|---|---|---|---|---|---|---|---|---|---|---|---|---|---|---|---|---|---|---|---|---|---|---|---|---|---|---|---|---|---|---|---|---|---|---|---|---|---|---|---|---|---|---|---|---|---|---|---|---|---|---|---|---|---|---|---|---|---|---|---|---|---|---|---|---|---|---|---|---|---|---|---|---|---|---|---|---|---|---|---|---|---|---|---|---|---|---|---|---|---|---|---|---|---|---|---|---|---|---|---|---|---|---|---|---|---|---|---|---|---|---|---|---|---|---|---|---|---|---|---|---|---|---|---|---|---|---|---|---|---|---|---|---|---|---|---|---|---|---|---|---|---|---|---|---|---|---|---|---|---|---|---|---|---|---|---|---|---|---|---|---|---|---|---|---|---|---|---|---|---|---|---|---|---|---|---|---|---|---|---|---|---|---|---|---|---|---|---|---|---|---|---|---|---|---|---|---|---|---|---|---|---|---|---|---|---|---|---|---|---|---|---|---|---|---|---|---|---|---|---|---|---|---|---|---|---|---|---|---|---|---|---|---|---|---|---|---|---|---|---|---|---|---|---|---|---|---|---|---|---|---|---|---|---|---|---|---|---|---|---|---|---|---|---|---|---|---|---|---|---|---|---|---|---|---|---|---|---|---|---|---|---|---|---|---|---|---|---|---|---|---|---|---|---|---|---|---|---|---|---|---|---|---|---|---|---|---|---|---|---|---|---|---|---|---|---|---|---|---|---|---|---|---|---|---|---|---|---|---|---|---|---|---|---|---|---|---|---|---|---|---|---|---|---|---|---|---|---|---|---|---|---|---|---|---|---|---|---|---|---|---|---|---|---|---|---|---|---|---|---|---|---|---|---|---|---|---|---|---|---|---|---|---|---|---|---|---|---|---|---|---|---|---|---|---|---|---|---|---|---|---|---|---|---|---|---|---|---|---|---|---|---|---|---|---|---|---|---|---|---|---|---|---|---|---|---|---|---|---|---|---|---|---|---|---|---|---|---|---|---|---|---|---|---|---|---|---|---|---|---|---|---|---|---|---|---|---|---|---|---|---|---|---|---|---|---|---|---|---|---|---|---|---|---|---|---|---|---|---|---|---|---|---|---|---|---|---|---|---|---|---|---|---|
| 3 | x1.2 [2] | (,) | 2.0 [3] | (p,) | 1.1 [1] | ||||||||||||||||||||||||||||||||||||||||||||||||||||||||||||||||||||||||||||||||||||||||||||||||||||||||||||||||||||||||||||||||||||||||||||||||||||||||||||||||||||||||||||||||||||||||||||||||||||||||||||||||||||||||||||||||||||||||||||||||||||||||||||||||||||||||||||||||||||||||||||||||||||||||||||||||||||||||||||||||||||||||||||||||||||||||||||||||||||||||||||||||||||||||||||||||||||||||||||||||||||||||||||||||||||||||||||||||||||||||||||||||||||||||||||||||||||||||||||||||||||||||||||||||||||||||||||||||||||||||||||||||||||||||||||||||||||||||||||||||||||||||||||||||||||||||||||||||||||||||||||||||||||||||||||||||||||||||||||||||||||||||||||||||||||||||||||||||||||||||||||||||||||||||||||||||||||||||||||||||||||||||||||||||||||||||||||||||||||||||||||||||||||||||||||||||||||||||||||||||||||||||||||||||||||||||||||||||||||||||||||||||||||||||||||||||||||||||||||||||||
| (p,) | 10 | (,p) | 10 | (,) | 10 | ||||||||||||||||||||||||||||||||||||||||||||||||||||||||||||||||||||||||||||||||||||||||||||||||||||||||||||||||||||||||||||||||||||||||||||||||||||||||||||||||||||||||||||||||||||||||||||||||||||||||||||||||||||||||||||||||||||||||||||||||||||||||||||||||||||||||||||||||||||||||||||||||||||||||||||||||||||||||||||||||||||||||||||||||||||||||||||||||||||||||||||||||||||||||||||||||||||||||||||||||||||||||||||||||||||||||||||||||||||||||||||||||||||||||||||||||||||||||||||||||||||||||||||||||||||||||||||||||||||||||||||||||||||||||||||||||||||||||||||||||||||||||||||||||||||||||||||||||||||||||||||||||||||||||||||||||||||||||||||||||||||||||||||||||||||||||||||||||||||||||||||||||||||||||||||||||||||||||||||||||||||||||||||||||||||||||||||||||||||||||||||||||||||||||||||||||||||||||||||||||||||||||||||||||||||||||||||||||||||||||||||||||||||||||||||||||||||||||||||||||||
| (,) | 1.80 [1] | (,p) | 10 | (,p) | 10 | ||||||||||||||||||||||||||||||||||||||||||||||||||||||||||||||||||||||||||||||||||||||||||||||||||||||||||||||||||||||||||||||||||||||||||||||||||||||||||||||||||||||||||||||||||||||||||||||||||||||||||||||||||||||||||||||||||||||||||||||||||||||||||||||||||||||||||||||||||||||||||||||||||||||||||||||||||||||||||||||||||||||||||||||||||||||||||||||||||||||||||||||||||||||||||||||||||||||||||||||||||||||||||||||||||||||||||||||||||||||||||||||||||||||||||||||||||||||||||||||||||||||||||||||||||||||||||||||||||||||||||||||||||||||||||||||||||||||||||||||||||||||||||||||||||||||||||||||||||||||||||||||||||||||||||||||||||||||||||||||||||||||||||||||||||||||||||||||||||||||||||||||||||||||||||||||||||||||||||||||||||||||||||||||||||||||||||||||||||||||||||||||||||||||||||||||||||||||||||||||||||||||||||||||||||||||||||||||||||||||||||||||||||||||||||||||||||||||||||||||||||
| (p,) | 6.33 ddAdjusted with data from Iliadis2010 | (,p) | 100 | (,p) | 10 | ||||||||||||||||||||||||||||||||||||||||||||||||||||||||||||||||||||||||||||||||||||||||||||||||||||||||||||||||||||||||||||||||||||||||||||||||||||||||||||||||||||||||||||||||||||||||||||||||||||||||||||||||||||||||||||||||||||||||||||||||||||||||||||||||||||||||||||||||||||||||||||||||||||||||||||||||||||||||||||||||||||||||||||||||||||||||||||||||||||||||||||||||||||||||||||||||||||||||||||||||||||||||||||||||||||||||||||||||||||||||||||||||||||||||||||||||||||||||||||||||||||||||||||||||||||||||||||||||||||||||||||||||||||||||||||||||||||||||||||||||||||||||||||||||||||||||||||||||||||||||||||||||||||||||||||||||||||||||||||||||||||||||||||||||||||||||||||||||||||||||||||||||||||||||||||||||||||||||||||||||||||||||||||||||||||||||||||||||||||||||||||||||||||||||||||||||||||||||||||||||||||||||||||||||||||||||||||||||||||||||||||||||||||||||||||||||||||||||||||||||||
| (,p) | 30 [4] | (,p) | 10 | (p,) | 100 | ||||||||||||||||||||||||||||||||||||||||||||||||||||||||||||||||||||||||||||||||||||||||||||||||||||||||||||||||||||||||||||||||||||||||||||||||||||||||||||||||||||||||||||||||||||||||||||||||||||||||||||||||||||||||||||||||||||||||||||||||||||||||||||||||||||||||||||||||||||||||||||||||||||||||||||||||||||||||||||||||||||||||||||||||||||||||||||||||||||||||||||||||||||||||||||||||||||||||||||||||||||||||||||||||||||||||||||||||||||||||||||||||||||||||||||||||||||||||||||||||||||||||||||||||||||||||||||||||||||||||||||||||||||||||||||||||||||||||||||||||||||||||||||||||||||||||||||||||||||||||||||||||||||||||||||||||||||||||||||||||||||||||||||||||||||||||||||||||||||||||||||||||||||||||||||||||||||||||||||||||||||||||||||||||||||||||||||||||||||||||||||||||||||||||||||||||||||||||||||||||||||||||||||||||||||||||||||||||||||||||||||||||||||||||||||||||||||||||||||||||||
| (,) | 1.40 [1] | (,p) | 10 | (p,) | 2 [1] | ||||||||||||||||||||||||||||||||||||||||||||||||||||||||||||||||||||||||||||||||||||||||||||||||||||||||||||||||||||||||||||||||||||||||||||||||||||||||||||||||||||||||||||||||||||||||||||||||||||||||||||||||||||||||||||||||||||||||||||||||||||||||||||||||||||||||||||||||||||||||||||||||||||||||||||||||||||||||||||||||||||||||||||||||||||||||||||||||||||||||||||||||||||||||||||||||||||||||||||||||||||||||||||||||||||||||||||||||||||||||||||||||||||||||||||||||||||||||||||||||||||||||||||||||||||||||||||||||||||||||||||||||||||||||||||||||||||||||||||||||||||||||||||||||||||||||||||||||||||||||||||||||||||||||||||||||||||||||||||||||||||||||||||||||||||||||||||||||||||||||||||||||||||||||||||||||||||||||||||||||||||||||||||||||||||||||||||||||||||||||||||||||||||||||||||||||||||||||||||||||||||||||||||||||||||||||||||||||||||||||||||||||||||||||||||||||||||||||||||||||||
| (,p) | 10 | (,p) | 10 | (,) | 10 | ||||||||||||||||||||||||||||||||||||||||||||||||||||||||||||||||||||||||||||||||||||||||||||||||||||||||||||||||||||||||||||||||||||||||||||||||||||||||||||||||||||||||||||||||||||||||||||||||||||||||||||||||||||||||||||||||||||||||||||||||||||||||||||||||||||||||||||||||||||||||||||||||||||||||||||||||||||||||||||||||||||||||||||||||||||||||||||||||||||||||||||||||||||||||||||||||||||||||||||||||||||||||||||||||||||||||||||||||||||||||||||||||||||||||||||||||||||||||||||||||||||||||||||||||||||||||||||||||||||||||||||||||||||||||||||||||||||||||||||||||||||||||||||||||||||||||||||||||||||||||||||||||||||||||||||||||||||||||||||||||||||||||||||||||||||||||||||||||||||||||||||||||||||||||||||||||||||||||||||||||||||||||||||||||||||||||||||||||||||||||||||||||||||||||||||||||||||||||||||||||||||||||||||||||||||||||||||||||||||||||||||||||||||||||||||||||||||||||||||||||||
| (p,) | 30-100aaValues approximate. Variation calculated using resonance uncertainty (see text) and depends on temperature. | (,p) | 10 | (p,) | 2ddAdjusted with data from Iliadis2010 | ||||||||||||||||||||||||||||||||||||||||||||||||||||||||||||||||||||||||||||||||||||||||||||||||||||||||||||||||||||||||||||||||||||||||||||||||||||||||||||||||||||||||||||||||||||||||||||||||||||||||||||||||||||||||||||||||||||||||||||||||||||||||||||||||||||||||||||||||||||||||||||||||||||||||||||||||||||||||||||||||||||||||||||||||||||||||||||||||||||||||||||||||||||||||||||||||||||||||||||||||||||||||||||||||||||||||||||||||||||||||||||||||||||||||||||||||||||||||||||||||||||||||||||||||||||||||||||||||||||||||||||||||||||||||||||||||||||||||||||||||||||||||||||||||||||||||||||||||||||||||||||||||||||||||||||||||||||||||||||||||||||||||||||||||||||||||||||||||||||||||||||||||||||||||||||||||||||||||||||||||||||||||||||||||||||||||||||||||||||||||||||||||||||||||||||||||||||||||||||||||||||||||||||||||||||||||||||||||||||||||||||||||||||||||||||||||||||||||||||||||||
| (,p) | 10 | (,p) | 10 | (,p) | 10 | ||||||||||||||||||||||||||||||||||||||||||||||||||||||||||||||||||||||||||||||||||||||||||||||||||||||||||||||||||||||||||||||||||||||||||||||||||||||||||||||||||||||||||||||||||||||||||||||||||||||||||||||||||||||||||||||||||||||||||||||||||||||||||||||||||||||||||||||||||||||||||||||||||||||||||||||||||||||||||||||||||||||||||||||||||||||||||||||||||||||||||||||||||||||||||||||||||||||||||||||||||||||||||||||||||||||||||||||||||||||||||||||||||||||||||||||||||||||||||||||||||||||||||||||||||||||||||||||||||||||||||||||||||||||||||||||||||||||||||||||||||||||||||||||||||||||||||||||||||||||||||||||||||||||||||||||||||||||||||||||||||||||||||||||||||||||||||||||||||||||||||||||||||||||||||||||||||||||||||||||||||||||||||||||||||||||||||||||||||||||||||||||||||||||||||||||||||||||||||||||||||||||||||||||||||||||||||||||||||||||||||||||||||||||||||||||||||||||||||||||||||
| (p,) | 3ddAdjusted with data from Iliadis2010 | (p,) | 2-3aaValues approximate. Variation calculated using resonance uncertainty (see text) and depends on temperature. | (p,) | 10 | ||||||||||||||||||||||||||||||||||||||||||||||||||||||||||||||||||||||||||||||||||||||||||||||||||||||||||||||||||||||||||||||||||||||||||||||||||||||||||||||||||||||||||||||||||||||||||||||||||||||||||||||||||||||||||||||||||||||||||||||||||||||||||||||||||||||||||||||||||||||||||||||||||||||||||||||||||||||||||||||||||||||||||||||||||||||||||||||||||||||||||||||||||||||||||||||||||||||||||||||||||||||||||||||||||||||||||||||||||||||||||||||||||||||||||||||||||||||||||||||||||||||||||||||||||||||||||||||||||||||||||||||||||||||||||||||||||||||||||||||||||||||||||||||||||||||||||||||||||||||||||||||||||||||||||||||||||||||||||||||||||||||||||||||||||||||||||||||||||||||||||||||||||||||||||||||||||||||||||||||||||||||||||||||||||||||||||||||||||||||||||||||||||||||||||||||||||||||||||||||||||||||||||||||||||||||||||||||||||||||||||||||||||||||||||||||||||||||||||||||||||
| (,p) | 10 | (,p) | 10 | (,p) | 10 | ||||||||||||||||||||||||||||||||||||||||||||||||||||||||||||||||||||||||||||||||||||||||||||||||||||||||||||||||||||||||||||||||||||||||||||||||||||||||||||||||||||||||||||||||||||||||||||||||||||||||||||||||||||||||||||||||||||||||||||||||||||||||||||||||||||||||||||||||||||||||||||||||||||||||||||||||||||||||||||||||||||||||||||||||||||||||||||||||||||||||||||||||||||||||||||||||||||||||||||||||||||||||||||||||||||||||||||||||||||||||||||||||||||||||||||||||||||||||||||||||||||||||||||||||||||||||||||||||||||||||||||||||||||||||||||||||||||||||||||||||||||||||||||||||||||||||||||||||||||||||||||||||||||||||||||||||||||||||||||||||||||||||||||||||||||||||||||||||||||||||||||||||||||||||||||||||||||||||||||||||||||||||||||||||||||||||||||||||||||||||||||||||||||||||||||||||||||||||||||||||||||||||||||||||||||||||||||||||||||||||||||||||||||||||||||||||||||||||||||||||||
| (p,) | 6ddAdjusted with data from Iliadis2010 | (p,) | 2-3aaValues approximate. Variation calculated using resonance uncertainty (see text) and depends on temperature. | (,p) | 10 | ||||||||||||||||||||||||||||||||||||||||||||||||||||||||||||||||||||||||||||||||||||||||||||||||||||||||||||||||||||||||||||||||||||||||||||||||||||||||||||||||||||||||||||||||||||||||||||||||||||||||||||||||||||||||||||||||||||||||||||||||||||||||||||||||||||||||||||||||||||||||||||||||||||||||||||||||||||||||||||||||||||||||||||||||||||||||||||||||||||||||||||||||||||||||||||||||||||||||||||||||||||||||||||||||||||||||||||||||||||||||||||||||||||||||||||||||||||||||||||||||||||||||||||||||||||||||||||||||||||||||||||||||||||||||||||||||||||||||||||||||||||||||||||||||||||||||||||||||||||||||||||||||||||||||||||||||||||||||||||||||||||||||||||||||||||||||||||||||||||||||||||||||||||||||||||||||||||||||||||||||||||||||||||||||||||||||||||||||||||||||||||||||||||||||||||||||||||||||||||||||||||||||||||||||||||||||||||||||||||||||||||||||||||||||||||||||||||||||||||||||||
| (p,) | 100 | (p,) | 3-10aaValues approximate. Variation calculated using resonance uncertainty (see text) and depends on temperature. | (p,) | 10 | ||||||||||||||||||||||||||||||||||||||||||||||||||||||||||||||||||||||||||||||||||||||||||||||||||||||||||||||||||||||||||||||||||||||||||||||||||||||||||||||||||||||||||||||||||||||||||||||||||||||||||||||||||||||||||||||||||||||||||||||||||||||||||||||||||||||||||||||||||||||||||||||||||||||||||||||||||||||||||||||||||||||||||||||||||||||||||||||||||||||||||||||||||||||||||||||||||||||||||||||||||||||||||||||||||||||||||||||||||||||||||||||||||||||||||||||||||||||||||||||||||||||||||||||||||||||||||||||||||||||||||||||||||||||||||||||||||||||||||||||||||||||||||||||||||||||||||||||||||||||||||||||||||||||||||||||||||||||||||||||||||||||||||||||||||||||||||||||||||||||||||||||||||||||||||||||||||||||||||||||||||||||||||||||||||||||||||||||||||||||||||||||||||||||||||||||||||||||||||||||||||||||||||||||||||||||||||||||||||||||||||||||||||||||||||||||||||||||||||||||||||
| (p,) | 3ddAdjusted with data from Iliadis2010 | (p,) | 1.40ddAdjusted with data from Iliadis2010 | (p,) | 100 | ||||||||||||||||||||||||||||||||||||||||||||||||||||||||||||||||||||||||||||||||||||||||||||||||||||||||||||||||||||||||||||||||||||||||||||||||||||||||||||||||||||||||||||||||||||||||||||||||||||||||||||||||||||||||||||||||||||||||||||||||||||||||||||||||||||||||||||||||||||||||||||||||||||||||||||||||||||||||||||||||||||||||||||||||||||||||||||||||||||||||||||||||||||||||||||||||||||||||||||||||||||||||||||||||||||||||||||||||||||||||||||||||||||||||||||||||||||||||||||||||||||||||||||||||||||||||||||||||||||||||||||||||||||||||||||||||||||||||||||||||||||||||||||||||||||||||||||||||||||||||||||||||||||||||||||||||||||||||||||||||||||||||||||||||||||||||||||||||||||||||||||||||||||||||||||||||||||||||||||||||||||||||||||||||||||||||||||||||||||||||||||||||||||||||||||||||||||||||||||||||||||||||||||||||||||||||||||||||||||||||||||||||||||||||||||||||||||||||||||||||||
| (p,) | 100 | (p,) | 10 | (p,) | 100 | ||||||||||||||||||||||||||||||||||||||||||||||||||||||||||||||||||||||||||||||||||||||||||||||||||||||||||||||||||||||||||||||||||||||||||||||||||||||||||||||||||||||||||||||||||||||||||||||||||||||||||||||||||||||||||||||||||||||||||||||||||||||||||||||||||||||||||||||||||||||||||||||||||||||||||||||||||||||||||||||||||||||||||||||||||||||||||||||||||||||||||||||||||||||||||||||||||||||||||||||||||||||||||||||||||||||||||||||||||||||||||||||||||||||||||||||||||||||||||||||||||||||||||||||||||||||||||||||||||||||||||||||||||||||||||||||||||||||||||||||||||||||||||||||||||||||||||||||||||||||||||||||||||||||||||||||||||||||||||||||||||||||||||||||||||||||||||||||||||||||||||||||||||||||||||||||||||||||||||||||||||||||||||||||||||||||||||||||||||||||||||||||||||||||||||||||||||||||||||||||||||||||||||||||||||||||||||||||||||||||||||||||||||||||||||||||||||||||||||||||||||
| (p,) | 10 | (p,) | 100 | (p,) | 100 | ||||||||||||||||||||||||||||||||||||||||||||||||||||||||||||||||||||||||||||||||||||||||||||||||||||||||||||||||||||||||||||||||||||||||||||||||||||||||||||||||||||||||||||||||||||||||||||||||||||||||||||||||||||||||||||||||||||||||||||||||||||||||||||||||||||||||||||||||||||||||||||||||||||||||||||||||||||||||||||||||||||||||||||||||||||||||||||||||||||||||||||||||||||||||||||||||||||||||||||||||||||||||||||||||||||||||||||||||||||||||||||||||||||||||||||||||||||||||||||||||||||||||||||||||||||||||||||||||||||||||||||||||||||||||||||||||||||||||||||||||||||||||||||||||||||||||||||||||||||||||||||||||||||||||||||||||||||||||||||||||||||||||||||||||||||||||||||||||||||||||||||||||||||||||||||||||||||||||||||||||||||||||||||||||||||||||||||||||||||||||||||||||||||||||||||||||||||||||||||||||||||||||||||||||||||||||||||||||||||||||||||||||||||||||||||||||||||||||||||||||||
| (p,) | 100 | (p,) | 100 | (p,) | 10 | ||||||||||||||||||||||||||||||||||||||||||||||||||||||||||||||||||||||||||||||||||||||||||||||||||||||||||||||||||||||||||||||||||||||||||||||||||||||||||||||||||||||||||||||||||||||||||||||||||||||||||||||||||||||||||||||||||||||||||||||||||||||||||||||||||||||||||||||||||||||||||||||||||||||||||||||||||||||||||||||||||||||||||||||||||||||||||||||||||||||||||||||||||||||||||||||||||||||||||||||||||||||||||||||||||||||||||||||||||||||||||||||||||||||||||||||||||||||||||||||||||||||||||||||||||||||||||||||||||||||||||||||||||||||||||||||||||||||||||||||||||||||||||||||||||||||||||||||||||||||||||||||||||||||||||||||||||||||||||||||||||||||||||||||||||||||||||||||||||||||||||||||||||||||||||||||||||||||||||||||||||||||||||||||||||||||||||||||||||||||||||||||||||||||||||||||||||||||||||||||||||||||||||||||||||||||||||||||||||||||||||||||||||||||||||||||||||||||||||||||||||
| (p,) | 10 | (,p) | 100 | (p,) | 5aaValues approximate. Variation calculated using resonance uncertainty (see text) and depends on temperature. | ||||||||||||||||||||||||||||||||||||||||||||||||||||||||||||||||||||||||||||||||||||||||||||||||||||||||||||||||||||||||||||||||||||||||||||||||||||||||||||||||||||||||||||||||||||||||||||||||||||||||||||||||||||||||||||||||||||||||||||||||||||||||||||||||||||||||||||||||||||||||||||||||||||||||||||||||||||||||||||||||||||||||||||||||||||||||||||||||||||||||||||||||||||||||||||||||||||||||||||||||||||||||||||||||||||||||||||||||||||||||||||||||||||||||||||||||||||||||||||||||||||||||||||||||||||||||||||||||||||||||||||||||||||||||||||||||||||||||||||||||||||||||||||||||||||||||||||||||||||||||||||||||||||||||||||||||||||||||||||||||||||||||||||||||||||||||||||||||||||||||||||||||||||||||||||||||||||||||||||||||||||||||||||||||||||||||||||||||||||||||||||||||||||||||||||||||||||||||||||||||||||||||||||||||||||||||||||||||||||||||||||||||||||||||||||||||||||||||||||||||||
| (p,) | 100ccRecent experiment reduced uncertainty significantly (Langer2014) | (p,) | 100 | (p,) | 10 | ||||||||||||||||||||||||||||||||||||||||||||||||||||||||||||||||||||||||||||||||||||||||||||||||||||||||||||||||||||||||||||||||||||||||||||||||||||||||||||||||||||||||||||||||||||||||||||||||||||||||||||||||||||||||||||||||||||||||||||||||||||||||||||||||||||||||||||||||||||||||||||||||||||||||||||||||||||||||||||||||||||||||||||||||||||||||||||||||||||||||||||||||||||||||||||||||||||||||||||||||||||||||||||||||||||||||||||||||||||||||||||||||||||||||||||||||||||||||||||||||||||||||||||||||||||||||||||||||||||||||||||||||||||||||||||||||||||||||||||||||||||||||||||||||||||||||||||||||||||||||||||||||||||||||||||||||||||||||||||||||||||||||||||||||||||||||||||||||||||||||||||||||||||||||||||||||||||||||||||||||||||||||||||||||||||||||||||||||||||||||||||||||||||||||||||||||||||||||||||||||||||||||||||||||||||||||||||||||||||||||||||||||||||||||||||||||||||||||||||||||||
| (,p) | 100 | (p,) | 100 | (p,) | 10 | ||||||||||||||||||||||||||||||||||||||||||||||||||||||||||||||||||||||||||||||||||||||||||||||||||||||||||||||||||||||||||||||||||||||||||||||||||||||||||||||||||||||||||||||||||||||||||||||||||||||||||||||||||||||||||||||||||||||||||||||||||||||||||||||||||||||||||||||||||||||||||||||||||||||||||||||||||||||||||||||||||||||||||||||||||||||||||||||||||||||||||||||||||||||||||||||||||||||||||||||||||||||||||||||||||||||||||||||||||||||||||||||||||||||||||||||||||||||||||||||||||||||||||||||||||||||||||||||||||||||||||||||||||||||||||||||||||||||||||||||||||||||||||||||||||||||||||||||||||||||||||||||||||||||||||||||||||||||||||||||||||||||||||||||||||||||||||||||||||||||||||||||||||||||||||||||||||||||||||||||||||||||||||||||||||||||||||||||||||||||||||||||||||||||||||||||||||||||||||||||||||||||||||||||||||||||||||||||||||||||||||||||||||||||||||||||||||||||||||||||||||
| (p,) | 100 | (p,) | 10 | (p,) | 100 | ||||||||||||||||||||||||||||||||||||||||||||||||||||||||||||||||||||||||||||||||||||||||||||||||||||||||||||||||||||||||||||||||||||||||||||||||||||||||||||||||||||||||||||||||||||||||||||||||||||||||||||||||||||||||||||||||||||||||||||||||||||||||||||||||||||||||||||||||||||||||||||||||||||||||||||||||||||||||||||||||||||||||||||||||||||||||||||||||||||||||||||||||||||||||||||||||||||||||||||||||||||||||||||||||||||||||||||||||||||||||||||||||||||||||||||||||||||||||||||||||||||||||||||||||||||||||||||||||||||||||||||||||||||||||||||||||||||||||||||||||||||||||||||||||||||||||||||||||||||||||||||||||||||||||||||||||||||||||||||||||||||||||||||||||||||||||||||||||||||||||||||||||||||||||||||||||||||||||||||||||||||||||||||||||||||||||||||||||||||||||||||||||||||||||||||||||||||||||||||||||||||||||||||||||||||||||||||||||||||||||||||||||||||||||||||||||||||||||||||||||||
| (p,) | 100 | (p,) | 100 | (p,) | 100 | ||||||||||||||||||||||||||||||||||||||||||||||||||||||||||||||||||||||||||||||||||||||||||||||||||||||||||||||||||||||||||||||||||||||||||||||||||||||||||||||||||||||||||||||||||||||||||||||||||||||||||||||||||||||||||||||||||||||||||||||||||||||||||||||||||||||||||||||||||||||||||||||||||||||||||||||||||||||||||||||||||||||||||||||||||||||||||||||||||||||||||||||||||||||||||||||||||||||||||||||||||||||||||||||||||||||||||||||||||||||||||||||||||||||||||||||||||||||||||||||||||||||||||||||||||||||||||||||||||||||||||||||||||||||||||||||||||||||||||||||||||||||||||||||||||||||||||||||||||||||||||||||||||||||||||||||||||||||||||||||||||||||||||||||||||||||||||||||||||||||||||||||||||||||||||||||||||||||||||||||||||||||||||||||||||||||||||||||||||||||||||||||||||||||||||||||||||||||||||||||||||||||||||||||||||||||||||||||||||||||||||||||||||||||||||||||||||||||||||||||||||
| (p,) | 100 | (p,) | 100 | (p,) | 100 | ||||||||||||||||||||||||||||||||||||||||||||||||||||||||||||||||||||||||||||||||||||||||||||||||||||||||||||||||||||||||||||||||||||||||||||||||||||||||||||||||||||||||||||||||||||||||||||||||||||||||||||||||||||||||||||||||||||||||||||||||||||||||||||||||||||||||||||||||||||||||||||||||||||||||||||||||||||||||||||||||||||||||||||||||||||||||||||||||||||||||||||||||||||||||||||||||||||||||||||||||||||||||||||||||||||||||||||||||||||||||||||||||||||||||||||||||||||||||||||||||||||||||||||||||||||||||||||||||||||||||||||||||||||||||||||||||||||||||||||||||||||||||||||||||||||||||||||||||||||||||||||||||||||||||||||||||||||||||||||||||||||||||||||||||||||||||||||||||||||||||||||||||||||||||||||||||||||||||||||||||||||||||||||||||||||||||||||||||||||||||||||||||||||||||||||||||||||||||||||||||||||||||||||||||||||||||||||||||||||||||||||||||||||||||||||||||||||||||||||||||||
| (p,) | 100 | (p,) | 10 | (p,) | 10 | ||||||||||||||||||||||||||||||||||||||||||||||||||||||||||||||||||||||||||||||||||||||||||||||||||||||||||||||||||||||||||||||||||||||||||||||||||||||||||||||||||||||||||||||||||||||||||||||||||||||||||||||||||||||||||||||||||||||||||||||||||||||||||||||||||||||||||||||||||||||||||||||||||||||||||||||||||||||||||||||||||||||||||||||||||||||||||||||||||||||||||||||||||||||||||||||||||||||||||||||||||||||||||||||||||||||||||||||||||||||||||||||||||||||||||||||||||||||||||||||||||||||||||||||||||||||||||||||||||||||||||||||||||||||||||||||||||||||||||||||||||||||||||||||||||||||||||||||||||||||||||||||||||||||||||||||||||||||||||||||||||||||||||||||||||||||||||||||||||||||||||||||||||||||||||||||||||||||||||||||||||||||||||||||||||||||||||||||||||||||||||||||||||||||||||||||||||||||||||||||||||||||||||||||||||||||||||||||||||||||||||||||||||||||||||||||||||||||||||||||||||
| (p,) | 10 | (p,) | 100 | (p,) | 10 | ||||||||||||||||||||||||||||||||||||||||||||||||||||||||||||||||||||||||||||||||||||||||||||||||||||||||||||||||||||||||||||||||||||||||||||||||||||||||||||||||||||||||||||||||||||||||||||||||||||||||||||||||||||||||||||||||||||||||||||||||||||||||||||||||||||||||||||||||||||||||||||||||||||||||||||||||||||||||||||||||||||||||||||||||||||||||||||||||||||||||||||||||||||||||||||||||||||||||||||||||||||||||||||||||||||||||||||||||||||||||||||||||||||||||||||||||||||||||||||||||||||||||||||||||||||||||||||||||||||||||||||||||||||||||||||||||||||||||||||||||||||||||||||||||||||||||||||||||||||||||||||||||||||||||||||||||||||||||||||||||||||||||||||||||||||||||||||||||||||||||||||||||||||||||||||||||||||||||||||||||||||||||||||||||||||||||||||||||||||||||||||||||||||||||||||||||||||||||||||||||||||||||||||||||||||||||||||||||||||||||||||||||||||||||||||||||||||||||||||||||||
| (p,) | 10 | (p,) | 10 | (p,) | 10 | ||||||||||||||||||||||||||||||||||||||||||||||||||||||||||||||||||||||||||||||||||||||||||||||||||||||||||||||||||||||||||||||||||||||||||||||||||||||||||||||||||||||||||||||||||||||||||||||||||||||||||||||||||||||||||||||||||||||||||||||||||||||||||||||||||||||||||||||||||||||||||||||||||||||||||||||||||||||||||||||||||||||||||||||||||||||||||||||||||||||||||||||||||||||||||||||||||||||||||||||||||||||||||||||||||||||||||||||||||||||||||||||||||||||||||||||||||||||||||||||||||||||||||||||||||||||||||||||||||||||||||||||||||||||||||||||||||||||||||||||||||||||||||||||||||||||||||||||||||||||||||||||||||||||||||||||||||||||||||||||||||||||||||||||||||||||||||||||||||||||||||||||||||||||||||||||||||||||||||||||||||||||||||||||||||||||||||||||||||||||||||||||||||||||||||||||||||||||||||||||||||||||||||||||||||||||||||||||||||||||||||||||||||||||||||||||||||||||||||||||||||
| (p,) | 10 | (p,) | 100 | (p,) | 100 | ||||||||||||||||||||||||||||||||||||||||||||||||||||||||||||||||||||||||||||||||||||||||||||||||||||||||||||||||||||||||||||||||||||||||||||||||||||||||||||||||||||||||||||||||||||||||||||||||||||||||||||||||||||||||||||||||||||||||||||||||||||||||||||||||||||||||||||||||||||||||||||||||||||||||||||||||||||||||||||||||||||||||||||||||||||||||||||||||||||||||||||||||||||||||||||||||||||||||||||||||||||||||||||||||||||||||||||||||||||||||||||||||||||||||||||||||||||||||||||||||||||||||||||||||||||||||||||||||||||||||||||||||||||||||||||||||||||||||||||||||||||||||||||||||||||||||||||||||||||||||||||||||||||||||||||||||||||||||||||||||||||||||||||||||||||||||||||||||||||||||||||||||||||||||||||||||||||||||||||||||||||||||||||||||||||||||||||||||||||||||||||||||||||||||||||||||||||||||||||||||||||||||||||||||||||||||||||||||||||||||||||||||||||||||||||||||||||||||||||||||||
| (p,) | 10 | (p,) | 10 | (p,) | 10 | ||||||||||||||||||||||||||||||||||||||||||||||||||||||||||||||||||||||||||||||||||||||||||||||||||||||||||||||||||||||||||||||||||||||||||||||||||||||||||||||||||||||||||||||||||||||||||||||||||||||||||||||||||||||||||||||||||||||||||||||||||||||||||||||||||||||||||||||||||||||||||||||||||||||||||||||||||||||||||||||||||||||||||||||||||||||||||||||||||||||||||||||||||||||||||||||||||||||||||||||||||||||||||||||||||||||||||||||||||||||||||||||||||||||||||||||||||||||||||||||||||||||||||||||||||||||||||||||||||||||||||||||||||||||||||||||||||||||||||||||||||||||||||||||||||||||||||||||||||||||||||||||||||||||||||||||||||||||||||||||||||||||||||||||||||||||||||||||||||||||||||||||||||||||||||||||||||||||||||||||||||||||||||||||||||||||||||||||||||||||||||||||||||||||||||||||||||||||||||||||||||||||||||||||||||||||||||||||||||||||||||||||||||||||||||||||||||||||||||||||||||
References. — [1] NACRE1, [2] Herwig2006, [3] Buchmann2006, [4] Matic2009
**footnotetext: Reaction also varied in multi-zone model.
|
|||||||||||||||||||||||||||||||||||||||||||||||||||||||||||||||||||||||||||||||||||||||||||||||||||||||||||||||||||||||||||||||||||||||||||||||||||||||||||||||||||||||||||||||||||||||||||||||||||||||||||||||||||||||||||||||||||||||||||||||||||||||||||||||||||||||||||||||||||||||||||||||||||||||||||||||||||||||||||||||||||||||||||||||||||||||||||||||||||||||||||||||||||||||||||||||||||||||||||||||||||||||||||||||||||||||||||||||||||||||||||||||||||||||||||||||||||||||||||||||||||||||||||||||||||||||||||||||||||||||||||||||||||||||||||||||||||||||||||||||||||||||||||||||||||||||||||||||||||||||||||||||||||||||||||||||||||||||||||||||||||||||||||||||||||||||||||||||||||||||||||||||||||||||||||||||||||||||||||||||||||||||||||||||||||||||||||||||||||||||||||||||||||||||||||||||||||||||||||||||||||||||||||||||||||||||||||||||||||||||||||||||||||||||||||||||||||||||||||||||||||||||
![[Uncaptioned image]](/html/1607.03416/assets/x19.png)
|
|||||||||||||||||||||||||||||||||||||||||||||||||||||||||||||||||||||||||||||||||||||||||||||||||||||||||||||||||||||||||||||||||||||||||||||||||||||||||||||||||||||||||||||||||||||||||||||||||||||||||||||||||||||||||||||||||||||||||||||||||||||||||||||||||||||||||||||||||||||||||||||||||||||||||||||||||||||||||||||||||||||||||||||||||||||||||||||||||||||||||||||||||||||||||||||||||||||||||||||||||||||||||||||||||||||||||||||||||||||||||||||||||||||||||||||||||||||||||||||||||||||||||||||||||||||||||||||||||||||||||||||||||||||||||||||||||||||||||||||||||||||||||||||||||||||||||||||||||||||||||||||||||||||||||||||||||||||||||||||||||||||||||||||||||||||||||||||||||||||||||||||||||||||||||||||||||||||||||||||||||||||||||||||||||||||||||||||||||||||||||||||||||||||||||||||||||||||||||||||||||||||||||||||||||||||||||||||||||||||||||||||||||||||||||||||||||||||||||||||||||||||||