Magnetic phases of quasi-two-dimensional antiferromagnet on triangular lattice CuCrO2
Abstract
We have carried out 63,65Cu NMR spectra measurements in magnetic field up to about 45 T on single crystal of a multiferroic triangular antiferromagnet CuCrO2. The measurements were performed for magnetic fields aligned along the crystal -axis. Field and temperature evolution of the spectral shape demonstrates a number of phase transitions. It was found that the 3D magnetic ordering takes place in the low field range ( T). At higher fields magnetic structures form within individual triangular planes whereas the spin directions of the magnetic ions from neighboring planes are not correlated. It is established that the 2D-3D transition is hysteretic in field and temperature. Lineshape analysis reveals several possible magnetic structures existing within individual planes for different phases of CuCrO2. Within certain regions on the magnetic H-T phase diagram of CuCrO2 a 3D magnetic ordering with tensor order parameter is expected.
pacs:
75.50.Ee, 76.60.-k, 75.10.Jm, 75.10.PqI Introduction
The problem of an antiferromagnet on a triangular planar lattice has been intensively studied theoretically. Kawamura_1985 ; Korshunov_1986 ; Anderson_1987 ; Plumer_1990 ; Chubukov_1991 The ground state in the Heisenberg and XY models is a “triangular” planar spin structure with three magnetic sublattices arranged 120∘ apart. The orientation of the spin plane is not fixed in the exchange approximation in the Heisenberg model. For the simplest semiclassical model of triangular structure with single antiferromagnetic exchange interaction between nearest neighbors the applied static field does not remove the degeneracy of the spin configurations. Therefore the usual small corrections such as quantum and thermal fluctuations, and relativistic interactions in the geometrically frustrated magnets play an important role in the formation of the equilibrium state. Korshunov_1986 ; Chubukov_1991 ; Rastelli_1996 Interests in triangular antiferromagnets are fueled by a rich variety of exotic phases which can be realized in such systems. Such model systems can be tested experimentally in three-dimensional (3D) crystals, where magnetic ions are located in the triangular lattice sites of crystallographic planes. If the in-plane interactions strongly exceed inter-plane interactions we can expect that such quasi-two-dimensional (quasi-2D) magnet will demonstrate the features typical for 2D models. Various realizations of quasi-2D antiferromagnets on triangular lattice are discussed in reviews (Refs. Collins_1997, ; Starykh_2015, ).
CuCrO2 is an example of quasi-2D antiferromagnet () with triangular lattice structure. Early neutron scattering experiments reveal that the electronic spin structure in CuCrO2 is in a planar 120-degree configuration below K, Kadowaki_1990 with a disorder caused by the frustration of the inter-plane exchange bonds. More recently, neutron scattering investigations Poienar_2009 in CuCrO2 single crystals detected a 3D planar magnetic order with incommensurate wave vector that slightly differs from the wave vector of a commensurate 120-degrees structure. The magnetic ordering is accompanied by a simultaneous crystallographic distortion Kimura_JPSJ_2009 of the regular triangular lattice and by the appearance of an electrical polarization. According to neutron scattering experiments Poienar_2010 the interaction between nearest Cr3+ ions within triangular plane is strongest. This in-plane interaction is more than 20 times larger than the frustrated inter-plane interaction. Thus, CuCrO2 can be considered as an example of quasi-2D antiferromagnet.
We present a NMR study of the low temperature magnetic structure of CuCrO2 in fields up to 45 T aligned along the crystallographic -axis. Such field direction corresponds to orientation within the spin plane of the spiral structure in low field range. The highest field in our experiments is about 1/6 of the saturation field which can be estimated using susceptibility value as T. Analysis of temperature and field evolution of NMR spectral shape reveals the magnetic H-T phase diagram of CuCrO2 and suggests the realized magnetic phases. In most respects, the main features of the observed phase diagram are consistent with the phase diagram obtained from electric polarization measurements measured in pulsed magnetic fields.Zapf_2014 ; Lin_2014 The observed spectra at low magnetic field ( T) can be well described by a 3D magnetic structure as detected by neutron experiments at zero field, Poienar_2010 whereas the NMR spectra observed at higher fields indicate the loss of the 3D magnetic ordering of CuCrO2. In this case the magnetic state of CuCrO2 can be modeled as a number of randomly stacked independently ordered 2D triangular magnetic layers. The transition from 3D to 2D state exhibits hysteretic behavior in both field and temperature. Surprisingly, the magnetic phase identified with NMR as 2D state at the same H-T region also demonstrates magnetically driven electric polarization.Zapf_2014 These facts indicate that the high field magnetic structure is, in fact, a 3D-polar phase with tensor order parameter, akin to Andreev and Grischuk’s -type nematic phase.Andreev_1984
II Crystal and magnetic structure
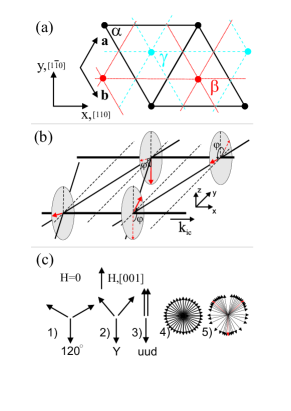
The structure CuCrO2 consists of magnetic Cr3+ (3, ), nonmagnetic Cu+, and O2- triangular lattice planes, which are stacked along -axis in the sequence Cr-O-Cu-O-Cr (space group , Å, Å at room temperature Poienar_2009 ). The layer stacking sequences are , , and for Cr, Cu and O ions, respectively. The crystal structure of CuCrO2 projected on the -plane is shown in Fig.1a. The distances between the nearest planes denoted by different Greek letters for copper and chromium ions and the pairs of planes for oxygen ions are , whereas the distance between the nearest oxygen planes denoted by the same letters is (Ref. [Poienar_2009, ]). No structural phase transition has been reported at temperatures higher than Néel ordering temperature ( K). In the magnetically ordered state the triangular lattice is distorted, so that one side of the triangle becomes slightly smaller than the two other sides: (Ref. [Kimura_JPSJ_2009, ]).
The magnetic structure of CuCrO2 has been intensively investigated by neutron diffraction experiments. Poienar_2009 ; Kadowaki_1990 ; Soda_2009 ; Soda_2010 ; Frontzek_2012 It was found that the magnetic ordering in CuCrO2 occurs in two stages. Frontzek_2012 ; Aktas_2013 At the higher transition temperature K, a transition to a 2D ordered state occurs, whereas below K, a 3D magnetic order with incommensurate propagation vector along the distorted side of triangular lattice planes Kimura_JPSJ_2009 is established. The magnetic moments of Cr3+ ions can be described by the expression
| (1) |
where and are two perpendicular unit vectors determining the spin plane orientation with the normal vector , is the vector to the -th magnetic ion and is an arbitrary phase. The spin plane orientation and the propagation vector of the magnetic structure are schematically shown at the bottom of Fig.1. For zero magnetic field is parallel to with , while is parallel to with (Ref. [Frontzek_2012, ]). The pitch angle between the neighboring Cr moments corresponding to the observed value of along the distorted side of triangular lattice planes is equal to 118.5∘ which is very close to 120∘ expected for regular triangular lattice planes structure.
Owing to the crystallographic symmetry at in the ordered phase () we can expect six magnetic domains. The propagation vector of each domain can be directed along one side of the triangle and can be positive or negative. As reported in Refs. [Soda_2010, ; Svistov_2013, ; Sakhratov_2014, ], the distribution of the domains is strongly affected by the cooling history of the sample. For field aligned along [001] axis all six domains are equivalent.
Inelastic neutron scattering data Poienar_2010 has shown that CuCrO2 can be considered as a quasi-2D magnet. The spiral magnetic structure is defined by the strong exchange interaction between the nearest Cr3+ ions within the triangular lattice planes with exchange constant meV. The inter-planar interactions are at least one order of magnitude weaker than the in-plane interaction and frustrated.
Results of the magnetization, electric polarization, ESR and NMR experiments Kimura_PRL_2009 ; Svistov_2013 ; Sakhratov_2014 have been discussed within the framework of the planar spiral spin structure at fields studied experimentally: T . ( T). The orientation of the spin plane is defined by the biaxial crystal anisotropy. One hard axis for the normal vector is parallel to the direction and the second axis is perpendicular to the direction of the distorted side of the triangle. The anisotropy along direction dominates with anisotropy constant approximately hundred times larger than that within -plane resulting from the distortions of the triangular structure. A magnetic phase transition was observed for the field applied perpendicular to one side of the triangle () at T, which was consistently described Kimura_PRL_2009 ; Soda_2010 ; Svistov_2013 by the reorientation of the spin plane from () to . This spin reorientation to “umbrella like” phase happens due to the weak susceptibility anisotropy of the spin structure , where and refer to fields parallel and perpendicular to , respectively. Further increase of applied field does not result to any additional phase transitions up to fields T. Zapf_2014 ; Lin_2014
For fields directed parallel to axis the magnetic phase diagram is much more complex. According to electric polarization studies in CuCrO2, at fields up to 92 T Zapf_2014 ; Lin_2014 the low temperature magnetic structure undergo a number of transitions. The phases realized during the magnetization process are not yet identified and shall be discussed in this paper.
III Sample preparation and experimental details
The sample we used in this experiment is the same as described in Ref. [Sakhratov_2014, ]. Measurements were taken on a superconducting Cryomagnetics 17.5 T magnet, a 30 T resistive magnet and 45 T hybrid magnet at the National High Magnetic Field Laboratory. All magnets were field sweepable. For technical reasons zero field cooling of the sample could not be performed while using 45 T magnet. 63,65Cu nuclei (nuclear spins , gyromagnetic ratios MHz/T, MHz/T) were probed using pulsed NMR technique. The spectra were obtained by summing fast Fourier transforms (FFT) or integrating the averaged spin-echo signals as the field was swept through the resonance line. NMR spin echoes were obtained using pulse sequences, where the pulse lengths were 1-3 s, the times between pulses were 15 s. Measurements were carried out in the temperature range K stabilized with a precision better than 0.1 K.
IV Experimental results
The crystal cell of CuCrO2 contains single copper ion. As a result the 63,65Cu NMR spectra for the paramagnetic states consist of two sets of triplets, corresponding to 63Cu and 65Cu isotopes. Each triplet corresponds to quadrupolar split transitions: a central line () and two quadrupole satellite transitions ().Sakhratov_2014 Below the magnetic ordering temperature, the narrow NMR line transforms into a broad spectrum characteristic of incommensurate magnetic structure. The shape of NMR spectrum is defined by the distribution of local magnetic fields on the copper nuclei within the sample. The observed shapes of NMR spectra depend on field, temperature and cooling history. For different lines in the triplet the spectra measured at the same conditions were found to be of the same shape. So, we chose the lines which were well distanced from neighbours to avoid overlapping.
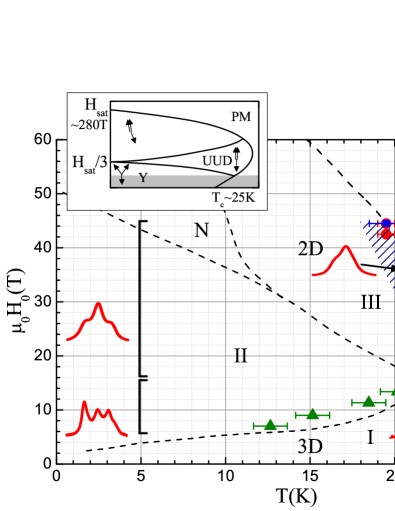
In order to facilitate the discussion connecting the magnetic structure to the NMR spectra, we shall refer extensively to the schematic phase diagram of CuCrO2 shown in Fig.2. The phase transitions observed in Refs.[Zapf_2014, ; Lin_2014, ] as anomalies on field dependencies of electric polarization are marked with dashed lines. The two-step transition from paramagnetic state to the ordered phase at zero field are marked with arrows. Frontzek_2012 ; Aktas_2013
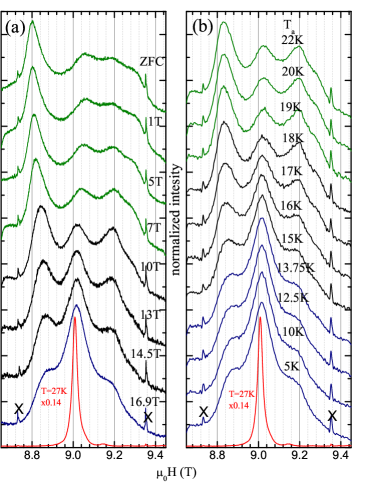
The temperature evolutions of 63Cu NMR spectra measured at frequencies 105.81 MHz, 498 MHz cooled in field from the paramagnetic state are shown in the Fig.3. The spectra shown in Fig.3a ( T) is typical for spectra measured at fields below 15 T. At high temperatures, , each spectrum is characterized by a single peak, as expected for paramagnetic phase. On the other hand, below , the spectra demonstrate a two-horn pattern characteristic of incommensurate structure, with a low-field peak more intense than the high-field peak. At temperatures below 20 K the two-horn spectrum becomes distorted: an additional maximum at the middle of the NMR spectrum appears and the high field maximum splits into two.
For fields above 15 T (and up to 45 T), the typical temperature evolution of the spectra is shown in Fig.3b (showing data for T). The spectra evolves from a single-peak line for K to an asymmetric helmet-shaped line which becomes more symmetric as the temperature is lowered. In the main panel of Fig.2, the cross-hatched region in the phase diagram indicates where the asymmetric helmet lineshape was observed.
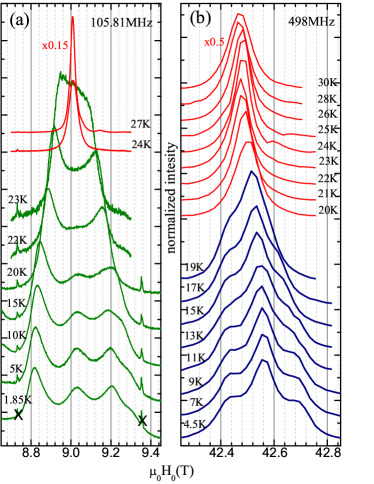
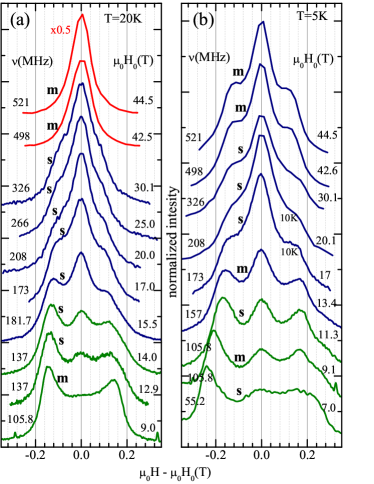
Fig.4 shows NMR spectra measured at K and 5 K at different fields. All spectra were measured while the sample is cooled in field (FC). The spectra in Figs.3,4 are differentiated by different colors: spectra with single peaks are red colored, two-horn and distorted two-horn shaped spectra are green colored. NMR spectra with helmet shape or distorted helmet shape spectra are blue colored. The spectrum transformation from single-peaked line-shape to two-horn or helmet-like one is sharp (see Fig.3). These transitions are marked on the phase diagram by red circles. The error bars at these points are defined by the temperature step between measured spectra.
The transition from the single-peak line to a broad line is hysteretic at high fields. At 44.5 T, the transition temperature upon cooling differs from the transition upon heating by 2 K. The open red circle on the phase diagram at 44.5 T corresponds to the transition observed while warming up. At fields below 17 T, the difference in the transition temperatures between cooling and warming is not more than the temperature steps at which the data were taken.
The shapes of the NMR spectra at low temperatures depend on the field at which the sample was cooled. Spectra measured at 105.8 MHz and K after field cooling from 40 K to 5 K is shown in the Fig.5a.
As elaborated in Ref.[Sakhratov_2014, ] the “double-horn” and “helmet” shaped NMR spectra in CuCrO2 are specific for incommensurate magnetic structures within triangular planes with inter-plane order and disorder respectively. Green triangles on the phase diagram denotes the boundary between H-T regions where double-horn spectra (i.e. 3D order) is realized independently on cooling procedure and the region where the NMR spectra (or out of plane ordering) depends on the cooling history. The region with hysteresis is marked with II on the phase diagram. The green points were obtained with the experimental procedure demonstrated in Fig.5b. First, the system was prepared by cooling the sample from K to K at a fixed field of 16.9 T and then reducing the field to 9 T. A typical spectrum obtained after such procedure has a helmet shape demonstrated by the lowest blue spectrum in both Fig.5a (labeled “16.9 T”) and Fig.5b (labeled “5 K”). While keeping the field at 9 T, the temperature of the sample is then raised to some temperature where it is annealed for 10 minutes before cooling back down to 5 K, at which point the spectrum is again obtained. Fig.5b shows the evolution of the 5 K spectrum as the annealing temperature is increased. It is evident that at 9 T, the 2D-3D transition, indicated by a transition from helmet to distorted double-horn lineshape, takes place at K. This transition point is represented by a green triangle on the phase diagram.
Not all phases can be differentiated by the shape of NMR spectra. So, within the high temperature phase between and single line shaped spectra were observed, as in the paramagnetic phase. To determine this transition we measured the temperature dependence of spin-lattice relaxation rate at fields 17, 30 and 44.5 T from 40 K to 5 K, shown in Fig.6. was extracted using multi exponential expression.Suter_1998
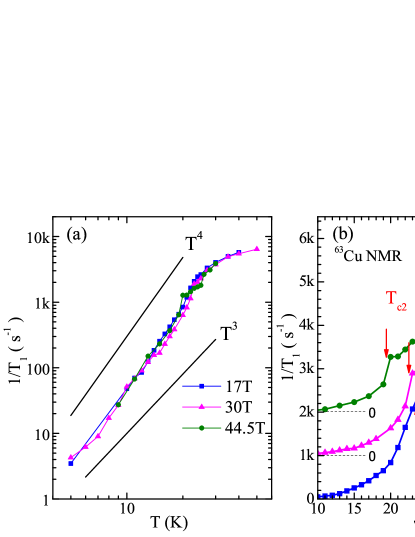
The temperature dependence of the relaxation rate at approximately follows a power law behavior with an exponent equal to (Fig.6a). In Fig.6b, anomalous discontinuities in the behavior of (positions marked with arrows) are observed and they are plotted with blue squares in Fig.2. Note that at temperatures below we did not find any singularity corresponding to the transition to the low temperature high field phase observed in pulse field experiments Zapf_2014 identified as phase N in Fig.2.
From these experimental observations and referring to Fig.2, we summarize the phase diagram as follows: 1) There are two regions, identified as C and PM where the NMR spectra are single peaked. 2) Two regions, I and III, are identified with either two-horn or helmet shaped spectra. These phases are separated by 3) a broad region II, where the spectra demonstrate hysteretic behavior. The spectral shape in this region is a subtle combination of those in I and III and is determined by cooling history. This large hysteresis was also observed in pulsed fields experiments.Zapf_2014
V Discussion
The dominant interactions, which govern the magnetic state of CuCrO2, are exchange interactions within triangular -plane.Poienar_2010 The intra-plane exchange interaction between spins of nearest chromium ions is at least 20 times larger than the frustrated inter-plane exchange interactions. We shall first discuss the magnetic phases within the model of a 2D antiferromagnet on the regular triangular lattice. For such a model, in the limit of large spins, the magnetic ground state is expected to be planar three-sublattice 120-degree structure. The spin plane orientation in exchange approximation is arbitrary. This degeneracy may be lifted by taking into account the relativistic interactions with the crystal environment. The orientation of the spin plane in CuCrO2 in the ordered state, i.e. along (110), is defined by two “easy” axes of anisotropy: a strong axis [001] perpendicular to triangular planes and another weak axis within the triangular planes . This model can be described by the model Hamiltonian:
| (2) |
where the exchange integral between nearest spins: K, Poienar_2010 and the anisotropy parameters are: K, K. Yamaguchi_2010 ; Svistov_2013
The in-plane anisotropy parameter is less than 1 % of that of the out-of-plane anisotropy. That means, that the model with one “easy” axis can be a good approximation. The ground magnetic state in such a model is the so-called three sublattice Y-phase, see Fig.1c1.Miyashita_1986 ; Chubukov_1991 This phase possesses spontaneous magnetic moment and at two domains are allowed. The spontaneous magnetization of three-neighbor magnetic moments is evaluated from the exchange and anisotropy parameters of CuCrO2 as , where is magnetic moment of chromium ion.Miyashita_1986 ; Chubukov_1991 The application of magnetic field along anisotropy axis removes the degeneracy. The magnetization of the sample grows monotonically with field up to 1/3 of the saturated magnetization. Such value of magnetization is expected to be maintained in some field range in the vicinity of the value 1/3Hsat. In this field range the collinear up-up-down (UUD) phase is expected. The field range of UUD phase is stabilized by uniaxial anisotropy and thermal fluctuations. The thermal fluctuations in the vicinity of TN for anisotropic model can stabilize UUD phase even at zero field.Miyashita_1986 This fact probably explains the two-stage transition from paramagnetic to ordered phase in CuCrO2.
The H-T phase diagram of 2D Heisenberg antiferromagnet on the triangular lattice from Ref. [Miyashita_1986, ] is shown as insert to Fig.2. The field range studied in our experiments is shaded. The field axis was scaled using the value of exchange integral K, which corresponds to T. Thus within the 2D regular triangular antiferromagnetic model for field range T we can expect Y-phase at low temperature, collinear UUD phase and paramagnetic phase at higher temperatures. Note, that the magnetic ordering temperature of CuCrO2( K) is in a good agreement with T K, evaluated within 2D XY-model of triangular antiferromagnet.Landau_1985
According to Ref. [Marchenko_2014, ] the main properties of antiferromagnetic CuCrO2 have natural explanation based on Dzyaloshinski-Landau theory of magnetic phase transitions. Firstly, let us consider the properties of CuCrO2 which can be explained by strongest exchange couplings. The crystal structure of CuCrO2 allows for the Lifshitz invariant which couples spins of neighboring triangular planes and explains the helicoidal spin structure with incommensurate wave vector. The proximity of the wave vector of magnetic structure for CuCrO2, (0.329,0.329,0), to the wave vector of a simple 120-degree structure (1/3,1/3,0) demonstrates the smallness of Lifshitz invariant compared with intra-plane exchange interaction. The difference of the pitch angle of the spins of the neighboring magnetic ions versus 120 degrees causes a nonzero magnetic moment on every triangle of the structure rotating within spin plane along the wave vector direction with period approximately equal to hundred sides of triangle structure (see Eq.1). The value of noncompensated rotated moment for every three neighbor magnetic ions is calculated to be 0.045, where is the magnetic moment of chromium ion. This value is approximately 15 times larger than the magnetic moment expected due to uniaxial anisotropy. The applied magnetic field will distort the triangles so that the total magnetic moments are aligned along energetically preferable field direction. We can expect that the magnetic field can induce the nonharmonic distortion of magnetic structure which stabilizes the preferable Y-like configuration because of its energetic favorability. At high enough fields a transition to commensurate phases is expected.
The inter-plane interaction in CuCrO2 is strongly frustrated and as a result, 3D magnetic ordering with the propagation vector (0.329,0.329,0) observed in the experiment can not be established due to usual exchange interactions between two spins of neighbor triangular planes. 3D ordering can be established, according to Ref.[Marchenko_2014, ], due to the symmetry invariants with at least six spin operators of ions originating from two or three neighbor triangular planes. At the same time, 3D ordering of vector (see Eq.1) can be caused by other invariants with a smaller number of spin operators (namely four). Due to this fact it is possible that the vector will be ordered at a temperature higher than the usual 3D spiral magnetic ordering temperature. The magnetic structure with order parameter can be described by Eq.1 with random phases for different triangular planes.
Symmetry analysis of relativistic interactions in CuCrO2 explains the existence of electric polarization proportional to vector of magnetic structure.Marchenko_2014 For 3D-ordered spiral phase such polarization was observed experimentally.Kimura_PRB_2008 ; Kimura_PRL_2009 It is important that the electric polarization is expected also for magnetic phase with tensor order parameter .Marchenko_2014
To identify the magnetic phases occuring in CuCrO2, NMR spectra for different model structures were calculated. In our calculation we assume that the local magnetic field at Cu sites is the sum of the long-ranged dipole field and the transferred hyperfine contact field produced by the nearest Cr3+ moments. The details of this calculation can be found in our previous study. Sakhratov_2014 Below we shall list the model phases that we used to explain the observed shapes of the NMR spectra of CuCrO2 at fields aligned along [001].
1. Paramagnetic and collinear UUD structures.
Effective fields generated by magnetic environment on each copper ion are identical.
As a result, one single peaked NMR spectrum is expected. The position of the line is defined by the total magnetization.
2. 3D commensurate Y structure.
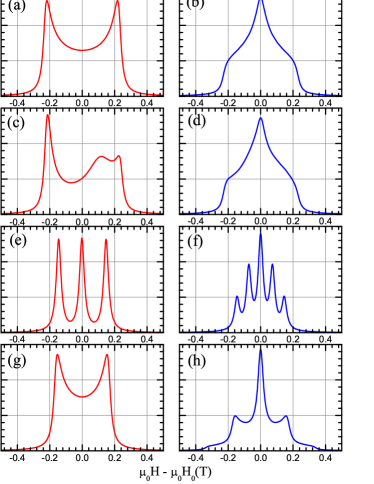
This is described by Eq.1 with propagation vector (1/3,1/3,0). The initial phase measured from can be equal to , or . The choice of determines one of three possible magnetic domains. The computed spectrum for such 120-degree Y structure (see Fig.1c1) is given in Fig.7e. The commensurate 120-degree Y phase can be deformed due to applied field: the moments of two of three sublattices are tilted towards field direction (Fig.1c2). In this case simulated spectrum consists of three lines of equal intensity as for 120-degree Y structure.
3. 2D commensurate Y structure.
This is described by Eq.1 with 2D propagation vector (1/3,1/3).
The magnetic domain which is established within every -plane was chosen arbitrary. This was achieved by random selection of among the values , , . The computed spectrum consists of 5 lines, see Fig.7f.
4. 3D incommensurate structure.
This is described by Eq.1 with propagation vector (0.329,0.329,0), see Fig.1c4.
The initial phase can be any, but the same for all triangular planes. The result is shown in
Fig.7a. Such shape with two maxima at the boundaries is typical for incommensurate structures.
5. 3D incommensurate distorted structure.
For this structure we introduced in Eq.1 a small nonlinearity in phase:
| (3) |
where defines the amplitude of unharmonicity. Such unharmonicity tilts the spins within spiral towards to the Y phase (phase angles , , measured from ) in contrast to upside down Y phase (phase angles , , ), see Fig.1c5. The result is shown in Fig.7c.
6. 3D-polar and 2D incommensurate structures.
The incommensurate phases, distorted and undistorted, were simulated for two types of disorder. In the first case parameters in all triangular planes of the structure were chosen arbitrarily (see Eqs.1,3), whereas the direction of the rotation of spins within the triangular planes and, therefore, the sign of vector , was set to be the same. We shall assign this phase as 3D-polar ordered phase with order parameter .
For the second type of disorder both and sign of for all triangular planes were arbitrary. We shall assign this phase as 2D-ordered phase. The 2D long range order is possible only at zero temperature. Nevertheless, because the NMR experiment is sensitive only to the nearest magnetic neighborhood of the nuclei, we can expect that the spectra obtained within this model will also describe the magnetic structure with short ranged spiral correlations with different signs of , which are expected for 2D triangular structure.Korshunov_2006 The shapes of simulated spectra for both types of disorder were identical.
The result for undistorted 3D-polar and 2D phases is in Fig.7b, for distorted ones is in Fig.7d.
The characteristic feature of spectra from the magnetic structure with partial disorder is the presence of strong central maximum on the spectra.
7. Spin-flopped umbrella-like structures.
This is described by Eq.1 with for 3D, 3D-polar and 2D phases.
3D and 3D-polar structures both resulted in an identical double horn pattern (Fig.7g).
2D structure resulted in a spectrum with 5 characteristic maxima (Fig.7h).
From comparison of experimental data with the models’ simulations we can exclude from consideration commensurate and spin-flopped structures (Fig.7e,f,g,h). These phases were suggested from microscopic model studied numerically in Ref. [Lin_2014, ]. The spectra with 3 and 5 maxima were not observed in experiment. Double horn shaped spectra were observed only at low fields, where the umbrella-like structure with is certainly not realized.
As a result of modeling we suggest the following magnetic structures realized within the studied H-T region. In all fields below T at temperatures below the red solid symbols on the phase diagram an incommensurate spiral phase is established within individual planes. In region I the system is 3D ordered. At higher fields (region III) the 3D-polar or 2D structure is established. Within the broad region II on the phase diagram the spectra exhibits hysteresis where the inter-plane ordering essentially depends on cooling history. At high temperatures K the transition from I to III has no field hysteresis. The field hysteresis grows drastically at lower temperatures.
The area on phase diagram bounded by two lines between and can be considered as collinear UUD phase. The NMR spectra within this phase has single-peaked shape. The phase boundaries for this phase marked on the phase diagram were obtained from the anomalies on the temperature dependencies of spin lattice relaxation time . The temperature range of existence of this phase increases with field, consistent with theoretical expectations.Miyashita_1986
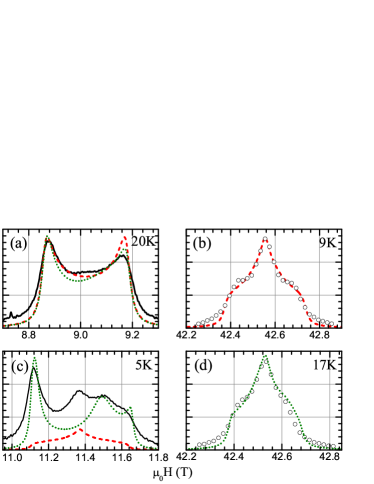
The fits to the experimental NMR spectra using suggested models are shown in Fig.8. The NMR spectra measured in regions I and III can be fitted satisfactorily by 3D and 2D incommensurate magnetic structures. The observed asymmetry of the spectra can be described by the unharmonicity of helical structure discussed above (Fig.8a,d). The complicated shape of spectra observed within the hysteretic region II of the phase diagram can be fitted by superposition of the spectra from 2D and 3D incommensurate structures (Fig.8c). The shape of NMR spectra is also dependent on the differences in spin-spin relaxation time along the spectrum lines. However, the measured along a spectrum for sampling spectra show that the correction of the spectra can change the relative intensity by not more than 15 %.
Finally, we note that the local field on the nucleus measured by NMR experiment is formed by neighboring magnetic ions of few coordination spheres. It means that similar spectral shapes can also be obtained in the presence of corresponding short range correlations, static during the NMR experiment ( ms).Comment
VI Conclusions
The magnetic phase diagram of CuCrO2 is studied with Cu NMR for . NMR experiments revealed the H-T regions where 2D/3D-planar spiral, UUD and paramagnetic phases are realized. The 2D-planar spiral phase realized in region III is very unusual. On one hand, according to NMR the usual 3D order is absent, but at the same time this phase possesses electric polarization.Zapf_2014 Symmetry analysis of magnetic properties of CuCrO2Marchenko_2014 allows one to explain these observations by a realization of 3D magnetic state with tensor order parameter. This phase can be classified as a polar nematic phase.
Acknowledgements.
We thank V. I. Marchenko, N. Büttgen, V. N. Glazkov, A. I. Smirnov for stimulating discussions. H.D.Z. thanks for the support from NSF-DMR through award DMR-1350002. This work was supported by Russian Foundation for Basic Research, Program of Russian Scientific Schools (Grant 16-02-00688). Work at the National High Magnetic Field Laboratory is supported by the NSF Cooperative Agreement No. DMR-1157490, the State of Florida, and the DOE.References
- (1) H. Kawamura and S. Miyashita, J. Phys. Soc. Jpn. 54, 4530 (1985).
- (2) S. E. Korshunov, J. Phys. C: Solid State Phys. 19, 5927 (1986).
- (3) P. W. Anderson, Science, 235, 1196 (1987).
- (4) M. L. Plumer and A. Caille, Phys. Rev. B 42, 10388 (1990).
- (5) A. V. Chubukov and D. I. Golosov, J. Phys.: Condens. Matter 3, 69 (1991).
- (6) E. Rastelli and A. Tassi, J. Phys.: Condens. Matter 8, 1811 (1996).
- (7) M. F. Collins and O. A. Petrenko, Can. J. Phys., 75, 605 (1997).
- (8) Oleg A. Starykh, Rep. Prog. Phys. 78, 052502 (2015).
- (9) H. Kadowaki, H. Kikuchi and Y. Ajiro, J. Phys.: Condens. Matter 2, 4485-4493 (1990).
- (10) M. Poienar, F. Damay, C. Martin, V. Hardy, A. Maignan, and G. Andre, Phys. Rev. B 79, 014412 (2009).
- (11) K. Kimura, T. Otani, H. Nakamura, Y. Wakabayashi, and T. Kimura, J. Phys. Soc. Jpn. 78, 113710 (2009).
- (12) M. Poienar, F. Damay, C. Martin, J. Robert, and S. Petit, Phys. Rev. B 81, 104411 (2010).
- (13) Eundeok Mun, M. Frontzek, A. Podlesnyak, G. Ehlers, S. Barilo, S.V. Shiryaev, and Vivien S. Zapf, Phys. Rev. B 89, 054411 (2014).
- (14) Shi-Zeng Lin, Kipton Barros, Eundeok Mun, Jae-Wook Kim, Matthias Frontzek, S. Barilo, S.V. Shiryaev, Vivien S. Zapf, and Cristian D. Batista, Phys. Rev. B 89, 220405(R) (2014).
- (15) A. F. Andreev and I. A. Grishchuk, Sov. Phys. JETP 60, 267 (1984).
- (16) M. Soda, K. Kimura, T. Kimura, M. Matsuura, K. Hirota, J. Phys. Soc. Jpn. 78, 124703 (2009).
- (17) M. Soda, K. Kimura, T. Kimura, and K. Hirota, Phys. Rev. B 81, 100406(R) (2010).
- (18) M. Frontzek, G. Ehlers, A. Podlesnyak, H. Cao, M. Matsuda, O. Zaharko, N. Aliouane, S. Barilo, S. V. Shiryaev, J. Phys.: Condens. Matter 24, 016004 (2012).
- (19) O. Aktas, G. Quirion, T. Otani, and T. Kimura, Phys. Rev. B 88, 224104 (2013).
- (20) A. M. Vasiliev, L. A. Prozorova, L. E. Svistov, V. Tsurkan, V. Dziom, A. Shuvaev, Anna Pimenov, and A. Pimenov, Phys. Rev. B 88, 144403 (2013).
- (21) Yu. A. Sakhratov, L. E. Svistov, P. L. Kuhns, H. D. Zhou, and A. P. Reyes, JETP 119, iss. 5, 880 (2014).
- (22) K. Kimura, H. Nakamura, S. Kimura, M. Hagiwara, and T. Kimura, Phys. Rev. Lett. 103, 107201 (2009).
- (23) S. Miyashita, J. Phys. Soc. Jpn. 55, 3605 (1986). See also: M. V. Gvozdikova, P.-E. Melchy, M. E. Zhitomirsky, J. Phys.: Condens. Matter 23, 164209 (2011).
- (24) A. Suter, M. Mali, J. Roos, and D. Brinkmann, J. Phys.: Condens. Matter 10, 5977 (1998).
- (25) H. Yamaguchi, S. Ohtomo, S. Kimura, M. Hagiwara, K. Kimura, T. Kimura, T. Okuda, and K. Kindo, Phys. Rev. B 81, 033104 (2010).
- (26) D. H. Lee, J. D. Joannopoulos, J. W. Negele, and D. P. Landau, Phys. Rev. B 33, 450 (1986).
- (27) V. I. Marchenko, JETP 119, 1084 (2014).
- (28) K. Kimura, H. Nakamura, K. Ohgushi, and T. Kimura, Phys. Rev. B 78, 140401(R) (2008).
- (29) S. E. Korshunov, Phys. Usp. 49, 225 (2006).
- (30) This estimate we obtained from the fact that the effective field on each nucleus has to remain constant at least during experimentally measured time . In the ordered phase ms, see Fig.6.