Subarcsecond international LOFAR radio images of
Arp 220 at 150 MHz
Abstract
Context. Arp 220 is the prototypical ultra luminous infrared galaxy (ULIRG). Despite extensive studies, the structure at MHz-frequencies has remained unknown because of limits in spatial resolution.
Aims. This work aims to constrain the flux and shape of radio emission from Arp 220 at MHz frequencies.
Methods. We analyse new observations with the International Low Frequency Array (LOFAR) telescope, and archival data from the Multi-Element Radio Linked Interferometer Network (MERLIN) and the Karl G. Jansky Very Large Array (VLA). We model the spatially resolved radio spectrum of Arp 220 from 150 MHz to 33 GHz.
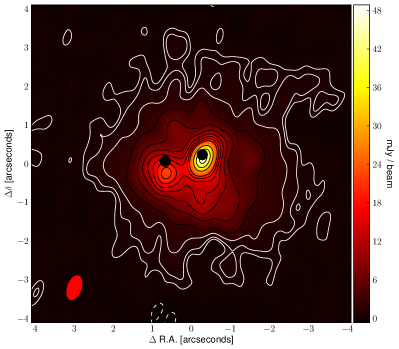
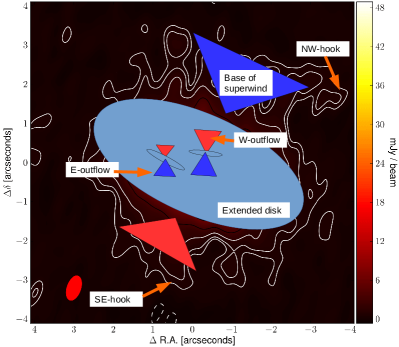
Results. We present an image of Arp 220 at 150 MHz with resolution , sensitivity 0.15 mJy beam-1, and integrated flux density mJy. More than 80% of the detected flux comes from extended (2.2 kpc) steep spectrum () emission, likely from star formation in the molecular disk surrounding the two nuclei. We find elongated features extending (110 pc) and (330 pc) from the eastern and western nucleus respectively, which we interpret as evidence for outflows. The extent of radio emission requires acceleration of cosmic rays far outside the nuclei. We find that a simple three component model can explain most of the observed radio spectrum of the galaxy. When accounting for absorption at 1.4 GHz, Arp 220 follows the FIR/radio correlation with , and we estimate a star formation rate of 220 M. We derive thermal fractions at 1 GHz of less than 1% for the nuclei, which indicates that a major part of the UV-photons are absorbed by dust.
Conclusions. International LOFAR observations shows great promise to detect steep spectrum outflows and probe regions of thermal absorption. However, in LIRGs the emission detected at 150 MHz does not necessarily come from the main regions of star formation. This implies that high spatial resolution is crucial for accurate estimates of star formation rates for such galaxies at 150 MHz.
Key Words.:
galaxies: individual: Arp 220 – galaxies: starburst – galaxies: star formation – techniques: high angular resolution1 Introduction
Arp 220 is the closest (77 Mpc) ULIRG and has been extensively studied across the electromagnetic spectrum. It is a late-stage merger, which explains the peculiar morphology noted by Arp (1966). The centre is heavily obscured in the optical, but radio observations reveal two bright sources about 1′′ (370 pc) apart, thought to be the nuclei of two merging galaxies (Norris, 1988). The two nuclei resemble rotating exponential disks with ongoing star formation (Sakamoto et al., 1999, 2008; Scoville et al., 2015; Barcos-Muñoz et al., 2015), giving rise to dozens of supernovae and supernova remnants detected using very long baseline interferometry (VLBI) at cm wavelengths (Smith et al., 1998; Lonsdale et al., 2006; Parra et al., 2007; Batejat et al., 2011). While most of the dust and GHz radio continuum comes from the two nuclei (Sakamoto et al., 2008; Barcos-Muñoz et al., 2015), CO observations reveal extended dense molecular gas surrounding the nuclei in a kpc-scale ring or disk (Scoville et al., 1997; Downes & Solomon, 1998; Sakamoto et al., 2008; König et al., 2012). Optical and X-ray observations provide evidence for a bi-conical outflow, or superwind, carrying energy and matter out to several kpc from the centre of the galaxy (Heckman et al., 1990; Arribas et al., 2001; McDowell et al., 2003).
While there is plenty of evidence for intense star formation in Arp 220, the presence of one or more active galactic nuclei (AGN) has not been established. Yun et al. (2001) finds Arp 220 fainter at 1.4 GHz than expected from the FIR/radio correlation for star forming galaxies. This may be because part of the IR comes from a radio-weak AGN, which could also explain the lack of a clear AGN-candidate amongst the compact objects detected with cm-VLBI. Unfortunately the extreme column densities of cm-2 (Wilson et al., 2014) towards the nuclei greatly hinders X-ray observations which could offer direct evidence of AGN activity.
The lack of radio emission could also be explained if the synchrotron emission from the nuclei is significantly reduced by thermal (free-free) absorption at GHz frequencies. Since this effect is most prominent at lower frequencies (see e.g. Condon 1992), observations at MHz frequencies may constrain the properties and structure of the absorbing medium.
Regardless of the presence of an AGN in Arp 220, the mechanical energy from the central starburst would likely contribute significantly to the large-scale superwind. This could manifest itself as outflows from the nuclei and the surrounding molecular disk. Indeed, evidence of outflows from the nuclei with speeds of a few hundred km s-1 has been reported (Sakamoto et al., 2009; Tunnard et al., 2015). These outflows could carry synchrotron-emitting cosmic rays (CRs) out from the nuclei where they could potentially be observed at radio frequencies. Star formation in the molecular disk would also give rise to radio emission on kpc-scales, i.e. far outside the nuclei. The intrinsic steep spectrum of unabsorbed synchrotron emission makes a detection of weak extended emission challenging at GHz frequencies, and indeed no detection of kpc-scale radio emission has been reported.
Although Arp 220 has been observed at MHz frequencies before (Sopp & Alexander, 1991; Waldram et al., 1996; Douglas et al., 1996), none of those studies resolved the galaxy. Subarcsecond resolution is crucial to understand the relative contributions from the emitting and absorbing structures in the centre of Arp 220.
In this paper, we, for the first time, resolve Arp 220 at 150 MHz using the international LOFAR telescope. To complement these observations, we combine archival data from the VLA and MERLIN arrays to obtain both high resolution and sensitivity to extended structure at 1.4 GHz. In Sect. 2 we describe the data used in this paper. In Sect. 3 we present our results from the observations, in Sect. 4 we describe our modelling, and in Sect. 5 we discuss the results and modelling in the context of previous studies. Finally, in Sect. 6, we summarise our conclusions.
Throughout this paper we assume a distance to Arp 220 of 77 Mpc (=70 km s-1 Mpc-1), i.e. =37 pc, and all spectral indices, , are given according to the power law .
2 Observations and data reduction
In this section we describe the data used in this paper. The focus of this paper is new data obtained at 150 MHz using the International LOFAR telescope. These data are briefly described in Sect. 2.1, and the interested reader can find more details in Appendix A. To complement our LOFAR observations, we also present a new image obtained at 1.4 GHz by combining archival data from the VLA and MERLIN arrays, as described in Sect. 2.2. Finally, in Sect. 2.3, we briefly describe five additional images included for comparison: radio continuum at 6 GHz and 33 GHz from the VLA, CO(1-0) and CO(2-1) from the IRAM Plateau de Bure interferometer, and an optical image from the Hubble Space Telescope (HST).
2.1 LOFAR at 150 MHz
We present new data from the International LOFAR telescope, project LC2_042 (P.I.: E. Varenius). These data were taken between 18:30 and 02:15 UT (with six hours on Arp 220) on June 4th 2014, including 46 LOFAR high band array (HBA) stations: 24 core stations (CS) in joined mode (where the two 24-tile “ears” of the station are added to form a single station), 14 remote stations (RS), and eight international stations (IS). The total available bandwidth was split equally between two simultaneous beams of width 48 MHz (240 sub-bands), centred on 150 MHz; one on Arp 220 and one on the bright and compact calibrator J1513+2388 separated from Arp 220 by . Every 20 minutes the observations switched, for 2 minutes to a single beam on the absolute flux density calibrator 3C295 separated from Arp 220 by 32∘. Although in theory a single scan of 3C295 is sufficient to determine the flux scale, we included scans every 20 minutes to a) track residual beam effects over time and b), track phase variations between CS to enable coherent addition of CS to increase sensitivity in case J1513+2388 was weaker than expected. While no addition of CS was necessary for calibration, we found significant beam effects which limited the time range used for setting the flux scale and spectral index. We carefully selected a time range where these beam effects cause amplitude uncertainties of at most 10 %. Based on the measured gain variations as function of elevation angle, and the uncertainties on the flux scale as given by Scaife & Heald (2012), we estimate the flux density to be accurate to within 15 %.
Residual delays and rates, caused by the e.g. the ionosphere and imperfect station clocks, are significant on international baselines and have to be removed before further calibration and imaging. It is challenging to find a nearby (few degrees to track the ionosphere) source which is bright enough on subarcsecond scales (for international baselines) to derive phase corrections for each channel (or sub-band) (Moldón et al., 2014). Instead we determined residual delays and rates towards J1513+2388 by combining sub-bands together assuming a piece-wise linear approximation for eight blocks of 5.9 MHz each, a strategy similar to the one used by Varenius et al. (2015) for M82.
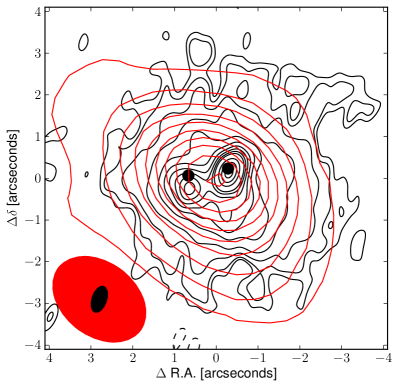
Residual phase errors were corrected by hybrid imaging of Arp 220. This method solves for relative phase errors, but does not give absolute phase information. The absolute position of Arp 220 was therefore determined by matching the positions of two compact sources detected 5’ from Arp 220 both at 150 MHz and 1.4 GHz. We conservatively estimate our positional uncertainty to be at most mas in R.A. and mas in Dec. The data were calibrated in AIPS 31DEC15 (Greisen, 2003) using ParselTongue 2.0 (Kettenis et al., 2006). Using the multi-scale CLEAN algorithm, as implemented in CASA 4.5.2 (McMullin et al., 2007), we obtained a continuum image of Arp 220 at 150 MHz with resolution of and RMS noise 0.15 mJy beam-1 (see Fig. 1(a)). Further details about calibration and imaging of these data can be found in Appendix A.
| Source | R. A. [J2000] | Dec. [J2000] |
|---|---|---|
| 3C295 a𝑎aa𝑎aFrom NED, http://ned.ipac.caltech.edu. | ||
| Arp 220 b𝑏bb𝑏bLOFAR correlation position. | ||
| J1513+2388 c𝑐cc𝑐cArchival VLA/MERLIN position was updated using the rfc_2015d catalogue available via http://astrogeo.org/calib/search/html. | ||
| 1551+239 c𝑐cc𝑐cArchival VLA/MERLIN position was updated using the rfc_2015d catalogue available via http://astrogeo.org/calib/search/html. |
2.2 VLA and MERLIN at 1.4 GHz
To complement our LOFAR data we re-calibrated and combined archival data from MERLIN and VLA at 1.4 GHz. In this section we describe the calibration and imaging of these data.
2.2.1 VLA at 1.4 GHz
We used archival VLA-data observed on March 25th 1998 (project AA216) in
A-configuration with 5.5 hours on Arp 220. The 12.5 MHz bandwidth was split
into two spectral windows of 31 channels each, centred on 1374 MHz and
1424 MHz. The data were calibrated in a standard manner using ParselTongue 2.0
(Kettenis et al., 2006) and AIPS 31DEC15 (Greisen, 2003). Phase corrections were
first derived using J1513+2338, assuming the position in the rfc_2015d
catalogue (see Table 1), and refined using self-calibration
of Arp 220. The flux scale was set by 3C286, assuming 15.3 Jy and 15.0 Jy
in the two respective spectral windows (as calculated by SETJY in AIPS).
We adopt an absolute flux density uncertainty of 10% for these data.
2.2.2 MERLIN at 1.4 GHz
We used archival MERLIN data taken on January 30th 1996 with 8.3 hours on Arp 220, previously published by Mundell et al. (2001). We choose to re-calibrate the data to be able to combine them in Fourier space with the VLA data described in Sect. 2.2.1. The MERLIN data cover 7.8 MHz bandwidth split in 63 channels, centred on 1.42 GHz where Arp 220 has deep HI absorption. The time resolution was 16 seconds per sample. The data were calibrated in a standard manner in AIPS 31DEC15 (Greisen, 2003) using ParselTongue 2.0 (Kettenis et al., 2006). Phase corrections were first derived using 1551+239, assuming the position in the rfc_2015d catalogue (see Table 1), and refined using self-calibration of Arp 220. The flux scale was set by 3C286 using a model supplied by the eMERLIN staff to account for resolution effects where the total flux density was set to 14.98 Jy. The visibility weights were re-calculated to reflect the RMS scatter within 10 minute intervals. We adopt an absolute flux density uncertainty of 10% for MERLIN. To avoid effects of HI absorption known to be significant towards the nuclei, we, after inspection of which channels showed strong HI absorption, excluded the ten middle channels (1.25 MHz) of the MERLIN data when imaging the combined VLA+MERLIN data as described below.
2.2.3 Combining VLA and MERLIN
To achieve, at 1.4 GHz, both sensitivity to extended emission as well as
subarcsecond resolution, we combined the calibrated UV-data from VLA and MERLIN
into one measurement set using the task concat in CASA. Using the CLEAN
algorithm as implemented in CASA 4.5.2, with robustness parameter
(Briggs, 1995) we obtained an image with resolution and
RMS noise Jy beam-1.
2.3 Additional images included for interpretation
We include five additional images obtained by previous studies (i.e., we did not remake the images ourselves).
For comparison of primarily the extended emission detected at 150 MHz, we
include a radio continuum image at 6 GHz published by
Barcos-Muñoz et al. (2015).
We note that although the 6 GHz
image is very sensitive with RMS noise 14 Jy beam-1 (where
the beam is ), Barcos-Muñoz et al. (2015) do not plot contours
lower than 12.5 in their Fig. 1 since their analysis focuses on the
nuclei. We are however interested also in the weaker extended emission and therefore
show also fainter contours in our Fig. 2(b). To compute
pixel-wise spectral index maps, we used the task imregrid in CASA with
linear interpolation to decrease the pixel size of the 6 GHz image from
to the used elsewhere in this paper.
For modelling of the spectra of the nuclei, we also use the image obtained at 33 GHz by Barcos-Muñoz et al. (2015), their Fig. 1c, with resolution and RMS noise 23 Jy beam-1. The positions of the nuclear disks, as fitted by Barcos-Muñoz et al. (2015) using this 33 GHz image, are plotted as black circles in multiple figures in this paper to guide the eye when comparing the structure at different frequencies.
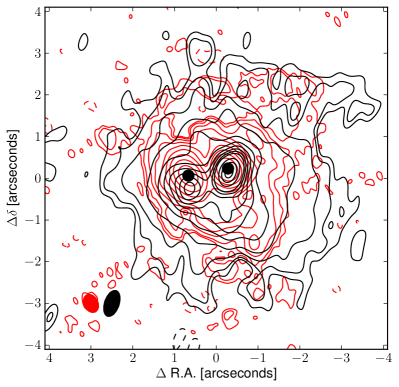
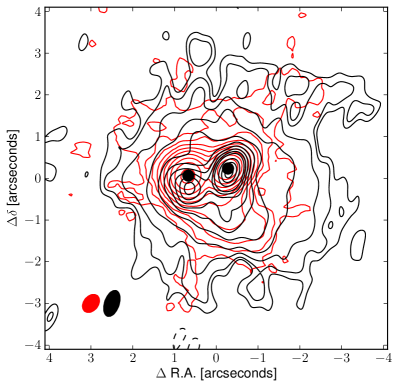
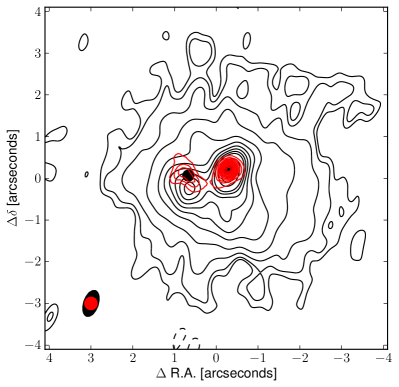
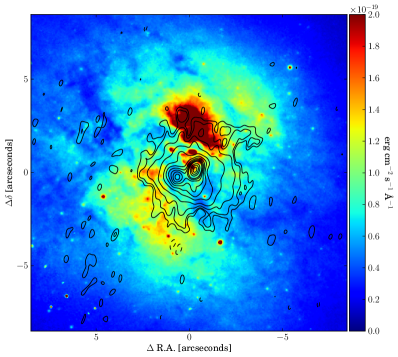
For comparison to the structure of molecular gas, we include moment zero images of CO(1-0) and CO(2-1) from the IRAM Plateau de Bure interferometer, previously described by König et al. (2012). The CO(1-0) image is shown as red contours in Fig. 2(c), with resolution and RMS noise 13.906 K kms-1.The CO(2-1) image is shown as red contours in Fig. 2(d), with resolution and RMS noise 1184.69 K kms-1.
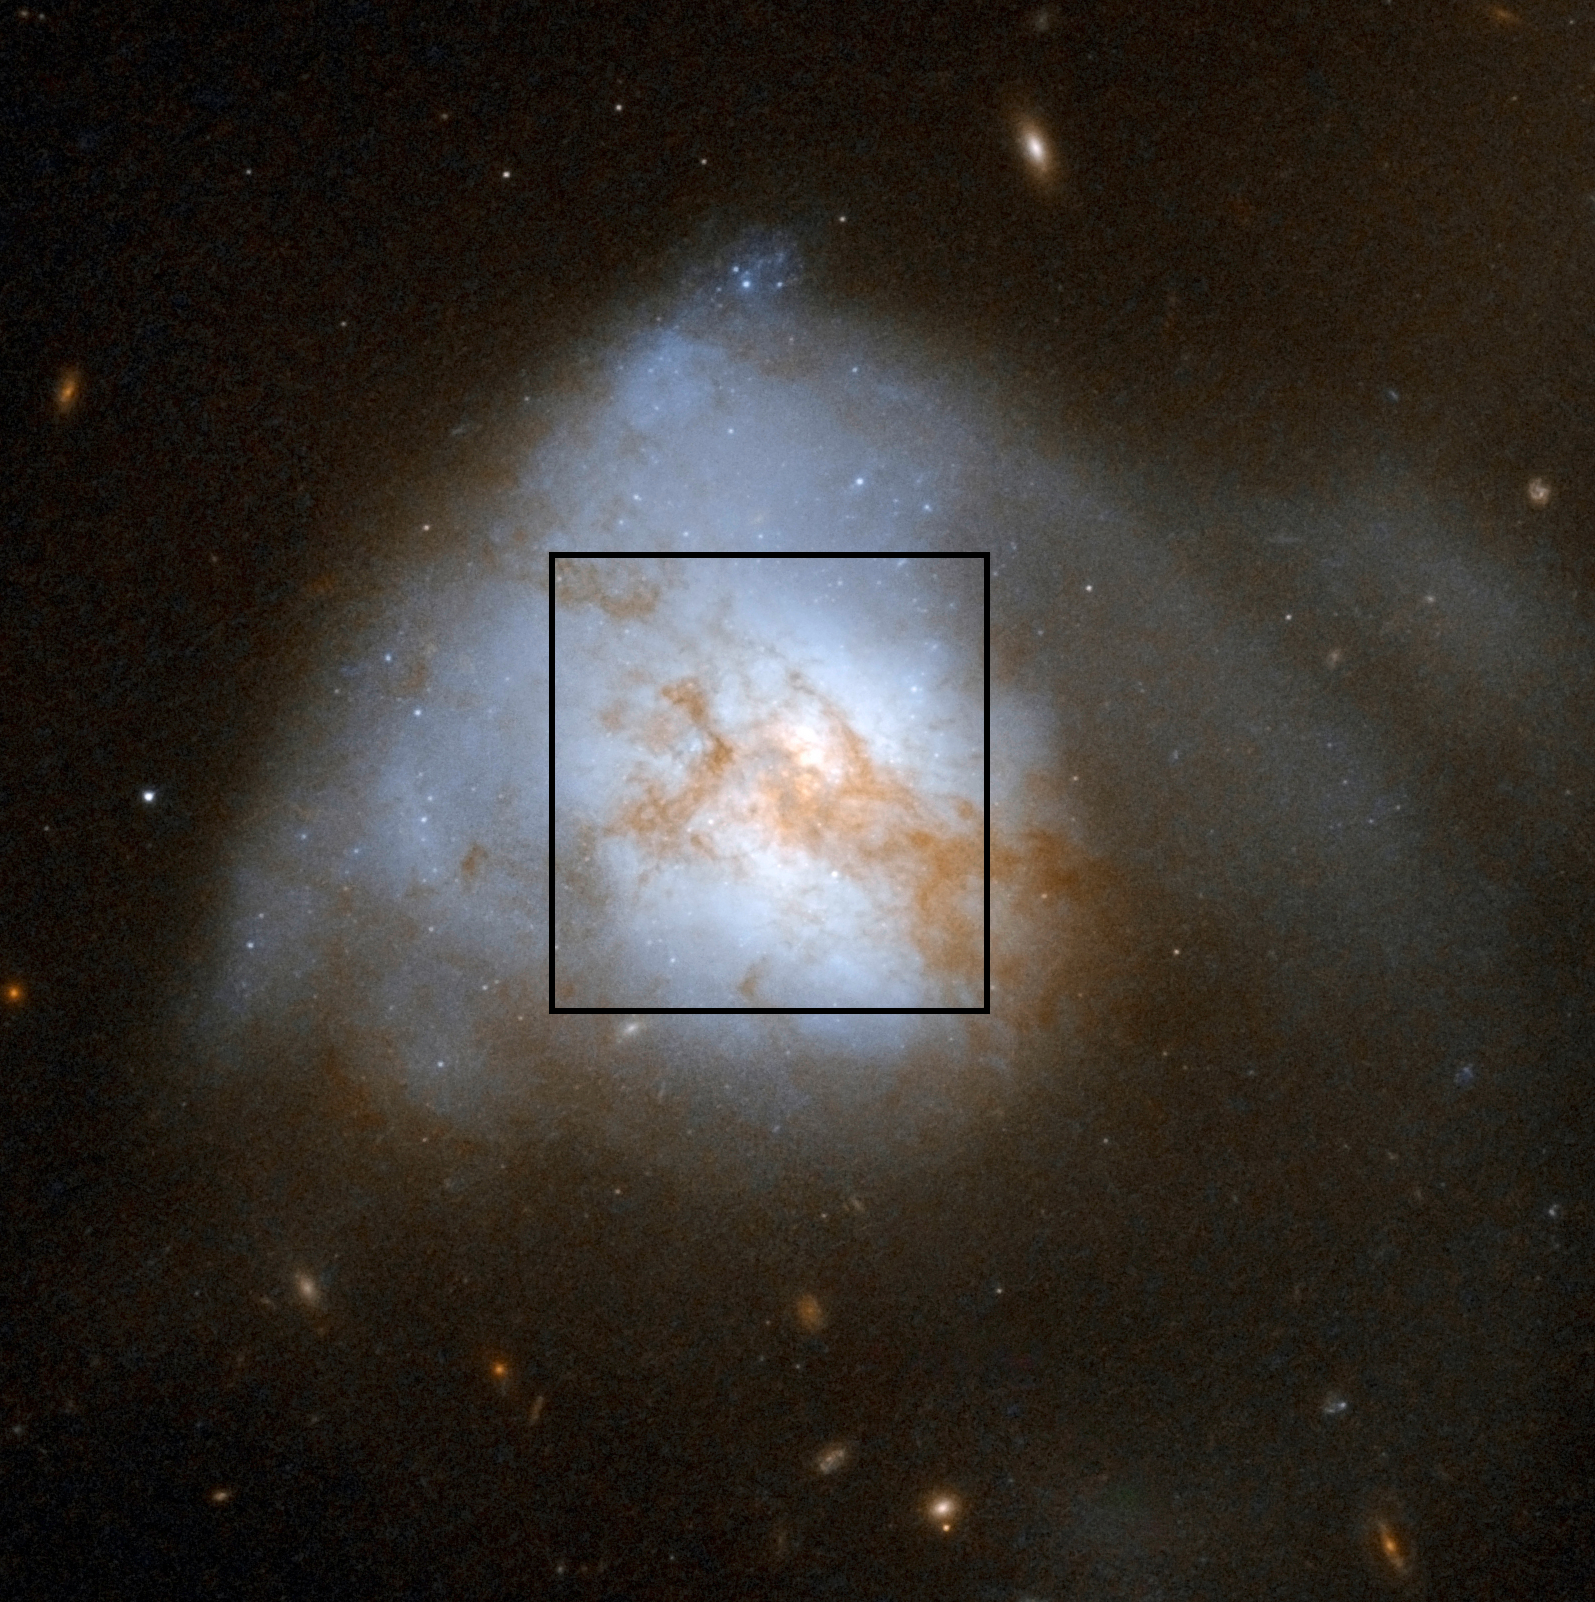
Finally, for comparison with optical data, we include an archival HST image taken on 2006-01-06 with ACS WFC F814W 222Obtained in March 2016 from https://archive.stsci.edu/hst/ as shown in Fig. 8.
3 Results
| Source | Obs. freq | Resolution | RMS | Int. flux |
|---|---|---|---|---|
| [GHz] | [arcsec] | [Jy/b] | [mJy] | |
| Arp 220a𝑎aa𝑎aIntegrated flux density measured by summing all pixels over 3 associated with the Arp 220. | 0.15 | 150 | 39459 | |
| Arp 220a𝑎aa𝑎aIntegrated flux density measured by summing all pixels over 3 associated with the Arp 220. | 1.4 | 60 | 31231 |
| Frequency | East | West | ||
| [GHz] | [mJy arcsec-2] | [mJy arcsec-2] | ||
| 0.15 | 1.4 | |||
| 6.0 | 305±30 | 420±42 | ||
| 32.5 | 111±11 | 141±14 |
In this section we present the results obtained from the data. The 150 MHz LOFAR image of Arp 220 is presented in Fig. 1(a). The 1.4 GHz image obtained by combining archival data from VLA and MERLIN is shown as red contours in Fig. 2(b).
3.1 The integrated flux density at 150 MHz
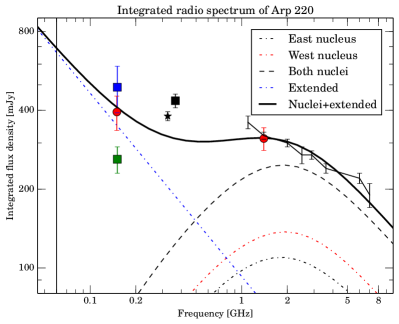
Integrated flux densities measured for Arp 220 in this work are presented in Table 2, and plotted with values from the literature in Fig. 3.
Anantharamaiah et al. (2000) and Clemens et al. (2010) argue that the integrated spectrum of Arp 220 has a sharp turnover below 1 GHz, although Anantharamaiah et al. (2000) find it hard to model this turnover and still fit measurements of recombination lines. However, both these studies base their analysis on the measurement of mJy reported by Sopp & Alexander (1991) at 151 MHz using the Cambridge Low-Frequency Synthesis Telescope (CLFST) with a beam of . This flux density is significantly lower than what we obtain from LOFAR. Sopp & Alexander (1991) state that they used flux densities from the 6C (Hales et al., 1988) or 7C (McGilchrist et al., 1990) catalogues when available, and if not, maps were made from raw CLFST data. Since Arp 220 is not listed in those 6C and 7C catalogues, we assume Sopp & Alexander (1991) made their Arp 220 image themselves. However, in the more recent 7C catalogue (Waldram et al., 1996) we do find a flux density of Arp 220 mJy, in good agreement with our LOFAR result. The uncertainty was calculated by us assuming 20% flux density uncertainty for SNR=8.3 based on Waldram et al. (1996), their Sect. 6. The discrepancy between Sopp & Alexander (1991) and Waldram et al. (1996) is surprising since both are using (presumably exactly the same) CLFST data. Using all data available in the literature, the observations presented in this work argue that the measurement of Sopp & Alexander (1991) is too low and should be regarded with care when included in interpretation or modelling. In this paper, we exclude this data point from our modelling.
3.2 Spectral index maps
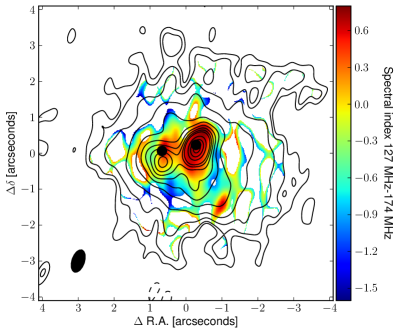
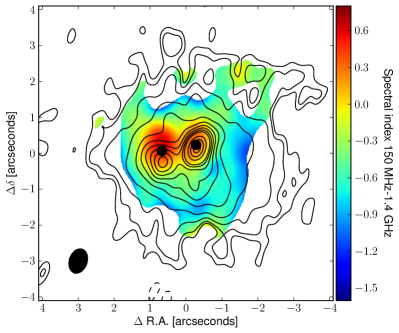
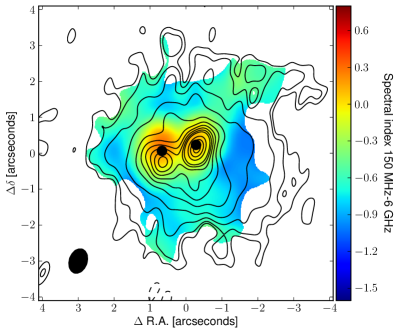
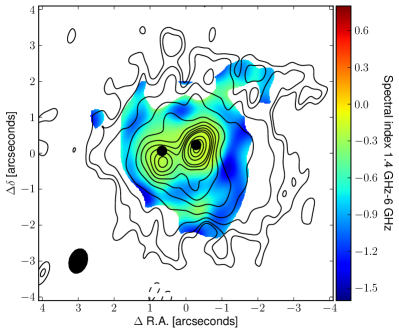
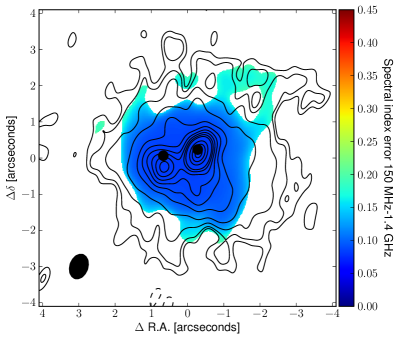
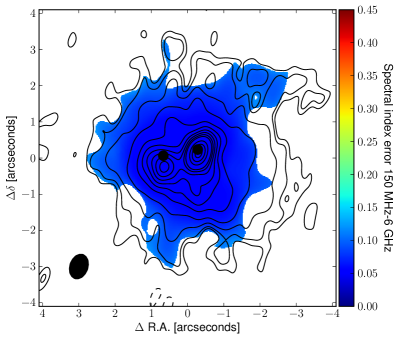
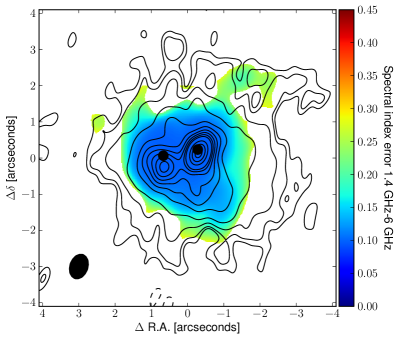
From the continuum images at 150 MHz, 1.4 GHz and 6 GHz, we made four spectral index maps shown in Fig. 4. In general, the nuclei show positive spectral indices while the surrounding extended emission is negative or flat.
The LOFAR in-band spectral index map, Fig. 4(a), was obtained from the MFS-CLEAN algorithm. We note that, as discussed in A.2, the spectral index of LOFAR observations may not be reliable if the flux scale (including spectral index information) is transferred to the target using scans where the difference in elevation is more than 10 degrees between calibrator and target. We emphasise that the flux calibration of these data were carefully done using a time range where the target field and flux calibrator were close in elevation. Hence we are confident that the in-band spectral index map in Fig. 4(a) is reliable.
Figs. 4(b), 4(c) and 4(d) were made after first convolving the respective images to the same resolution of , position angle 161∘, before calculating pixel-wise (with a pixel size of ). i The convolved images had root-mean-square noise levels of Jy beam-1, Jy beam-1, Jy beam-1. The spectral index maps were calculated as .
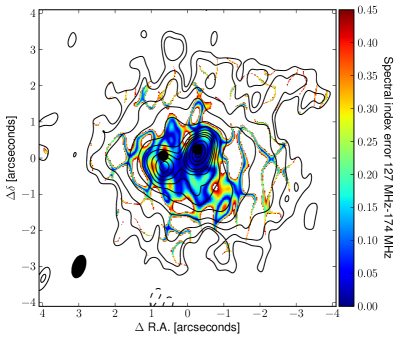
3.2.1 Spectral index error estimates
The LOFAR in-band spectral index image was obtained through the MFS-algorithm, which also produced pixel-wise error-estimates for the spectral index (Fig. 5(a)).
For the other three spectral index maps in Fig. 4, we estimated the uncertainty of the spectral index, accounting for both the image noise and possible systematic offsets in the flux scale, as done by e.g. Kim & Trippe (2014), their Sect. 2.5. We first define the total intensity error (per pixel) as
| (1) |
where RMSν is noise of the convolved images, is the measured surface brightness, and is the absolute flux density uncertainty (i.e. 15% at 150 MHz and 10% at 1.4 GHz and 6 GHz). The (pixel-wise) uncertainty of the spectral index is calculated via standard error propagation as
| (2) |
The resulting three error maps can be seen in Figs. 5(b), 5(c), and 5(d).
3.2.2 Clipping of spectral index maps
In some regions of the images the spectral index uncertainties are large, in particular in the weakest parts where the signal-to-noise ratio is low. To ensure reliable spectral index maps, we therefore conservatively blanked (white colour) Fig. 4 and Fig. 5 where either of the (convolved) input continuum images were weaker than . However, for the LOFAR in-band spectral index we noted significant uncertainties also in regions with brighter emission. We therefore blanked Figs. 4(a) and 5(a) where the uncertainty in the spectral index (Fig. 5(a)) was larger than 0.45. We note that the MFS algorithm with two Taylor terms cannot fully represent any spectral curvature within the LOFAR band which could be present due to free-free absorption of emission close to the nuclei. This could be a reason for the large uncertainties reported by the MFS algorithm in some regions of this image.
3.2.3 Sampling of extended emission
We are confident that we are not missing any significant large-scale emission which could affect our spectral index measurements. Assuming the largest angular scale sampled in the observations can be estimated as radians where is the observing wavelength and is the shortest baseline included in imaging, we estimate the largest scales sampled as , and at 150 MHz, 1.4 GHz and 6 GHz respectively. This is much larger than the extent of Arp 220, which covers at most in any of the images.
3.3 The eastern nucleus
In Fig. 1(a) we measure a peak brightness associated with the eastern nucleus of mJy beam-1 at R.A. , Dec. , i.e. a significant offset of 300 mas (110 pc) south of the position reported for the eastern nucleus at 33 GHz by Barcos-Muñoz et al. (2015). However, in Fig. 4(a), which is made from the same data, we detect a feature of positive spectral index with a peak 100 mas north of the 33 GHz position. A closer look reveals a similar spectral feature in Figs. 4(b) and 4(c). At the GHz position of the eastern nucleus, the low 150 MHz surface brightness and the positive spectral index indicates significant absorption of the emission from the nuclear disk. In fact, the emission measured at 150 MHz at this position may be due to the southern component (eastern 150 MHz peak) blending with the GHz position due to the finite image resolution, and hence our measurements are consistent with the eastern nuclear disk being completely absorbed at 150 MHz.
3.4 The western nucleus
The western nucleus is the brightest component at 150 MHz. In Fig. 1(a) we measure a peak brightness associated with the western nucleus of mJy beam-1 at R.A. , Dec. , i.e. 70 mas (25 pc) south and 40 mas west of the 33 GHz position reported for the western nucleus by Barcos-Muñoz et al. (2015), although the offset is not significant given the astrometric uncertainties of the 150 MHz and 33 GHz data. However, the 150 MHz contours at levels of [40,60,80] in Fig. 1(a), show an extension (330 pc) south of the western nucleus. Indeed, we see a similar extension at 1.4 GHz and 6 GHz (Figs. 2(a) and 2(b)). We also find a north-south elongated feature of positive spectral index in the LOFAR in-band spectral index map (Fig. 4(a)).
3.5 The extended emission
The structure of the extended emission detected with LOFAR at 150 MHz matches very well the structure 1.4 GHz (Fig. 2(a)) and 6 GHz (Fig. 2(b)). At 150 MHz the extended emission accounts for more than 80% of the total flux density of Arp 220.
Although Fig. 4(a) only covers a small area around the nuclei, the extended emission is consistent with having a flat or negative spectral index. The spectral index maps between 150 MHz and 1.4 GHz (Fig. 4(b)), and between 150 MHz and 6 GHz (Fig. 4(d)), show that the extended emission has a spectrum of down to 150 MHz, consistent with optically thin synchrotron emission. Fig. 4(d) shows a similar overall spectral index for the extended emission, although with steeper values towards the edges. This could be evidence of synchrotron ageing, but because of the smaller separation in frequency compared to Figs. 4(b) and 4(d), as well as potentially low signal to noise in the outer regions, we do not include this in our modelling.
4 Modelling
Since we now resolve Arp 220 from 150 MHz to 33 GHz, we can model the spectrum of Arp 220 pixel-by-pixel. From Fig. 1(a) it is clear that at least three components have to be considered: the two nuclei and the extended emission.
4.1 Modelling the nuclei
For the structure of the nuclei we use the models fitted by Barcos-Muñoz et al. (2015) at 33 GHz, where each nucleus is a geometrically thin (but optically thick) inclined exponential disk. The surface brightness of each disk is described as
| (3) |
where is the surface brightness at position (x,y) relative to the centre of the disk (with some P.A.), is the peak brightness, is the inclination angle of the disk, and is a characteristic scale length. Using the deconvolved values reported by Barcos-Muñoz et al. (2015), their Table 2 (East: A=6.0 mJy beam-1, P.A.=54.7∘, =30.3 pc, =57.9∘, West: A=13.4 mJy beam-1, P.A.=79.4∘, =21.0 pc, =53.5∘), we obtain a model with total flux densities of 23.4 mJy and 28.1 mJy at 33 GHz for the east and west nuclei respectively. However, with these values the model systematically underpredicts the measured surface brightness at all frequencies (including 33 GHz) at the 33 GHz positions of the nuclei (after we convolve the model and images to a common lower resolution for a pixel-wise comparison). We therefore scale the model to 26.7 mJy and 31.1 mJy for the east and west nuclei respectively to match the data at 33 GHz. We note that these higher values are within the uncertainties of the measurements of mJy and mJy reported by Barcos-Muñoz et al. (2015), their Table 1.
To model the nuclei, we assume that each pixel follows the model presented by Condon et al. (1991) for radio emission from a star forming galaxy. In this model the emitting medium is a well-mixed thermal/non-thermal plasma, and the radio spectrum is given by the expression
| (4) |
where is the surface brightness in mJy arcsec-2, K is the thermal electron temperature (Anantharamaiah et al., 2000), is the synchrotron radiation spectral index (Condon, 1992), is the fraction of thermal (free-free) emission at 1 GHz, and is the free-free optical depth expressed in terms of a turnover frequency where . Given from the exponential disk model at 32.5 GHz, and assuming values for and for each nuclei, we can calculate (for each pixel) and thereby predict the radio spectrum for the nuclei from Eq. 4.
4.2 Modelling the extended emission
Although it is clear from Fig. 1(a) that the extended emission has structure, we model it simply as an optically thin sphere of uniform density and radius . Projected in two dimensions, the emission at radius is described by . The flux scale is fixed by normalising the sum of all pixels to a chosen total integrated flux density of the sphere. We fix the centre position of the sphere to the peak position of CO(1-0) in Fig. 2(c), taken to be at R.A. , Dec. , and the radius to . Although the extended emission shows a range of spectral indices, from about 0 (closer to the nuclei) to in Fig. 4, the major part should be well described by a typical synchrotron spectral index of (Condon, 1992). To account for free-free absorption in the brightest regions close to the nuclei, we assume a marginally flatter spectral index of for the sphere, in agreement with the overall value reported in Sect. 3.
4.3 Modelling results
By adding the models of the nuclei and extended emission we can now predict the resolved spectrum of Arp 220 at any (radio) frequency. This three-component model is shown in Fig. 6.
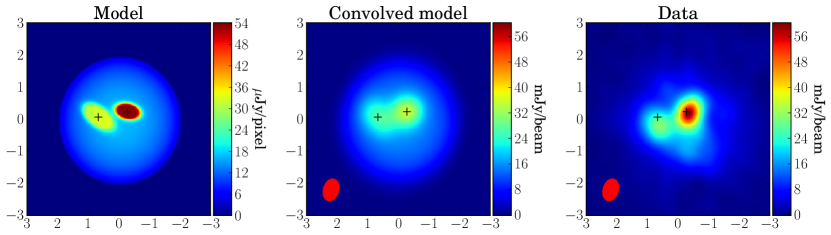
The sphere, described in Sect. 4.2, was modelled with a total flux density of 8.1 mJy at 32.5 GHz and spectral index (i.e. 350 mJy at 150 MHz). The exponential disks, described in Sect. 4.1, were modelled with flux densities of 26.7 mJy (east) and 31.1 mJy (west) at 32.5 GHz, non-thermal spectral indices ( in Eq. 4) of (east) and (west), and thermal fractions at 1 GHz ( in Eq. 4) of 0.8% (east) and 0.4% (west).
To compare the model with measurements at various frequencies, we measure the integrated flux density of Arp 220, as well as the surface brightness at the GHz positions of the two nuclei. The total flux density is measured by summing the pixels in the model at each frequency. This can directly be compared with the measured integrated flux density across the radio spectrum. To measure the surface brightness of the nuclei it is important to take into account the smoothing caused by the finite resolution of the images. Therefore, we convolve the model and data at each frequency to the same resolution of , position angle 161∘, before measuring the brightness of the nuclei. The measured surface brightness values for the nuclei are presented in Table 3 and plotted in Fig. 7. A comparison of the model and the data is shown at 150 MHz in Fig. 6.
4.3.1 The integrated spectrum
We find that our model can reproduce the integrated flux density measured through most of the radio spectrum, see the solid line in Fig. 3. However, we note that the model underpredicts the flux density of the Arp 220 in the range 200 MHz to 1 GHz.
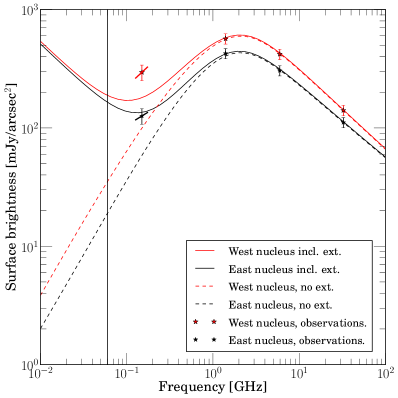
Although the structure of the extended emission is clearly not a perfect sphere, the predicted surface brightness is close to what is observed at 150 MHz.
We note that at very low frequencies the spectrum must flatten, even without thermal absorption, because of e.g. the increased importance of synchrotron self-absorption in regions of very high surface brightness. This could be investigated by international LOFAR observations using the Low Band Array (LBA), which could obtain a matched synthesised resolution at 60 MHz. Such observations are currently very challenging, but commissioning work is ongoing to improve the capabilities.
4.3.2 The nuclei
Turning to the brightness of each nucleus, we find that our model correctly predicts the western nucleus to be brighter at all frequencies, and that both spectra turn over around 1 GHz. Above 1 GHz the spectrum is well described by the two nuclei following Eq. 4. We find that including the extended emission, which in our model is represented by parts of the sphere close to the nuclei, makes the two nuclei significantly brighter at 150 MHz (solid lines in Fig. 7) than without the extended emission (dashed lines in Fig. 7). We also find that the model with extended emission better reproduces the spectral indices measured for the two nuclei within the LOFAR band, shown as thick solid line segments going through the 150 MHz measurements in Fig. 7.
From our modelling in Sect. 4 it is clear that the nuclei can be described by well mixed thermal/non-thermal exponential disks at GHz frequencies. This argues against that the nuclei are clumpy (Lacki, 2013), in agreement with recent ALMA observations presented by Scoville et al. (2015).
However, at 150 MHz, the model underpredicts the observed surface brightness of the western nucleus, even when taking into account the extended emission, predicting 180 mJy arcsec-1 (after convolving to ), i.e. 60% of the observed value. This indicates that there is emission close to this nucleus which is not included in the model. Indeed, outflows are not included in our simple model, and may very well be responsible for the extra emission detected from the western nucleus. This emission may also partly explain why the model underpredicts the integrated flux density in the range 200 MHz to 1 GHz.
5 Discussion
In this section we discuss the results of observations and modelling and compare with literature.
5.1 Low thermal fractions in the nuclei
The thermal fractions at 1 GHz, required to match the data, are only 0.8% and 0.4% for the east and west nuclei respectively. This is an order of magnitude lower than the found by Marvil et al. (2015) for a large sample of galaxies, although Murphy (2013) finds lower thermal fractions for ongoing mergers. We note that our modelling assumes no foreground thermal absorption of the nuclei, although this could also affect the synchrotron emission from the nuclei and therefore the thermal fractions reported here should be considered upper limits. As noted by Barcos-Muñoz et al. (2015) based on the lack of thermal emission at 33 GHz, the easiest explanation for the lower-than-expected thermal flux is that a significant fraction of the ionising photons produced by young stars is absorbed by dust.
5.2 An outflow in the eastern nucleus
CO(2-1) observations of the eastern nucleus suggests it to be a rotating disk seen almost edge on (Sakamoto et al., 2008; König et al., 2012). In Fig. 2(d) we show the structure of CO(2-1) in the nuclei, showing the orientation of the eastern nucleus. The 150 MHz features detected north and south of the eastern nuclear disk (Sect. 3) are consistent with an elongated structure where the northern part is viewed through a free-free absorbing medium, possibly the outer part of the nuclear disk, and the southern part is relatively unaffected by this absorbing medium. The fact that the features are on opposite sides of the centre of the nuclear disk indicates that the emission is associated with the disk.
Sakamoto et al. (2009) presents evidence for outflows in the nuclei with speeds of 100 km s-1 based on P Cygni profiles in HCO+ and CO. We expect that this outflow could carry radio emitting CRs from the nucleus, or accelerate CRs in situ in the outflow due to shocks and turbulence. This would manifest itself as synchrotron emission tracing an elongated or bipolar feature extending outwards from the centre of the disk, similar to what we observe at 150 MHz. We note, however, that Barcos-Muñoz et al. (2015) fit a P.A. of 54.7∘ for the eastern disk, and a perpendicular outflow would then have P.A. = -35.3∘. The elongation we observe implies a P.A., i.e. the 150 MHz feature is not perfectly aligned with the disk.
HST NICMOS images of Arp 220 presented by Scoville et al. (1998) show a north-south extension of the eastern nucleus at 1.6 m and 2.2 m. The nature of this structure is not clear, but Scoville et al. (1998) argue, based on the extinction structure, that the south side is the near side. Similar north-south structure is also seen in the 3.8 m VLT images presented by Gratadour et al. (2005), their Fig. 5.
Another galaxy with a bright star forming disk seen almost edge-on is M82. This galaxy was recently found to have bright radio continuum emission at 150 MHz around its star forming disk (Varenius et al., 2015). Varenius et al. (2015) interpret this as the base of the outflow seen at larger distances from M82. From their figure 3b (made at 154 MHz) it is clear that the emission is brighter on the south-east side of M82, presumably because it is closer and less obscured by free-free absorption in the disk which is partly overlapping the north-west emission. The outflow seen in M82 is brightest about 170 pc (10′′) from the centre of the star forming disk, i.e. similar to the 110 pc (0) offset in the eastern nucleus of Arp 220 between the peaks at 33 GHz and 150 MHz.
Based on the consistency with previous evidence for an outflow in the eastern nucleus, the alignment of the 150 MHz features above and below the disk, and the similarity to the 150 MHz observations of M 82, we interpret the 150 MHz features as evidence for an outflow in the eastern nucleus, with the southern side being the closer (approaching) part.
Multiple studies estimate strong magnetic fields strengths of a few mG for the nuclei in Arp 220 (Lacki & Beck, 2013; Yoast-Hull et al., 2016; Torres, 2004). In a medium with density cm-3 and magnetic field strength 2 mG, we expect a cooling time of about 1000 yrs at GHz frequencies and slightly less at 150 MHz (Lacki & Beck, 2013, their Fig. 1). If we assume wind speed of 1 000 km s-1, i.e. higher than estimated by Sakamoto et al. (2009) and Tunnard et al. (2015) but less than the 10 000 km s-1 reached by SNe (Batejat et al., 2011), the CRs could travel only 1 pc before fading. Even if the wind speed was as high as 5 000 km s-1 the CRs could barely escape the disk (thickness 10 pc; Scoville et al. 2015). The fact that we find emission as far as 100 pc () south of the eastern nucleus means that the emitting CRs were accelerated tens of parsecs outside the nuclei, due to star formation outside the nuclei and/or shock-acceleration of CRs in the outflow. We note that Arp 220 has been recently detected in gamma-rays with Fermi (Griffin et al., 2016; Peng et al., 2016). The measured -ray spectrum presented by Peng et al. (2016) is roughly an order of magnitude larger than the predictions of Yoast-Hull et al. (2015). This supports the conclusion that a significant fraction of the radio emission must come from CRs accelerated outside the nuclei.
It is hard to distinguish between a galactic wind plume driven by star formation and structure due to an AGN hidden in the eastern nucleus. Although the eastern nucleus partially similar to M 82, which is thought to be starburst driven, the non-perpendicular direction of the outflow may be a sign of AGN activity since the M82 outflow is perpendicular to the disk both in radio and NIR images. However, given that Arp 220 is an ongoing merger, this discrepancy may be also explained by the interaction forces of the merging process. More data is needed to determine what is powering the outflow in the eastern nucleus.
5.2.1 An outflow in the western nucleus
The velocity structure in the CS molecule (Scoville et al., 2015) suggests a disk-like rotation for the western nucleus, with a major axis of the disk in the east-west direction. If an outflow carries CRs out perpendicular to the disk, we expect an elongation in the north-south direction, possibly with a shift of the peak of emission at 150 MHz due to the inclination. This is consistent with the results presented in Sect. 3, where we see an elongated feature extending (330 pc) south of the western nucleus at 150 MHz, 1.4 GHz and 6 GHz.
We also find that even though the contribution from extended emission near the western nucleus is significant, the model still underpredicts the brightness of this nucleus by 40% at 150 MHz, see Fig. 7. This indicates that there is emission close to this nucleus which is not included in the model. A part of this emission likely comes from this elongated component.
Although the LOFAR in-band spectral index map (Fig. 4(a)) shows a clear north-south elongated feature extending about (330 pc) from the western nucleus, the spectral index maps from 150 MHz to 1.4 GHz and 6 GHz (Figs. 4(b) and 4(c)) do not show this feature. However, if there are free electrons in this region (or in the foreground, for example in a surrounding star forming disk), free-free absorption could be important not only for the nuclear disk (as evident from the modelling in Sect. 4) but also for the elongated feature. The turnover frequency where free-free absorption becomes important depends on the surface brightness (e.g. Eq. 4). The elongated feature is much weaker than the western nucleus and consequently would have a lower turnover frequency. In fact, the measured surface brightness of 40 Jy beam mJy arcsec-2 at 1.4 GHz would imply a turnover frequency of about 500 MHz (Condon et al., 1991, their Fig 2). This could explain the positive spectral index detected within the LOFAR band, while also being consistent with the flat or negative spectral index in Figs. 4(b) and 4(c), and consequently a very low surface brightness at GHz frequencies.
We interpret the elongated feature detected in the western nucleus as evidence of an outflow, inclined so that the southern part is the approaching part of the outflow, consistent with the model suggested by Tunnard et al. (2015), their Fig. 16. We note that our outflow-extension is ten times larger than the 40 pc reported by Tunnard et al. (2015). This can be explained by shock-acceleration or star formation also outside the western nucleus, as discussed in Sect. 5.2 for the eastern nucleus, as we would not expect CRs accelerated in the western nucleus to keep radiating out to 330 pc. We note that the HST NICMOS images of Arp 220 presented by Scoville et al. (1998) at 1.1 m and 1.6 m also show features north and south of the western nucleus. Similarly to the eastern nucleus, Scoville et al. (1998) argue that the southern side is the closer one, based on the extinction.
5.3 Extended star formation and shocks in the superwind
The fact that we see synchrotron emission as far as 1.5 kpc () from the nuclei in Fig. 1(a) means that the emitting CRs must either be produced this far from the centre, or they must have been advected from regions closer to the nuclei by strong winds, possibly driven by the outflows seen in the nuclei. A combination of the two effects is also possible.
There is ample evidence for molecular gas several kpc from the nuclei in the form of a disk of radius 0.5-1 kpc, inclination and P.A. (Scoville et al., 1997; Downes & Solomon, 1998; Sakamoto et al., 1999; König et al., 2012). This structure match very well the contours of the extended emission in Fig. 1(a).
On arcsecond scales, the extended emission detected at 150 MHz matches well the molecular disk, as seen in CO(1-0) Fig. 2(c), but seem to have little relation to the orientation of the two nuclei. Although outflows from the nuclei may contribute to the extended emission, it is likely that a significant part of it is produced by star formation in the molecular disk itself. While the nuclei are very dense within the central 50 pc ( cm-2; Scoville et al. 2015), the kpc-scale disk is likely less dense and may have weaker magnetic fields (Torres, 2004). If so, we expect CRs accelerated here to be able to travel further than those accelerated in the nuclei, which could explain the smooth structure of the extended emission.
Although CRs may be accelerated in the disk, it is hard to see how they could stay radiating long enough to reach the “hooks” of radio emission in Fig. 1(a) at 1.5 kpc from the centre (which would require a cooling time of yrs assuming a wind speed of 1 000 km s-1). However, we note that these “hooks” appear perpendicular to the kpc-scale disk, and are also roughly aligned with the direction of the outflows from the nuclear disks. We therefore interpret the “hooks” as a sign of a kpc-scale outflow, driven both by the nuclear outflows and by star formation in the extended disk. Indeed, Arp 220 is known to have a large scale bi-conical outflow, or superwind, seen at optical wavelengths and X-rays (Heckman et al., 1990; Arribas et al., 2001; McDowell et al., 2003). For easy comparison with optical data, we show the 150 MHz emisson as contours plotted on archival HST I-band data (described in Sect. 2.3) in Fig. 8.
Although the CRs carried from the nuclei may have lost most of their energy at 1.5 kpc from the centre, the mechanical energy output of the nuclear outflows may still be the driving force of the superwind. Thus, the wind (and the magnetic field) would reach much further out than 1.5 kpc from the centre. Similarly to the nuclear outflows, shocks in this superwind could accelerate CRs to produce emission far out from the centre of the galaxy. We find this a likely explanation of the “hooks” in Fig. 1(a). We note that observations with even higher sensitivity could potentially detect even weaker (and more extended) radio emission. Furthermore, observations with full polarisation calibration could trace the field lines of the outflow similar to the work by Heesen et al. (2011).
We note that both “hooks” appear bent towards the south-west. Such a bending could be due to movement of the galaxy towards the north-east relative to the surrounding medium. We note that the HST-image, Fig. 8, shows a flattening towards the north-east, consistent with such motion.
5.3.1 The rate of star formation in the extended disk
In Fig. 2(c) we show the 150 MHz radio continuum together with the CO(1-0) line emission. Let us assume that the contours of CO(1-0) and contours at 150 MHz trace the same extended star forming medium. Using (Dame et al., 2001) and Eq. 4 of Kennicutt (1998) we can derive a star formation rate per area of 10 Mkpc-2 from CO(1-0). By extrapolating the 150 MHz brightness to 1.4 GHz () and using Eq. 6 of Bell (2003) we derive a value of 2 Mkpc-2. We note that, in addition to all uncertainties involved in applying these equations to the dense and complex environment of Arp 220, we also expect the CO value to be too high because of blending with the nucleus, and the 150 MHz value to be too low because of synchrotron losses in the outer parts of the disk. This is consistent with the difference, and although we refrain from any detailed interpretation of these numbers, we note that they are consistent within an order of magnitude and hence do not argue against star formation in the extended disk.
5.4 Estimating the total star-formation rate
From the flux densities and spectral indices used in the model described in Sect. 4.3, we can extrapolate the radio emission from 32.5 GHz to 1.4 GHz without the influence of thermal absorption. We obtain 206 mJy (east), 281 mJy (west) and 73.2 mJy (sphere), i.e. a total spectral luminosity of . Using Eq. 6 by Bell (2003) we calculate the star formation rate (SFR) as M in good agreement with the 240 M calculated by Farrah et al. (2003) using the far-infrared luminosity. Scaling the SFR by the flux density of each component at 1.4 GHz, we find the three components contributing 81 M (east), 110 M (west) and 29 M (sphere).
5.5 Arp 220 follows the FIR/radio correlation
The mean ratio of far-IR (FIR) emission to radio emission is usually quantified as a logarithmic ratio called the parameter (e.g. Yun et al. 2001, their Eq. 5). Yun et al. (2001) find Arp 220 to have which is larger than the mean of for the IRAS 2 Jy sample containing over 9000 sources, i.e. showing less radio emission than expected for Arp 220.
However, using the 1.4 GHz flux density extrapolated in Sect. 5.4 together with IR measurements from the IRAS point source catalogue v2.1555Obtained via http://irsa.ipac.caltech.edu/Missions/iras.html. of = 104.1 Jy and Jy we obtain (using Eqns. 5 and 6 by Yun et al. 2001) a value of for Arp 220, closer to the average value. This shows the importance of accounting for thermal absorption even at GHz frequencies. The fact that Arp 220 follows the FIR/radio correlation indicates that it is powered by star formation rather than AGN activity. This is consistent with the large number of compact supernovae and supernova remnants found with VLBI observations (see e.g. Batejat et al. 2011).
In addition to star formation and AGN activity, tidal shocks in merging systems may heat the dust and gas enough to produce additional FIR and synchrotron emission, thereby possibly affecting the FIR/radio correlation (Murphy, 2013; Donevski & Prodanović, 2015). Donevski & Prodanović (2015) quantify this effect in terms of the -parameter for different classes of mergers, using the same six-stage merger classification scheme as Haan et al. (2011) based on HST imaging. We note that Arp 220 is hard to classify based on optical imaging due to the extreme dust obscuration of the centre. Haan et al. (2011) and Murphy (2013) classify Arp 220 differently using the same scheme, as class 6 and 5 respectively. Both these classes are describing a post-merger system with a single nucleus. We know, from radio observations that Arp 220 has two nuclei, although the separation of 370 pc is much smaller that the median ULIRG separation of 1.2 kpc found by Haan et al. (2011) and is therefore easily missed in the HST classification scheme. If we re-classify Arp 220 as class 4, a late ongoing merger with double nuclei and a tidal tail, our measured -value is in good agreement with the expected for this class by Donevski & Prodanović (2015). Hence, by this argument, emission from tidal shocks seem to play a minor role in Arp 220.
6 Summary and outlook
Using the international LOFAR telescope we obtain, for the first time, an image of Arp 220 at 150 MHz with subarcsecond resolution. We detect emission associated with the two nuclei known from GHz frequencies, but also extended radio emission reaching 1.5 kpc from the nuclei. The nuclei have positive spectral indices, indicating significant free-free absorption, while the extended emission has an overall spectral index of , typical for optically thin synchrotron radiation. We find that the extended emission accounts for more than 80% of the total flux density measured at 150 MHz.
We report on elongated features in the two nuclei, extending 0.3” (110 pc) from the eastern nuclear disk and (330 pc) from the western nuclear disk, and we interpret these features as evidence for outflows.
The extended radio emission follows the CO(1-0) distribution and is likely coming from star formation in the kpc-scale molecular disk surrounding the two nuclei. Outflows from this disk, as well as from the nuclei, likely drives the superwind seen in optical and X-rays wavelengths.
We find that shock-acceleration of CRs in the outflows, both in the nuclei and in the base of the superwind) is required to explain the extent of the radio emission.
We model the Arp 220 as a three-component model: the nuclei as exponential disks with thermal absorption, surrounded by a uniform sphere of optically thin synchrotron emission. Our model successfully explains the basic shape of the observed integrated spectrum of the galaxy, as well as the spectra of the nuclei, which are well described by a mixed thermal/non-thermal plasma of thermal fractions 0.8% and 0.4% at 1 GHz for the east and west nucleus respectively. These values are an order of magnitude lower than the found by Marvil et al. (2015) for a large sample of galaxies. Still, our thermal fractions for Arp 220 are upper limits because we assume no foreground thermal absorption. The low thermal fractions may be explained by dust absorbing a major part of the ionising photons produced by young stars.
Our model underpredicts the flux density in the range 200 MHz to 1 GHz for Arp 220, even when including extended emission, indicating that the emission from outflows in the nuclei (which are prominent below 1 GHz, but are not considered in our simple model) play an important role in this galaxy.
When including the extended emission and accounting for absorption effects, we find that Arp 220 follows the FIR/radio correlation with , and we estimate a total star formation rate of 220 M.
International LOFAR observations show great promise to detect extended structures such as outflows or radio halos at MHz frequencies, where they are bright due to the synchrotron spectral slope and lack of free-free absorption. Future international LOFAR observations of Arp 220 using the Low Band Array at 60 MHz would be very useful to further disentangle the contributions of the different emitting structures in Arp 220.
Dutch-LOFAR observations will in the future be used to detect and study star forming galaxies. Our results show that for LIRGs the emission detected at 150 MHz does not necessarily come from the main regions of star formation. This implies that unresolved observations of such galaxies at 150 MHz is unlikely to be useful for deriving star formation rates. Future studies of LIRGs at MHz frequencies would therefore benefit from using international LOFAR baselines to resolve the star forming structure.
Acknowledgements.
E.V. acknowledges support from the Royal Swedish Academy of Sciences. A.A. and M.A.P.T. acknowledge support from the Spanish MINECO through grants AYA2012-38491-C02-02 and AYA2015-63939-C2-1-P, partially funded by FEDER funds. LOFAR, the Low Frequency Array designed and constructed by ASTRON, has facilities in several countries, that are owned by various parties (each with their own funding sources), and that are collectively operated by the International LOFAR Telescope (ILT) foundation under a joint scientific policy. We note the valuable assistance provided by the LOFAR Science Support during this work. The research leading to these results has received funding from the European Commission Seventh Framework Programme (FP/2007-2013) under grant agreement No 283393 (RadioNet3). e-MERLIN is the UK’s National Radio Interferometric facility, operated by the University of Manchester on behalf of the Science and Technology Facilities Council (STFC). Using data from the Karl G. Jansky Very Large Array (VLA), we acknowledge that the National Radio Astronomy Observatory is a facility of the National Science Foundation operated under cooperative agreement by Associated Universities, Inc. This research has made use of the NASA/IPAC Extragalactic Database (NED) which is operated by the Jet Propulsion Laboratory, California Institute of Technology, under contract with the National Aeronautics and Space Administration. One image presented in this paper was obtained from the Mikulski Archive for Space Telescopes (MAST). STScI is operated by the Association of Universities for Research in Astronomy, Inc., under NASA contract NAS5-26555. Support for MAST for non-HST data is provided by the NASA Office of Space Science via grant NNX09AF08G and by other grants and contracts.References
- Anantharamaiah et al. (2000) Anantharamaiah, K. R., Viallefond, F., Mohan, N. R., Goss, W. M., & Zhao, J. H. 2000, ApJ, 537, 613
- Arp (1966) Arp, H. 1966, ApJS, 14, 1
- Arribas et al. (2001) Arribas, S., Colina, L., & Clements, D. 2001, ApJ, 560, 160
- Barcos-Muñoz et al. (2015) Barcos-Muñoz, L., Leroy, A. K., Evans, A. S., et al. 2015, The Astrophysical Journal, 799, 10
- Batejat et al. (2011) Batejat, F., Conway, J. E., Hurley, R., et al. 2011, ApJ, 740, 95
- Bell (2003) Bell, E. F. 2003, ApJ, 586, 794
- Briggs (1995) Briggs, D. S. 1995, PhD thesis, The New Mexico Institute of Mining and Technology
- Clemens et al. (2010) Clemens, M. S., Scaife, A., Vega, O., & Bressan, A. 2010, MNRAS, 405, 887
- Condon (1992) Condon, J. J. 1992, ARAA, 30, 575
- Condon et al. (1991) Condon, J. J., Huang, Z.-P., Yin, Q. F., & Thuan, T. X. 1991, ApJ, 378, 65
- Dame et al. (2001) Dame, T. M., Hartmann, D., & Thaddeus, P. 2001, ApJ, 547, 792
- Donevski & Prodanović (2015) Donevski, D. & Prodanović, T. 2015, MNRAS, 453, 638
- Douglas et al. (1996) Douglas, J. N., Bash, F. N., Bozyan, F. A., Torrence, G. W., & Wolfe, C. 1996, AJ, 111, 1945
- Downes & Solomon (1998) Downes, D. & Solomon, P. M. 1998, ApJ, 507, 615
- Farrah et al. (2003) Farrah, D., Afonso, J., Efstathiou, A., et al. 2003, MNRAS, 343, 585
- Gratadour et al. (2005) Gratadour, D., Mugnier, L. M., & Rouan, D. 2005, A&A, 443, 357
- Greisen (2003) Greisen, E. W. 2003, Information Handling in Astronomy - Historical Vistas, 285, 109
- Griffin et al. (2016) Griffin, R. D., Dai, X., & Thompson, T. A. 2016, ArXiv e-prints
- Haan et al. (2011) Haan, S., Surace, J. A., Armus, L., et al. 2011, AJ, 141, 100
- Hales et al. (1988) Hales, S. E. G., Baldwin, J. E., & Warner, P. J. 1988, MNRAS, 234, 919
- Heckman et al. (1990) Heckman, T. M., Armus, L., & Miley, G. K. 1990, ApJS, 74, 833
- Heesen et al. (2011) Heesen, V., Beck, R., Krause, M., & Dettmar, R.-J. 2011, A&A, 535, A79
- Kennicutt (1998) Kennicutt, Jr., R. C. 1998, ApJ, 498, 541
- Kettenis et al. (2006) Kettenis, M., van Langevelde, H. J., Reynolds, C., & Cotton, B. 2006, in Astronomical Society of the Pacific Conference Series, Vol. 351, Astronomical Data Analysis Software and Systems XV, ed. C. Gabriel, C. Arviset, D. Ponz, & S. Enrique, 497
- Kim & Trippe (2014) Kim, J.-Y. & Trippe, S. 2014, Journal of Korean Astronomical Society, 47, 195
- König et al. (2012) König, S., García-Marín, M., Eckart, A., Downes, D., & Scharwächter, J. 2012, The Astrophysical Journal, 754, 58
- Lacki (2013) Lacki, B. C. 2013, MNRAS, 431, 3003
- Lacki & Beck (2013) Lacki, B. C. & Beck, R. 2013, Monthly Notices of the Royal Astronomical Society, 430, 3171
- Lockhart et al. (2015) Lockhart, K. E., Kewley, L. J., Lu, J. R., et al. 2015, The Astrophysical Journal, 810, 149
- Lonsdale et al. (2006) Lonsdale, C. J., Diamond, P. J., Thrall, H., Smith, H. E., & Lonsdale, C. J. 2006, ApJ, 647, 185
- Marvil et al. (2015) Marvil, J., Owen, F., & Eilek, J. 2015, AJ, 149, 32
- McDowell et al. (2003) McDowell, J. C., Clements, D. L., Lamb, S. A., et al. 2003, ApJ, 591, 154
- McGilchrist et al. (1990) McGilchrist, M. M., Baldwin, J. E., Riley, J. M., et al. 1990, MNRAS, 246, 110
- McMullin et al. (2007) McMullin, J. P., Waters, B., Schiebel, D., Young, W., & Golap, K. 2007, in Astronomical Society of the Pacific Conference Series, Vol. 376, Astronomical Data Analysis Software and Systems XVI, ed. R. A. Shaw, F. Hill, & D. J. Bell, 127
- Moldón et al. (2015) Moldón, J., Deller, A. T., Wucknitz, O., et al. 2015, A&A, 574, A73
- Moldón et al. (2014) Moldón, J., Deller, A. T., Wucknitz, O., et al. 2014, ArXiv e-print 1411.2743
- Mundell et al. (2001) Mundell, C. G., Ferruit, P., & Pedlar, A. 2001, ApJ, 560, 168
- Murphy (2013) Murphy, E. J. 2013, ApJ, 777, 58
- Norris (1988) Norris, R. P. 1988, MNRAS, 230, 345
- Offringa et al. (2012) Offringa, A. R., van de Gronde, J. J., & Roerdink, J. B. T. M. 2012, A&A, 539, A95
- Parra et al. (2007) Parra, R., Conway, J. E., Diamond, P. J., et al. 2007, ApJ, 659, 314
- Peng et al. (2016) Peng, F.-K., Wang, X.-Y., Liu, R.-Y., Tang, Q.-W., & Wang, J.-F. 2016, ArXiv e-prints
- Sakamoto et al. (2009) Sakamoto, K., Aalto, S., Wilner, D. J., et al. 2009, ApJ, 700, L104
- Sakamoto et al. (1999) Sakamoto, K., Scoville, N. Z., Yun, M. S., et al. 1999, ApJ, 514, 68
- Sakamoto et al. (2008) Sakamoto, K., Wang, J., Wiedner, M. C., et al. 2008, ApJ, 684, 957
- Scaife & Heald (2012) Scaife, A. M. M. & Heald, G. H. 2012, MNRAS, 423, L30
- Scoville et al. (2015) Scoville, N., Sheth, K., Walter, F., et al. 2015, The Astrophysical Journal, 800, 70
- Scoville et al. (1998) Scoville, N. Z., Evans, A. S., Dinshaw, N., et al. 1998, ApJ, 492, L107
- Scoville et al. (1997) Scoville, N. Z., Yun, M. S., & Bryant, P. M. 1997, ApJ, 484, 702
- Smith et al. (1998) Smith, H. E., Lonsdale, C. J., Lonsdale, C. J., & Diamond, P. J. 1998, ApJ, 493, L17
- Sopp & Alexander (1991) Sopp, H. M. & Alexander, P. 1991, MNRAS, 251, 112
- Torres (2004) Torres, D. F. 2004, ApJ, 617, 966
- Tunnard et al. (2015) Tunnard, R., Greve, T. R., Garcia-Burillo, S., et al. 2015, The Astrophysical Journal, 800, 25
- Varenius et al. (2015) Varenius, E., Conway, J. E., Martí-Vidal, I., et al. 2015, A&A, 574, A114
- Waldram et al. (1996) Waldram, E. M., Yates, J. A., Riley, J. M., & Warner, P. J. 1996, MNRAS, 282, 779
- Williams & Bower (2010) Williams, P. K. G. & Bower, G. C. 2010, The Astrophysical Journal, 710, 1462
- Wilson et al. (2014) Wilson, C. D., Rangwala, N., Glenn, J., et al. 2014, The Astrophysical Journal Letters, 789, L36
- Yoast-Hull et al. (2015) Yoast-Hull, T. M., Gallagher, J. S., & Zweibel, E. G. 2015, MNRAS, 453, 222
- Yoast-Hull et al. (2016) Yoast-Hull, T. M., Gallagher, J. S., & Zweibel, E. G. 2016, Monthly Notices of the Royal Astronomical Society: Letters, 457, L29
- Yun et al. (2001) Yun, M. S., Reddy, N. A., & Condon, J. J. 2001, ApJ, 554, 803
Appendix A Calibration of LOFAR data
The observations, calibration and imaging of the LOFAR data were carried out based on experience from earlier work on M82 (Varenius et al. 2015). These data on Arp 220 were observed in project LC2_042 (P.I.: E. Varenius) between 18:30 and 02:15 UT on June 4th 2014 with six hours on Arp 220. The observations included 46 LOFAR high band array (HBA) stations: 24 core stations (CS) in joined mode (where the two 24-tile “ears” of the station are added to form a single station), 14 remote stations (RS), and eight international stations (IS).
The total available bandwidth was split equally in two simultaneous beams of width 48 MHz (240 sub-bands), centred on 150 MHz; one on Arp 220 and one on the bright and compact calibrator J1513+2388 separated from Arp 220 by . Every 20 minutes the observations switched, for 2 minutes, to a single beam on the absolute flux density calibrator 3C295, separated from Arp 220 by 32∘. Although in theory a single scan of 3C295 is sufficient to determine the flux scale, we included scans every 20 minutes for two main reasons. Firstly: in case the primary delay calibrator would have been very weak, we could have used the scans of 3C295 to track the relative phase of the CS to coherently combine the CS visibilities into a larger super-station with enough sensitivity to international stations to derive delay solutions towards a weak calibrator. However, J1513+2388 was strong enough to derive delay and rate solutions without phasing up the core. Secondly: the current LOFAR beam model is not accurate enough to correctly transfer the flux scale (and spectral index) over large (typically more than 10 degrees) elevation differences. Tracking both J1513+2388 (close to the target) and 3C295 (further away) through a wide range of relative elevation angles made it possible to measure the gain differences as a function of elevation separation during the observation. This enables us to choose a good time range for flux calibration, i.e. when 3C295 is close in elevation to J1513+2338, as well as estimate the flux error due to residual beam effects. After careful investigations, we are confident that our flux scale and LOFAR in-band spectral index are correct within the uncertainties given in this paper.
The correlated data were stored in the LOFAR long term archive with visibility sample resolution 2 seconds in time and 48.8 kHz in frequency (i.e. 4 channels per LOFAR HBA sub-band). This resolution defines a field of view due to coherence loss on long baselines (smearing). We estimate the coherence loss due to smearing for a 1000 km baseline to be at most 45% for sources at distance from the phase centre.
All measurement sets were processed with the LOFAR default pre-processing pipeline (DPPP) to edit bad data using AOflagger (Offringa et al. 2012), and were corrected for the array and element beam response. For processing speed, the data were then further averaged to a sample resolution of 10 seconds and 195 kHz. For clarity we note that we did not use the mscorpol model as done by Varenius et al. (2015) to correct for the LOFAR beam since mscorpol does not include a frequency dependence. For the wide bandwidth in this observation, we considered the LOFAR beam model more appropriate, although preliminary investigations show these two models to have similar accuracy. The data were then converted to circular polarisation using the table query language (TAQL), and to UVFITS format using CASA.
Similar to Varenius et al. (2015), residual delays and rates were corrected for
all non-core stations by using baselines longer than 60 k for
J1513+2338, where the total bandwidth was divided in eight groups (AIPS IFs) of
5.9 MHz each for a piece-wise linear approximation of the dispersive delay to
be valid. The task FRING was used with a solution interval of 2 minutes.
Typical delay values were tens of ns for RS and 100-300 ns for IS,
with typical differences of about 15% between the lower and upper IFs.
The corrections were applied to all sources, thereby removing major residual errors due to the ionosphere. The data could now be further averaged in time and frequency, and for processing speed we averaged to a sample resolution of 30 seconds and 1.2 MHz. After averaging, the visibility weights were re-calculated to reflect the scatter within 5 minute solution intervals.
A.1 Excluded stations
The Swedish LOFAR station in Onsala, SE607, and the core station CS501 were excluded from calibration and imaging. Losing CS501 has only a very minor impact on sensitivity. However, losing SE607 means significantly lower resolution in north-south direction in the final synthesised image. Although derived delay and rate corrections towards J1513+2338 looked reasonable for SE607, we found a systematic reduction in visibility amplitudes on parts of the bandwidth to this station, where the upper and lower halves of the bandwidth had significant gain differences. Despite significant efforts to understand this discrepancy, we found obvious amplitude errors in the final image when including SE607. We therefore decided to exclude this station, despite the loss in resolution. More advanced calibration methods may be able to include the data from SE607, hence gaining resolution in north-south direction. This would be valuable to investigate the outflows in the nuclei of Arp 220.
A.2 Flux calibration
Amplitude corrections were derived for each antenna, one correction per spectral window every minute, assuming J1513+2338 to be a point source of 1.55 Jy at the lower end of the band, with spectral index , consistent with total flux density measurements available via NED666http://ned.ipac.caltech.edu/. To reduce the effect of interfering sources in the field, only baselines longer than 60 k were used to derive amplitude corrections. Multiple rounds of self-calibration were used to take into account any structure present in the amplitude calibrator, although we found this source to be point-like at this resolution. The amplitude corrections were median window filtered and smoothed to correct obvious outliers using a filter width of 2 hours, before applying the corrections to all sources.
A band pass calibration was done to correct for curvature within each 6 MHz spectral window using J1513+2338 with , baselines longer than 60 k, and a solution interval of 60 minutes.
The absolute amplitude scale, and the in-band spectral index, was checked by transferring all corrections to 3C295 and, after a phase-self calibration assuming a point source model for the shortest baselines 0.1-15 k, one image was produced for each AIPS IF using these baselines. The recovered CLEAN model flux density for each IF was found to be within a few percent of the model by Scaife & Heald (2012).
For imaging of 3C295 we used data from the last 3.5 hours of observing, when 3C295 and Arp 220 are separated by 10∘ in elevation. Based on the flux density variations of J1513+2338 during the observation we conclude that inaccuracies in the current LOFAR beam model may introduce systematic flux density errors of 10% between sources separated by 10∘ in elevation. We therefore adopt a flux density uncertainty of 15% to account for beam model errors as well as errors when measuring the flux of 3C295.
A.3 Phase calibration
Because of the large () separation between J1513+2388 and Arp 220, the residual phase errors differ substantially. After phase referencing to J1513+2388 no peak could be found in the Arp 220 image, and hence phase self-calibration was necessary. Self-calibration without a prior knowledge of the peak position will align the data arbitrarily in R.A. and Dec., and therefore the image has to be aligned by comparing positions of some alignment sources, as described later in Sect. A.8.
Arp 220 was phase self-calibrated (in AIPS) using a point source as starting model. We found Arp 220 to be too weak for calibration using only international baselines, mainly due to the limited sensitivity of the CS. We decided to include shorter baselines, longer than 4 k, in the self-calibration process, i.e. including also CS-RS (but no CS-CS) baselines. A solution interval of 1 minute was used and corrections were found for all AIPS IFs separately to correct residual phase errors between the IFs, although the image used in each self-calibration step was made from all IFs together. We note that the phase corrections derived for all IFs were very similar.
We performed multiple rounds of hybrid mapping until the process converged to a stable result. We note, however, that self-calibration including short LOFAR baselines may cause the calibration process to violate the constraints defined by the closure phases on baselines between international stations, since these stations have no short baselines and the NL-stations are all relatively close. We plotted the final CLEAN model against the self-calibrated data and found that the model was in good agreement with the data also on baselines between international stations. This means the self-calibration procedure is constrained by closure phases on all baselines and the results are robust.
We also made the additional test of starting the process of hybrid mapping using a MERLIN-only 1.4 GHz image as initial model, i.e. a double source instead of a point. From this we also recovered the same final structure, i.e. the final result does not depend on the initial model used for self-calibration.
The derived phase corrections were applied to Arp 220 and to the three alignment sources listed in Tab. 1. With residual phase-variations corrected, the data could be further averaged to a sample resolution of 120 seconds in time for processing speed. Given this, we estimate our field of view around Arp 220 to be limited to within a radius of 10′′ (10% coherence loss on a 1000 km baseline).
A.4 Imaging and sensitivity
An image of Arp 220 were obtained using the multi-scale (MS) multi-frequency-synthesis (MFS) CLEAN algorithm as implemented in CASA using 2 Taylor terms, and baselines longer than 2 k. The scales used were: a point, and two Gaussians of FWHM 1′′ and 4′′. The final RMS noise level was 0.15 mJy beam-1 with a CLEAN restoring beam of . We also obtained an in-band spectral index map as constructed by the MFS-algorithm.
To check the thermal noise we obtained an image of Arp 220 in Stokes V. This image contained only noise with RMS 0.14 mJy beam-1, suggesting that the stokes I image, with very similar sensitivity, is limited random noise and not by residual phase errors or interfering sources in the field. The achieved sensitivity can be compared to the 0.15 mJy beam-1 achieved by Varenius et al. (2015) for M82 at 154 MHz, using 16 hours of data with 16 MHz bandwidth. Scaling the M82 noise to 6 hours and 48 MHz bandwidth, we expect 0.14 mJy beam-1, in excellent agreement with the observed value.
A.5 A plan for alignment of the LOFAR data
To maximise the sensitivity on Arp 220, the available bandwidth was split between only two beams, i.e. no separate beam on a nearby phase calibrator as done by Varenius et al. (2015). Instead, we aimed to align the final LOFAR image with observations with similar resolution at higher frequencies, e.g. MERLIN at 1.4 GHz. However, the morphology seen with LOFAR was different from MERLIN (especially the eastern nucleus), making manual alignment using Arp 220 itself very challenging.
However, we detect multiple background sources within the smearing radius defined by the time and frequency resolution of the LOFAR data. Unfortunately there is not yet a catalogue available with positions accurate enough at LOFAR frequencies to align the data. Instead, we sought compact background sources in the field which were seen both in the archival 1.4 GHz VLA data, described in Sect. 2.2.1, and in the LOFAR data. Although single sources may have frequency-dependent positions, the use of multiple sources provides a robust way of aligning the LOFAR data to the astrometric reference frame of the VLA observations.
We note that in the future it may be easier to find close, bright and compact calibrators for phase referencing at 150 MHz by using the upcoming LOBOS catalogue (Moldón et al. 2015).
| Source | R. A. [J2000] | Dec. [J2000] |
|---|---|---|
| 1534+2326 a𝑎aa𝑎a Note that the brightness measurements at 150 MHz may include emission not only from the nuclear disks, but may also blend with emission from outflows and the surrounding kpc-scale disk. | ||
| 1534+2347 a𝑎aa𝑎aPosition obtained from archival VLA data at 1.4 GHz, see Sect. A.8 for uncertainties. | ||
| 1535+2333 a𝑎aa𝑎aPosition obtained from archival VLA data at 1.4 GHz, see Sect. A.8 for uncertainties. |
A.6 Finding alignment sources in the VLA data
To find sources suitable for alignment of the 150 MHz image, we first imaged the VLA data described in Sect. 2.2.1 using the multi-scale CLEAN algorithm as implemented in CASA 4.5.2, and obtained a model image of Arp 220 with resolution and RMS noise 50 Jy beam-1. Given the time and frequency resolution of these data we estimate coherence losses of 20% on the longest (36 km) VLA baselines at a distance of from the phase centre. Smearing is hence a greater limitation than the primary beam of about for a VLA antenna at 1.4 GHz, when imaging sources far away from the phase centre.
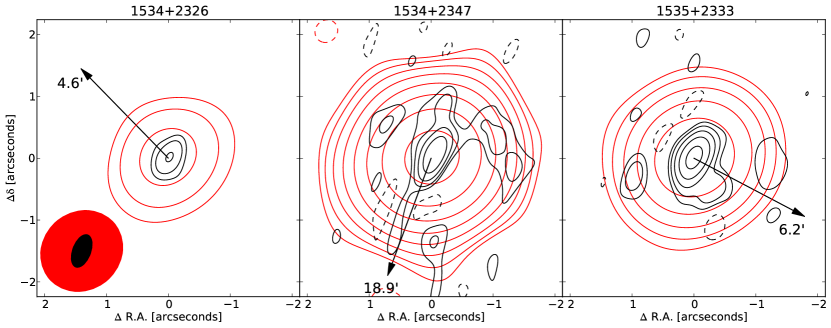
The CLEAN model for Arp 220 was then UV-subtracted from the data to enable cleaning of faint nearby sources and a big image was made to identify compact sources. Three sources were selected as potential alignment sources and images were obtained for each of them. By fitting Gaussian intensity distributions to the alignment sources we obtained the positions and flux densities at 1.4 GHz, see Tables 4 and 5. The fitting uncertainties reported by CASA were 15 mas, 2 mas and 3 mas respectively for the sources 1534+2326, 1534+2347 and 1535+2333 at 1.4 GHz.
A.7 Aligning the LOFAR data
For minimal time and bandwidth smearing of the three alignment sources in the LOFAR data, we phase-shifted the Arp 220 data with resolution (2s and 48.8 kHz) to the positions of the three sources before applying the same cumulative phase and amplitude corrections as applied to Arp 220, i.e. including the corrections derived during the self-calibration procedure described in Sect. A.3. Unfortunately, the brightest source, 1534+2347, we found to be too severely affected by smearing to be used for positional alignment, but we include position (Table 4) and flux density (5) of this source for future reference as this may be a good reference for future observations of Arp 220.
| Source | Obs. freq | Resolution | RMS | Int. flux |
|---|---|---|---|---|
| [GHz] | [arcsec] | [mJy/b] | [mJy] | |
| 1534+2326 | 0.15 | 0.14 | 3.7 | |
| 1534+2326 | 1.4 | 0.04 | 1.4 | |
| 1534+2347 a𝑎aa𝑎aPossibly reduced due to smearing | 0.15 | 0.18 | 13.7 | |
| 1534+2347 | 1.4 | 0.06 | 43.6 | |
| 1535+2333 | 0.15 | 0.17 | 20.7 | |
| 1534+2333 | 1.4 | 0.05 | 7.7 |
The remaining two sources, 1534+2326 and 1535+2333 were fitted with a two dimensional Gaussian intensity distribution to obtain positions at 150 MHz, and CASA reported fitting uncertainties of 13 mas and 6 mas respectively. A common shift was derived to minimise the difference of both positions relative to the VLA positions, and after shifting the difference between the positions were less than 5 mas in R.A. and 2 mas in Dec. between 1.4 GHz and 150 MHz.
A.8 Positional accuracy
The absolute positional accuracy of our LOFAR images depends both on the relative accuracy of the alignment to 1.4 GHz, and on the absolute accuracy of the 1.4 GHz positions.
As a conservative estimate on the relative accuracy, we add the error margins involved in the alignment described above for one single source, although having two sources should make this error smaller. The fitting accuracy is mas at 1.4 GHz and mas at 150 MHz. Adding the final alignment difference of mas gives a relative uncertainty of mas in each coordinate.
The uncertainty of the absolute reference position of the 1.4 GHz data depends on the uncertainty of the phase-referencing to the calibrator J1513+2338. Inspection of the phase corrections derived for J1513+2338 during calibration of the 1.4 GHz VLA data suggests the phases are slowly varying and we estimate errors in the temporal interpolation between target and calibrator to be negligible. Although the VLBI-position in Table 1 in theory may be accurate to less than 1 mas, there may still be larger sources of uncertainty due to the spatial extrapolation of the phase solutions during the VLA observations, as well as effects of structure in the calibrator source.
From inspection of the phase solutions, the phase on J1513+2338 changes on average 0.4∘ per degree elevation. For a median VLA A-array baseline of 12 km we estimate a positional uncertainty due to linear spatial extrapolation over a target/calibrator separation of 4.5∘ of 20 mas. We note that the calibrator and target are above 60 degrees elevation for most of the experiment, a region where the tropospheric mapping function ( cosec(el)) is essentially flat, and hence a linear extrapolation is a conservative estimate of the uncertainty due to spatial extrapolation.
From the FITS images available via http://astrogeo.org/calib/search/html, we find that although J1513+2338 is core-dominated at the available frequencies of 2.3 GHz and 4.8 GHz, it has a jet extending 60 mas south and 30 mas west from the core. Because of the core-shift effect, the calibrator position at 1.4 GHz may be shifted along the jet direction with respect to the catalogue position from higher frequencies. To estimate the magnitude of this shift we measure the relative flux densities of the core and the jet at 2.3 GHz and 4.8 GHz from the FITS images. The core flux is measured by fitting a Gaussian intensity distribution. The jet flux is measured by summing the pixels brighter than 3 and subtracting the core flux. We find that the jet contributes 15% of the total flux density at 4.8 GHz and 16% at 2.3 GHz. However, this is likely a lower limit because the jet may have significant flux density in extended emission with surface brightness below 3. Furthermore, the core may suffer significant free-free absorption at 1.4 GHz, while the extended emission would have a steeper spectrum and hence be more important at 1.4 GHz. Indeed, spectral index of this source is found to be positive at 150 MHz, see Sect. A.2, consistent with significant absorption of the core. Finally, the core and jet may be time variable. To account for these effects, we assume an upper limit of the core/jet flux density ratio of 50% at 1.4 GHz. If all the jet flux is at the tip of the jet, this implies a conservative positional uncertainty of 15 mas in R.A. and 30 mas in Dec.
Adding all the above uncertainties, we estimate our 150 MHz positions for Arp 220 to be accurate within 68 mas in R.A. and 83 mas in Dec.