Database-Backed Web Applications in the Wild:
How Well Do They Work?
Abstract
Most modern database-backed web applications are built upon Object Relational Mapping (ORM) frameworks. While ORM frameworks ease application development by abstracting persistent data as objects, such convenience often comes with a performance cost. In this paper, we present CADO, a tool that analyzes the application logic and its interaction with databases using the Ruby on Rails ORM framework. CADO includes a static program analyzer, a profiler and a synthetic data generator to extract and understand application’s performance characteristics. We used CADO to analyze the performance problems of 27 real-world open-source Rails applications, covering domains such as online forums, e-commerce, project management, blogs, etc. Based on the results, we uncovered a number of issues that lead to sub-optimal application performance, ranging from issuing queries, how result sets are used, and physical design. We suggest possible remedies for each issue, and highlight new research opportunities that arise from them.
1 Introduction
Object-relational mapping (ORM) frameworks are widely used to construct applications that interact with database management systems (DBMSs). Despite the many implementations of such frameworks (e.g., Ruby on Rails [22], Django [8], Entity Framework [10], Hibernate [12]), the design principles and goals remain the same: rather than embedding SQL queries into application code, ORM frameworks present persistently stored data as heap objects and let developers manipulate persistent data in a similar way as regular heap objects via ORM APIs [9, 1]. These API calls are translated by the ORM frameworks into queries and sent to the DBMSs. By raising the level of abstraction, this approach allows developers to implement their entire application using a single programming language, thereby greatly enhancing code readability and maintainability.
However, the increase in programming productivity comes at a cost. By hiding DBMS details behind an API, ORM frameworks lack accesses to high-level semantic information of the application, such as how persistent data is used. In addition, abstracting queries into API calls prevents application compilers from optimizing these calls and related computation, as compilers treat these API calls as unknown external functions that cannot be altered and conduct arbitrary modifications to related objects

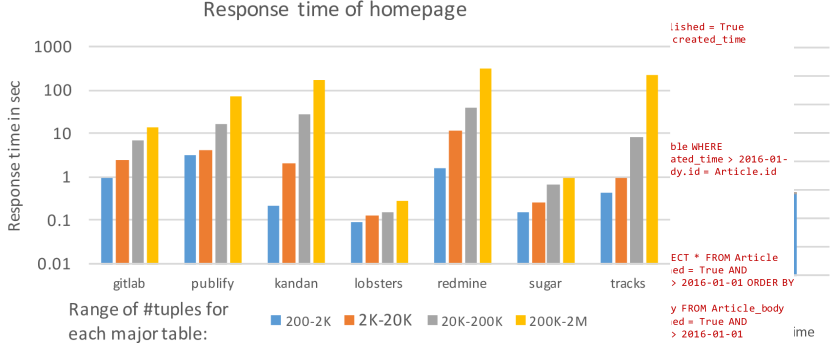
Both aspects make applications built atop ORM frameworks vulnerable to performance problems. Figure 1 shows that for many applications, the response time for some applications becomes intolerable (more than 10 sec) when the number of records is beyond 200K. As application performance is often of critical concern for many ORM applications and the data processed by applications is growing, the performance problems make these applications hard to handle nowadays big-data challenges.
Some problems are well-known in the data management [23], software engineering research communities [32, 33], and developer communities as well [16]. Lacking automatic tools to solve these problems, developers often need to “hand-tune” their ORM-based applications, for instance, implement caches for persistent data [4, 5] or customize physical design for each application [15, 13]. Doing so greatly complicates the application and undermines the original purpose of using ORM frameworks.
Addressing performance issues associated with ORM-based applications requires an understanding of how such applications are built and used, which in turn requires examining the application, the ORM framework, and the DBMS in tandem. While there has been prior work in optimizing ORM-based applications [32, 31, 33], they focus on specific performance issues, and evaluated on a small range of applications. It is unclear how widely spread are such issues are among real-world ORM-based applications, or whether other issues exist. Various tools for detecting and measuring application performance target either the application or the DBMS, and we are unaware of any that examines both.
In this paper, we describe CADO, a new tool that analyzes ORM-based applications by examining the application, the ORM framework, and the DBMS that the ORM framework interacts with. CADO currently works on ORM-based applications that are built using the Ruby on Rails (Rails) framework, due to its popularity among developers. CADO has two components:
-
1.
A static code analyzer that not only performs traditional program analysis but also builds a new data structure Action Flow Graph (AFG), which captures the control flow, data flow and interactions among DBMS, application server and user.
-
2.
A dynamic profiler that executes the application and collects runtime information such as the state of the database and execution time.
-
3.
A data generator based on users’ interactions with the application to populate database.
We use CADO to perform, to the best of our knowledge, the first comprehensive study of ORM-based applications “in the wild”. Specifically, we collect 27 real-world applications that are built using Rails and study them with CADO. We purposefully chose applications based on their popularity and domain. The results show that many performance issues still remain: many queries retrieve much redundant data; query results are unnecessarily returned to the application; many queries repetitively run the same computation; many queries return large number of records which make later data processing slow; much effort is spent on translating relational data to other data structures, etc. For each observation, we point out the direction for optimizations and show potential performance improvement by examples.
In summary, this paper makes the following contributions:
-
•
We built CADO, a tool for analyzing applications built with Ruby on Rails ORM framework. CADO studies applications using static analysis and generates action flow graphs, which describe the flow of persistent data and user interactive data among web browser, application server, and database systems. It also performs dynamic analysis and profiles applications using synthetically generated data.
-
•
We used CADO to perform the first comprehensive study of 27 real-world applications covering a wide variety of domains including forums, social networking, e-commerce, etc. Our results show that many applications expose similar patterns, in aspects including issuing queries, how query results are used, scalability with database size, caching and prefetching, and physical design. Most of our findings have not been studied or only partially studied by previous work.
-
•
Based on our observations, we propose possible solutions to the performance problems and optimizations, which reveals many new research opportunities.
In the following we review the design of ORM frameworks and how they are used to construct database-backed applications in Section 2. In Section 4, we describe CADO and our study. Then in Section 5, Section 6, Section 7, Section 8 and Section 9, we present the findings from our study and suggest optimizations.
2 backgroud
In this section we give an overview of Ruby on Rails (we refer to as “Rails” below), the architecture of applications built using Rails, and how Rails implements object relational mapping.

2.1 Design of Rails applications
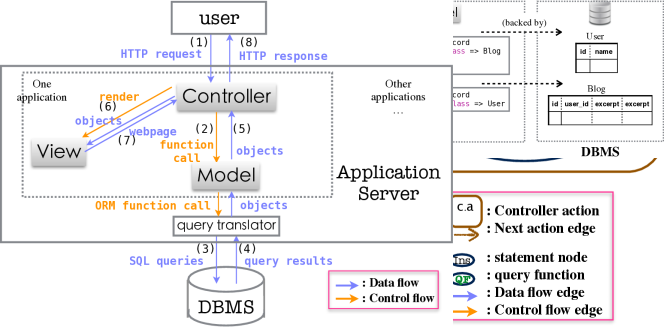
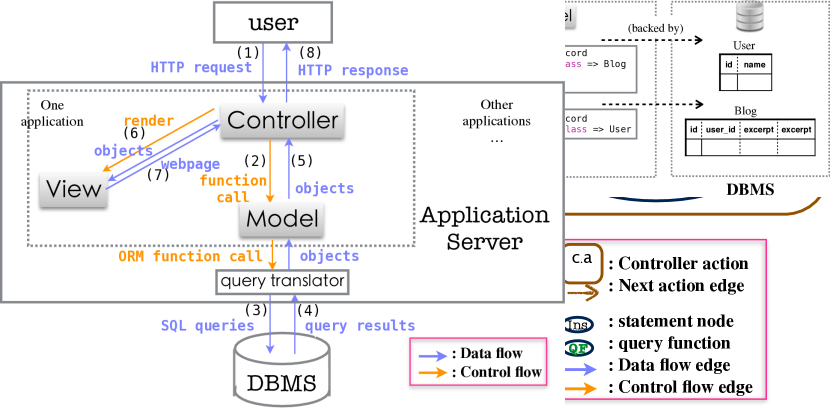
We chose Rails applications as representatives of database applications, given the popularity of the Rails framework and the number of open-source and commercial applications (e.g., Airbnb, Shopify, Hulu, etc) that are constructed using it. Figure 2 shows the typical structure of a typical application built with Rails, with the application hosted on the Rails application server that communicates with the DBMS as needed when it executes. This two-tier architecture is common across applications that are constructed using other ORM frameworks, such as Hibernate [12], EntityFramework [10], and Django [8].
Internally, a Rails application is organized into model, view, and controller components. Upon receiving a user’s request, say to render a web page, (step 1 in Figure 2), the Rails server invoke the corresponding action that resides in the appropriate application controller based on the routing rules provided by the application (shown in Figure 3). During its execution, the controller interacts with the DBMS by invoking Rails-provided ORM functions (2), which Rails translates into SQL queries (3). Upon receiving query results (4), data is serialized into model objects and that are returned to the controller (5). The retrieved objects are then passed to the view (6), which constructs the webpage (7) that is returned to the user in response (8).
As an illustration, Figure 3 shows the code of a blogging application. While the controller and model are written in Ruby, the view code is implemented using a mix of ruby and mark-up languages such as HTML or Haml. There are two actions defined in the controller: index and show. Those actions call the ORM functions User.where, User.some_blogs, and Blog.where that are translated to SQL queries for data retrieval. The action Blog.index passes the blogs retrieved from the DBMS to render to construct the webpage defined by the view file blog_index.erb, where the excerpts (b.excerpt) of all blogs and their contents (b.content) are rendered as part of the generated webpage. For each blog, a url link to the page showing that blog (link_to) is also listed on the webpage. Clicking on the link will bring the user to a separate page, with another action (Blog.show) triggered.
2.2 Object relational mapping in Rails
Like many other ORM frameworks, Rails by default maps each model class directly derived from ActiveRecord [1] into a single table. As shown in Figure 3, User objects are stored in the User table in the DBMS, and likewise for Blog objects. Programmers have the option of specifying which subset of fields in a model class should be physically stored in the corresponding database table, and defining relationships among model classes via association, such as belongs_to, has_one and has_many [19]. For example, in Figure 3, each Blog object belongs_to one User, hence Rails stores the unique user_id associated with each Blog.
3 Architecture of CADO
In this section, we describe the architecture of CADO and the application corpus that was chosen for our study. As mentioned, CADO consists of a static analyzer, an application profiler and a data generator. . In the following, we describe how each component works.
3.1 Program analyzer
The static code analyzer in CADO takes in Rails application source code, examines its interaction with the DBMS, and generates an Action Flow Graph (AFG) for each application. AFGs are inspired by Program Dependence Graphs (PDG) [36] that capture control and data flow in general-purpose programs. In addition, AFGs contain next action edges between pairs of controller actions , meaning that can be invoked from as a result of user interactions (e.g., by clicking on a link on the view generated from action ).
To construct AFGs, CADO first builds the PDG for each controller action. CADO relies on JRuby [3] to construct control-flow graph, and uses classical algorithms [26] to infer data flow. To perform inter-procedural analysis so that all functions called by an action are considered, CADO recursively inlines all function calls.111CADO currently assumes all recursive calls terminate with call depth 1. In order to correctly inline, CADO performs type inference as Ruby is dynamically typed [27]. To ensure all the code triggered by an actions are all inlined including the code in view CADO finds out the view file to be rendered for each render call in controller [21]. Since view files are usually written in Haml or a mix language of ruby and HTML, CADO converts non-ruby languages like Haml into ruby and drop out HTML before inline. CADO also inlines filter functions that are automatically run before an action, and validations that are auto-run before executing any function that modifies database.
CADO then build edges to connect different actions. To do so, CADO identifies functions that generate URL links (e.g., link_to in Figure 3), or generate a form in the output webpage, and determine what action is triggered by each of these links and forms by applying the application routing rules (e.g., those listed in Figure 3). Users can go to the next page or submit form to trigger next action, so we construct a next action edge between the action generating the URL/form, and the next action.
3.2 Application profiler
CADO comes with a profiler that runs the application on a Rails server and instantiates a crawler as the client to profile the application. The crawler starts by visiting the homepage of the application, and randomly chooses a link to visit next. If the visited webpage contains a form, CADO fills in the form with random data in order to proceed to the next page. CADO currently only profiles each application using a single client crawler. Meanwhile, CADO profiles the application running on the Rails server by recording the running time of each controller action as the crawler visits each of the pages. It also records the queries issued by the application to the DBMS, the time spent on each query, and the results returned by each query.
3.3 Data generator
CADO comes with a data generator for users to generate synthetic data and populate the DBMS that the given Rails application interacts with. To generate data, CADO visits webpages served by the application, and fills out forms embedded in the served pages with random data. To ensure that data is populated appropriately, we manually examine the constraints of each field in the embedded forms, for instance ensuring that only strings of the form ’xxxx-xx-xx’ are generated when populating the ‘date’ field of a form, since the application code parses such strings and saves them as datetime to the database. We tailor the data generator to fill the data of correct format for such fields, and consider performing such checks automatically to be future work.
3.4 Limitations
CADO currently has three limitations. First, CADO’s static analyzer only performs path insensitive analysis, meaning that it considers both sides of a branch to be taken. CADO also considers each loop to be executed once. Second, CADO currently does not model user behavior. As a result, the static analysis performed by CADO might not reflect the frequency of actions, and the generated data might not be representative of actual data when the application is deployed, even though all generated data is guaranteed to satisfy the constraints imposed by the application. In addition, CADO performs only a limited form of inter-action analysis. In particular, CADO currently does not perform multi-user and multi-session analysis.
4 Study parameters
| App | Loc | App | Loc | App | Loc | App | Loc | App | Loc | App | Loc | App | Loc |
| forum | social networking | collaboration | task management | resource sharing | e-Commerce | blogging | |||||||
| forem | 5957 | kandan | 1694 | redmine | 27589 | kanban | 2027 | boxroom | 2614 | piggybak | 2325 | enki | 5275 |
| lobsters | 7127 | onebody | 32467 | rucksack | 8388 | fulcrum | 4663 | brevidy | 13672 | shoppe | 5904 | publify | 16269 |
| linuxfr | 11231 | commEng | 34486 | railscollab | 12743 | tracks | 23129 | wallgig | 11189 | amahi | 8412 | ||
| sugar | 11738 | diaspora | 47474 | jobsworth | 15419 | calagator | 1328 | sharetribe | 67169 | ||||
| gitlab | 145351 | ||||||||||||
We conducted a large scale case study of 27 open-source Rails applications. Applications were selected from github based on their popularity (80% of them have more than 200 stars), number of contributors (88% of them have more than 10 contributors), number of commits, and category. The applications, their categories, and lines of code are shown in Table 1. Overall, they cover a broad range of characteristics in terms of DBMS usage: transaction-heavy (e.g., e-commerce), mostly read-only (e.g., social networking), write-intensive (e.g., blogging, forum), and data that can be horizontally partitioned based on users (e.g., blogging, task management), or heavily-shared among users (e.g., forum, collaboration). We believe that these represent all major categories of ORM-based applications. For findings presented in following sections, we take the average of all actions for each application (shown in figures), and then average across all applications (statistic in findings), unless specified separately.
We deployed 7 of the above Rails application server on AWS with 4 CPUs, each with 16GB of memory, and run client crawlers on PC when doing profiling.
5 Improving Query Execution
In this section, we report on our findings from using CADO to analyze the applications described in Section 4. We categorize our findings into four aspects:
-
•
Many queries share subexpressions as other queries. Caching and reuse intermediate result on the server can potentially reduce query execution time for subsequently overlapping queries.
-
•
In many cases, the result of queries are only used to issue subsequent queries. Combining such queries can reduce the amount of data to be transferred from the DBMS to the server.
-
•
Much of the query results are not used in the application. Rewriting queries to return only the data needed can substantially improve application performance.
-
•
Many database columns are computed from constant values. Program analysis can figure out the domain of such columns
5.1 Queries sharing subexpression
Motivation. Some queries share common subexpressions, which cause repetitive computation. To improve performance, such queries can be rewritten such that previously retrieved results are cached and reused. An example is shown in Listing 1. First, the issues variable is created on Line 2. After that, the any? function call on Line 3 issues a COUNT query. Then the issues are later rendered with their status information (Line 4), issuing a JOIN query. The JOIN query (Q2 in Figure 5) shares selection and and the first join predicates with the COUNT query (Q1 in Figure 5).
When executed separately, queries Q1 and Q2 take 6.45 seconds to finish. We simulated the effect of caching intermediate results by creating a view to store the results from a manually-written query with shared predicates (Q3 in Figure 5), and changed the queries (as shown in Q4 and Q5) to use view v. When using the cached results, the total query execution time is reduced to 2.84 seconds (i.e., a 44% reduction).
CADO Analysis. Since in Rails all queries are generated by ORM from object-oriented language, we are able to analyze the program, instead of query log, to find out the shared query predicate. We used CADO to identify the ORM functions that are called to construct queries, and manually collected statistics regarding how frequent queries overlap. For instance, object issues calls the Rails standard function any?, which is translated to a COUNT query. If the object satisfies the following conditions: i) returned by query functions that store subexpressions (e.g., Issue.include.where.group_by), and ii) calls another query function (e.g., issues.includes that translates to a JOIN query), then we count all the queries issued by that object (both issues.any? on Line 2 and issues.includes on Line 4) as "query sharing subexpressions". The average number of such queries in one action is shown in Figure 6.
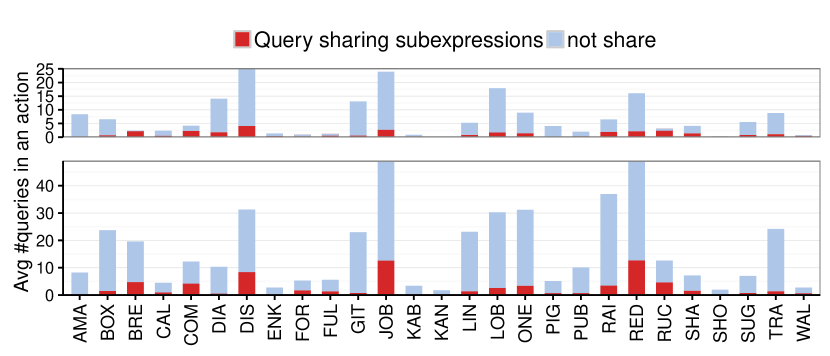
Findings & Implications. From the application corpus, we observe that 16.9% of the queries issued by the applications share subexpressions with other queries. By manually checking these queries, we find that many of these queries are performance critical ones and are usually more complex than other queries. Analyzing query logs or the code statically using similar analysis as discussed above can identify queries such as that shown on Line 2 in Listing 1. Separate views or tables can then be created such that subsequent queries can leverage them to reduce query execution time (e.g., Q3 in Figure 6). However, care must be taken to ensure that the cached results are updated or invalidated appropriately. While this is dependent on user behavior that CADO currently does not model, but from our manual code inspection we believe that the cached data will be useful as many queries with shared subexpressions happen within the same user controller action (i.e., the same transaction).
Prior work. Identifying shared subexpressions in the context of multi-query optimization has been explored [37, 41]. Most prior work target analytical queries as they have complex structures and are likely to have many common subexpressions. However, detecting subexpression is difficult using query logs due to mixing of queries from different clients and is costly as well. [38] presents an approach to combine queries with shared computations to improve system throughput, but at the cost of slowing down individual queries.
We propose an alternative way to detect common subexpressions by statically analyzing the application code. Compared with analyzing query logs, this approach substantially reduces the effort in detection. We also show that this optimization opportunity is common in ORM applications , and techniques introduced in prior work on query caching [41] can be applied.
5.2 Unnecessary transfer of query results
Motivation. Transferring large query results from the DBMS to the application server can cause significant performance degradation. Using CADO, we observe that there is a significant number of queries whose results are only used as parameters for subsequent queries and nowhere else. As such, if such queries can be combined or grouped together as a stored procedure, one way to reduce such data transfer and improve application performance when the query result returned is only used as parameters to some subsequent queries is to group them into a stored procedure or combine them as a single query to avoid transferring unnecessary results from the DBMS.
Listing 2 shows such an example. Query on Line 1 in the original implementation returns all members from group 1, the result of which (m) is only used for query on Line 2. These two queries can be sent to the database as a stored procedure, or combined into a single query as shown in Listing 3. We tested the performance gain of query combining. When Q1 returns 20K records (340KB) and network delay is 100ms, Q1 and Q2 takes 1.46sec and 1.3sec (2.76sec total) respectively. When using stored procedure in which the same Q1 and Q2 are executed, it takes 2.12sec in total, reducing 23.5%; when issuing a join query, the query takes 1.02sec, reducing 62.3%.
CADO Analysis We target at queries whose results are only used to issue other queries so that their results do not need to return to the application, and we use static analysis to find out such queries. To know how query result is used, we trace the dataflow from each query node until we reach either a node with a query function, or a node having no outgoing dataflow edge. We refer to such nodes as the read query sinks. We subsequently categorize sinks into the following: (1) query parameters in subsequent queries; (2) rendered in the view; (3) used in a branch conditions; and (4) assigned to global variables. After analyzing the sinks, we count the number of such queries whose result is only used for other queries (category (1)) across all actions, and the result is shown in Figure 7.
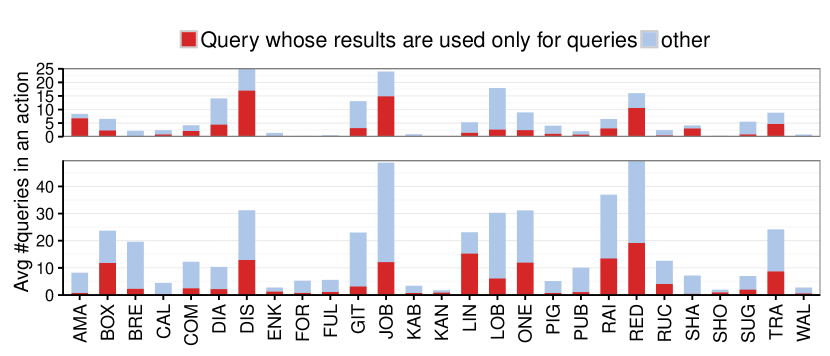
Findings & Implications. We have observed that 35.4% of queries return results that are only used to issue other queries.
The above finding indicates that one can use static program analysis, similar to that performed by CADO, to automatically identify queries that can be cominbed. The compiler can use such information to automatically create stored procedures and avoid unnecessary data transfers. Similar approaches have been explored earlier in prior work [pyxis]. A query optimizer can also leverage such information to combine multiple queries into a single one to further reduce query execution time.
5.3 Unnecessary column retrieval
Motivation. Using CADO, we find that many queries issued by the applications retrieve columns that are not used in subsequent computation. Clearly, automatically identifying and avoiding unnecessary column retrieval can reduce both query execution time and amount of data transferred.
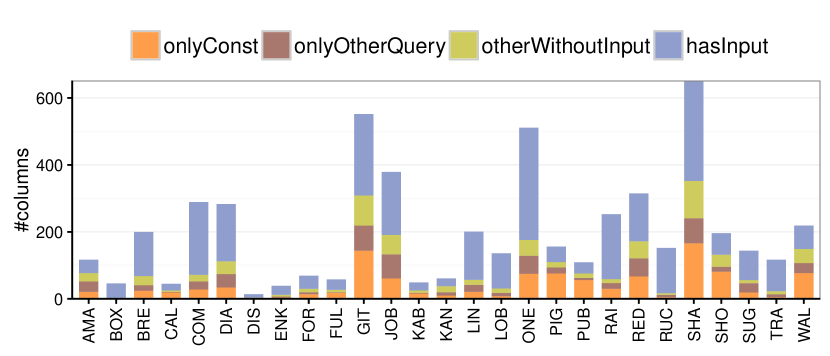
CADO Analysis. CADO uses static analysis to identify the columns retrieved by each query, and then identifies the columns that are used within the function where they are retrieved. The number of unused columns is shown in Figure 8. Next, we calculate the amount of unused column data. To do so, we estimate columns with unbounded types (e.g., “varchar”) using 2450 bytes,222[7] and [6] show that the most popular length of a blog is around 2450 words and the length of a comment is around 200 words. and we count the actual size stored in the database for other column types (e.g., 4 bytes for “int”). The results are shown in Figure 9.
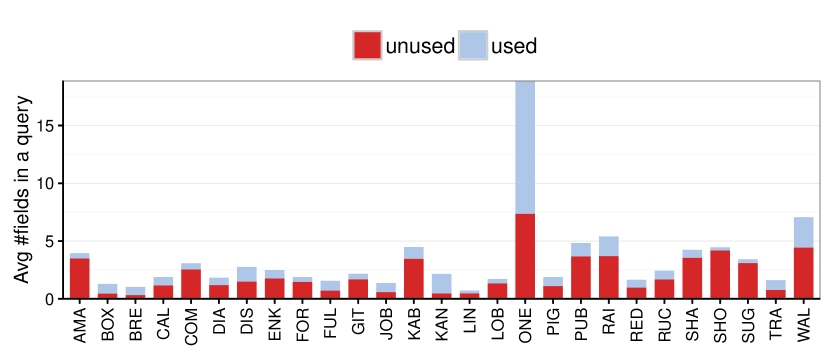
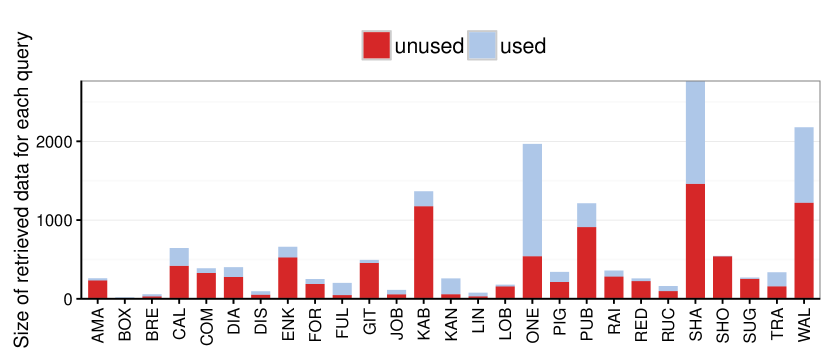
Findings & Implications. We observed that more than 63.4% columns retrieved in applications are unused, and these columns accounts for 62.7% of all retrieved data as measured in bytes.
This finding indicates that we can use static program analysis to automatically identify unnecessary column retrievals. After identifying such columns, a code-transformation tool can automatically change the code so that only used columns are retrieved. Since many ORM frameworks (including Rails) provide APIs to project certain columns instead of all of them, such changes can be made entirely at application program level.
Previous work. Prior work has studied the unnecessary column retrieval problem [32] but has not had an effective way to automatically identify them, which CADO is capable of. In particular, it identifies such columns through a combination of static analysis and dynamic profiling: static analysis analyzes ORM programs to identify all the used columns and dynamic profiling collects query logs to identify which columns are retrieved. However, as shown by CADO, using static analysis is already sufficient for detecting both retrieved and used columns. A future work is to extend CADO to not only automatically identify but also eliminate unnecessary column retrievals through code transformation.
5.4 Unnecessary loading of object fields
Motivation. Most ORMs store object fields that are nested in another object by normalizing the nested fields into individual tables. Join queries are used to re-create the parent object. Similar to the previous section, we have also used CADO to identify unnecessary loading of object fields that are not used in subsequent computation.
The source of such unnecessary loading is often due to the design of the ORM API. For instance, all nested object fields are loaded lazily in Rails unless the user invokes the includes function. However, since lazy loading might cause the “N+1” problem [16], Rails encourages developers to use functions like includes to specify which objects should be loaded eagerly if such information can be determined. An example is shown in Listing 4 where, when a todo object is loaded, a query shown in Listing 5 is issued to eagerly load all associated projects, tags, and predecessor objects. Among the other objects that are eagerly loaded with the todo object, only the predecessor object is used in subsequent code as shown on Line 7, leaving the data retrieved from other tables unused.
CADO Analysis. We quanitifed the number of unnecessary object loading using CADO. First, we identified the ORM functions that explicitly issue JOIN queries (e.g., includes), and analyzed how many joins are involved in the query (three joins in Listing 4). Then we traced the dataflow graph to identify whether the joined fields are used (e.g., todos.predecessors as shown in Listing 5), and counted the number of useful join if the associated data is used (e.g., the join in Listing 4). The results are shown in Figure 10.
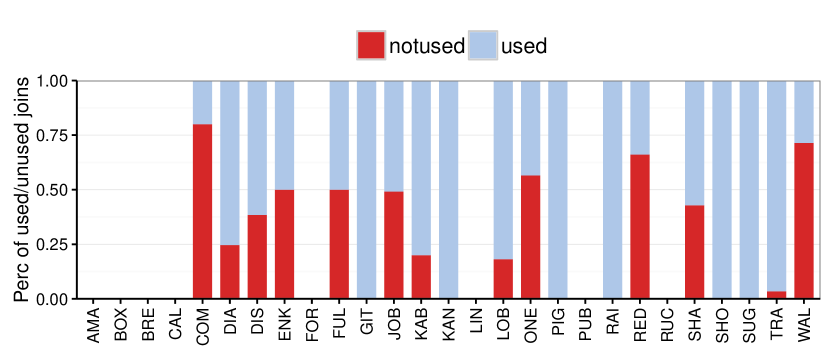
Findings & Implications. Overall, we found 32.2% of the eager joins loading data that is not used subsequently in the program. We believe static program analysis similar to ours can be used to automatically identify whether nested objects should be loaded or not, and eliminate such unnecessary loads. Since many ORMs that support lazy loading by default provide API function to specify objects to be eager-loaded, static analysis can help determine which such calls should be used to eagerly load the nested objects.
Previous work. Prior work [33] has observed similar problem in ORMs that use eager loading by default (e.g., Hibernate [12]), but not in those where lazy loading is the default (e.g., Rails). Rather than setting eager or lazy as the default for all classes, a better design is to specify eager or lazy loading for each object retrieval, and we show that this can be done automatically.
5.5 Determining the domains of columns
Motivation. Selectivity estimation is important for query optimization, but also challenging to accomplish. For example, Postgresql conducts selectivity estimation based on per-column histograms implemented by developers, which introduces extra programming burden. MySQL does not conduct selectivity estimation when no index is created on a column, and determines its query plan based on the table size, which could be sub-optimal. MySQL provides an easy-to-implement options to turn on statistic collection by turning on “AUTO_CREATE_STATISTICS”, but doing so MySQL will calculate statistics for all columns, which gives a lot of burdens to database.
By analyzing the applications, we discover that for many columns, developers only store constant strings or numbers in them, and those columns are used frequently in queries. Using program analysis can determine the domain of such columns, and the values in the domain are usually small. These columns may worth creating histogram to collect statistics since the overhead of maintaining histogram is trivial.
Before explaining the exact program analysis algorithm and our detailed finding, we first look at an example of how developers store constants into columns. In Listing 6, the state of todos can only have one of the three values "deferred", "complete", "active" instead of being any random string. Similarly for the state columns in projects table and contexts table, where projcts and contexts can only have three states, and the domain of the state columns includes limited values. Maintaining histogram for those columns incur trivial overhead since only three bins are needed for the histogram. Knowing the statistics from histogram will enable the database to make better query plans for queries like Listing 7.
CADO Analysis. We analyze the data source for each assignment of class fields that are stored in table columns. To do so, we examine each node with such assignment in the AFG in each controller action, and trace backwards along dataflow edges till we find a node with query function, or a node with no incoming dataflow edge. We refer to those as the source nodes and categorize them as follows: (1) user inputs, (2) read query functions, (3) constant values, (4) utility function calls (for example, Time.now),and (5) global variables. In this section, we count the number of columns whose data sources are only constant values. The result is shown in Figure 11.
Findings & Implications. The domain of 20.1% columns can be determined from static analysis because they stores constant values.
Program analysis can identify such columns and their domains, and couple with existing techniques that are based on histograms. For instance, tools can be built to automatically create histograms for these columns. This is a better solution than maintaining no statistics at all, or doing so for all columns, since columns of large domain (e.g., all possible numeric values) will cause great overhead of maintaining histograms.
6 Physical Design
In this section, we show the code patterns that reveal opportunities for better physical design. We have two major findings:
-
•
Many applications reorganize the data retrieved from database into other data structures like tree. Automatically maintaining other data structures from relational storage can help reduce programming effort and improve performance.
-
•
Values of some database columns are derived entirely from query results, indicating that program analysis can automatically detect some functional dependencies.
6.1 Physical layout
Motivations ORM applications store persistent data in relational database. However, some data is not always used in a relational way. Under these circumstances, an ORM application may need to repeatedly retrieve data from relational database and then reorganize the data into other data structures like tree or graph, which may greatly hurt performance.
Manual Study We manually checked the source code of all the studied ORM applications and found many cases of re-organizing relational data, where tuples retrieved are put into array, and later used to build other data structures. These data structures and applications are listed in Table 2.
An example is shown in Listing 8. By default, the comments retrieved from Comment table are stored in an array parents ( Line 2), which is later iterated over and reorganized into a tree of comments (from Line 7 to Line 18), with the parent-child relationship in the tree representing a reply-to relationship. Such data transformation may take long time when the retrieved relational data has a big size. For example, the operation in Listing 8 takes 11.32 seconds to finish for 100K returned records.
Our manual investigation shows that the above data-structure reorganization is demanded by program semantics. For example, forum applications often need to organize forum comments into a comment tree like the one shown in Listing 8, where a child comment is a reply to its parent comment; project-management applications like gitlab[11] and redmine[20] often need to use trees to demonstrate dependencies between activities or projects; map-related applications like openstreetmap[17] often needs to re-organize map tiles, which are stored in relational database, into a grid sorted by longitude and latitude positions.
We have also observed that such data-structure re-organization could be very inefficient and repeatedly conducted, causing huge performance loss. For example, the same tree or grid or others may need to repeatedly reconstructed at every invocation of a controller action. And each data reorganization could take tens of seconds or more like the example shown in Listing 8.
| Tree | gitlab, redmine, lobsters, browsercms |
| Grid | openstreetmap, calagator, iNaturalist |
| Graph | jobsworth, huginn |
| Interval tree | openproject |
| Hash map | huginn |
Findings & Implications We have observed that many applications need to reorganize data read from relational table, transforming them into complicated data structures like trees, graphs, etc.
An automatic way of maintaining non-relational data structure atop relational storage, or physically storing data in a non-relational way, can greatly improve the performance of these ORM applications. To build such an automatic tool, one may leverage recently proposed program synthesis techniques that can synthesize efficient implementations of complicated collection data structures from high-level specifications [43]. Of course, previous synthesis techniques [43] consider a hash or array list to be the persistent store of the original data. In the ORM context, we will need to extend existing techniques to consider a relational table as the persistent storage, and/or to translate table queries into operations on hash or array list.
6.2 Columns computed from queries
Motivations Functional dependencies among columns are critical to database design and query optimization. Traditionally functional dependency is detected via collecting statistics of data stored in a table. For tables created by ORM applications, static program analysis is able to provide an alternative way to detect functional dependency.
Listing 9 shows an example, where the child projects have the same status as its parent. This code snippet reveals a conditional functional dependency that can be detected by program analysis: for the assignment of p.status, the data source of that assignment comes from a query on the column status, if the condition id=p.parent_id satisfies. Such dependency information can be used for choosing query plan for queries like Listing 10.
CADO Analysis We use CADO to analyze the data source for every assignment of a class field that is physically stored as a table column, as discussed in Section LABEL:sec:op_constcolumn. We consider a column c to have functional dependency on other columns, when all its data sources are query results. That is, c potentially has dependency on the columns involved in the source queries. We count the number of such columns, and the result is presented in Figure 11.
Findings & Implications We have observed that 11.7% of the columns are derived entirely from query results. These columns are likely to be functionally dependent on other columns.
Static program analysis could provide an alternative approach to computing functional dependencies. Specifically, if a column c is computed from the results of a set of queries , further analysis on can determine which columns are involved in and further program dependency analysis can infer what is the exact relationship between and c. Furthermore, if a columns is computed in different ways under different user inputs or user actions, the dependency relationship would need to contain some predicates conditioning on user inputs.
7 Query-result processing
Motivations How well an application scales with big data is crucial to the success of the application. Users will probably run away from an application that slows down dramatically when the data(base) size becomes bigger or if the web application’s response time goes beyond tens of seconds. Since query scalability has already been studied [28], we will study computation scalability on ORM-application servers (i.e., excluding query time) through a combination of static program analysis and dynamic profiling.
CADO Profiling Intuitively, when database size increases, some queries would return larger numbers of records, causing query-result processing to take longer time.
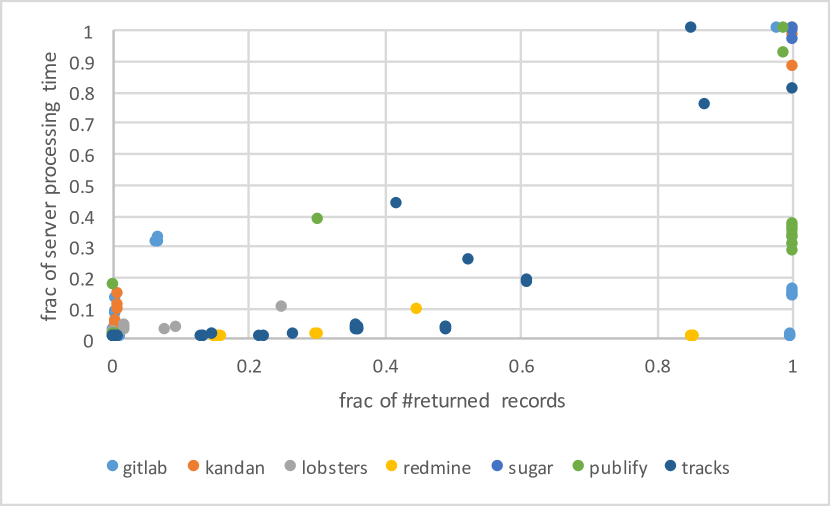
To quantitatively examine such a trend of scalability or lack-of-scalability, we profiled seven representative ORM applications. For each application, we record the application-server time (i.e., excluding database query time) of different actions. Some actions are quick and some are slow, so for each action we plot the server time and the number of tuples returned by queries in that action to examine the relationship between them. Since we do not mean to compare the execution time and query-result size across different actions or different applications, we normalize the results and only show the relative execution time and query-result size in the figure, with the maximum value as baseline 1.
Profiling Findings & Implications The results in Figure 12 confirm the intuition that when an application action retrieves larger query results, the application processing time will increase. There are a few exceptions, demonstrated by points on the right bottom corner of Figure 12. Our manual investigation shows that most of these happen when the query results are only used as inputs to other queries and are not one-by-one processed by program (discussed in Section 5.2).
Our profiling also shows that these ORM applications all suffer from severe performance problems when the database size is big. For example, we have measured the longest processing time (baseline for y-axis) in Figure 12) in each application: 36 seconds in gitlab, 8 seconds in kandan, 11 seconds in lobsters, 311 seconds in redmine, 22 seconds in sugar, and 111 seconds in tracks, when the action returns around 100K database records (baseline for x-axis). Such a slow performance, over one minute for several applications, is intolerable for end users. These findings indicate the importance of limiting the number of records returned by queries to achieve good application scalability.
CADO Analysis Following the above profiling finding, we then use static program analysis to check how often ORM applications contain queries whose result size increases with the database size.
Specifically, in Rails, a query would return unbounded-sized results (i.e., result size increasing with the database size) in all but the following situations: (1) the query always returns a single value (e.g., a COUNT query); (2) the query always returns a single record (e.g., retrieving using a unique identifier); (3) the query uses a LIMIT keyword bounding the number of returned records. CADO static analysis goes through all queries in an ORM application and decides whether a query has bounded or unbounded result size based on the query type discussed above. We then count the average number of queries returning bounded or unbounded numbers of records, with the result shown in Figure 13.
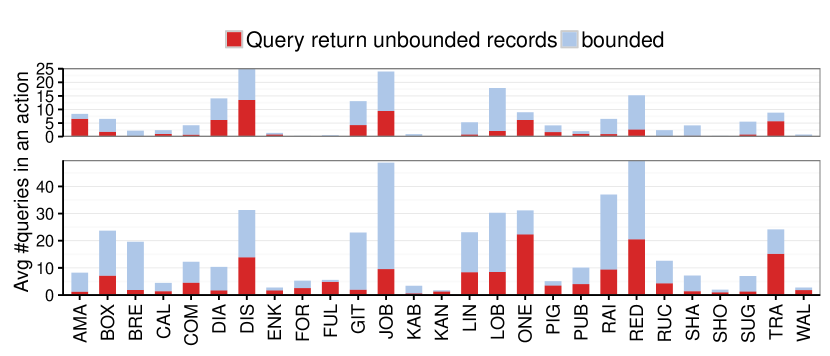
Analysis Findings & Implications We found that many queries (35.5%) return unbounded numbers of result records. Processing these queries is likely to become scaling bottleneck.
Turning queries from returning unbounded results to bounded can clearly help improve application scalability. However, it would require changes to application code. For instance, if an application designer wishes to show all the comments on a single webpage, she will write code to retrieve all comments and render them, making the response time of the corresponding webpage to increase at least linearly with the comments table size. An alternative design is to render only comments at a time, and incrementally load more comments when the user scrolls down the page. In this case the query on the comments table returns a small number of records. We manually tried the above changes for actions in two applications, redmine and publify. These changes lead to huge performance improvement: 98% reduction in initial response time for redmine and 50% for publify as shown in Figure 14.
When we change an application to use incremental loading, two major challenges remain. First, queries needs to be rewritten to retrieve only the data shown initially on the webpage. What data to present on the initial page and what to load next depend on user interaction. For instance, the loading method for scrolling (initially showing top tuples) differs from zooming (initially showing aggregate results). Second, queries need to be further optimized to reduce the overhead of each loading (e.g., loading in each page scroll). For instance, in publify the articles to be sorted by their create time before being retrieved and rendered, which is time consuming for every scrolling. Similar optimizations as mentioned in Section 5.1 can be applied to accelerate queries in incremental loadings.
Overall, scalability bottlenecks caused by unbounded query results widely exist in ORM applications. They are a severe threat to the usability of ORM applications when data size increases. How to redesign applications and optimize query execution to eliminate these scalability bottlenecks is critical and also challenging.

8 Caching and Prefetching
This section studies the opportunities for query caching and prefetching. Caching stores the results of previously executed queries, which may serve later queries and avoid redundant database execution. Since we already discussed caching intermediate results within an action in Section 5.1, our following study will be about inter-action caching — how queries from previous actions can help queries in later actions.
Prefetching pre-executes queries which are predicted to be executed in subsequent actions. That is, if one can predict which web page a user will visit next, some queries that would be issued by the next page could be pre-executed to reduce the response time of the next page.
We study the optimistic performance gain of caching and prefetching in one user session, and the chances to cache and prefetch specific types of queries. Our major findings include:
-
•
Caching can help serve a big portion of read queries, but its potential performance gain is not as much, as many queries that can benefit from caching take little time to execute.
-
•
Most queries (more than 90%) issued by a web-page can be prefetched as their inputs are known at the previous page.
-
•
Many queries issued by a page share same templates with some queries issued by previous pages. These queries can be efficiently prefetched by combining them with queries from previous pages.
8.1 Caching
Motivations By default Rails clear the query cache after an action finishes, so no data is shared across actions. However, query results of a current action can be reused to serve queries in later actions. Furthermore, we have observed two patterns in Rails applications that facilitate many syntactically-equivalent queries to be issued across actions. Caching could be beneficial for these queries. First, Rails support filters — the code, including queries, inside a filter of class would be executed every time a member function of is invoked. Consequently, the same queries in would be issued by many different actions that invoke member functions of . Second, many pages share the same layout. Consequently, the same queries are repeatedly issued to generate the same layout when rendering different pages.
We aim to better understand how beneficial inter-action caching can be for ORM applications, which will then reveal whether it is worthwhile to design a good inter-action caching mechanism. We mainly focus on the caching opportunity within a user session, and leave multi-session and multi-user analysis as future work.
CADO Profiling To study the optimistic performance gain by inter-action caching, we will simulate a user session by randomly visiting 9 pages333We choose 9 to be the number of pages per user session (not including the login page) since the average number of visits per day per user for the 10 most popular website in the U.S. is 8.35 [2]. starting from a random page in the application, and then compare queries issued by one action with those by previous actions from two perspectives.
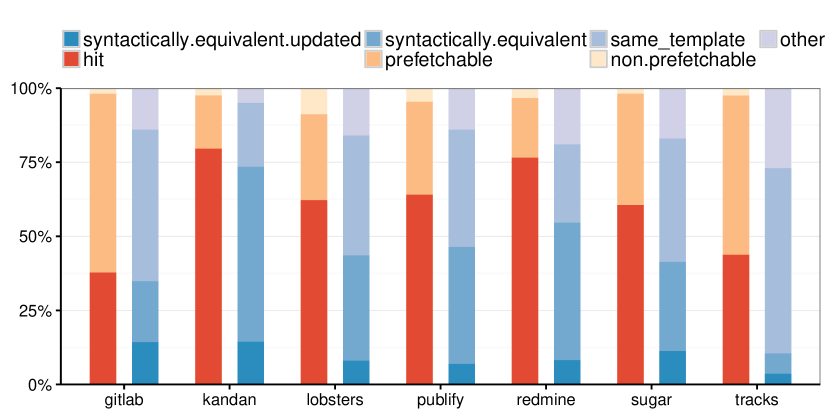
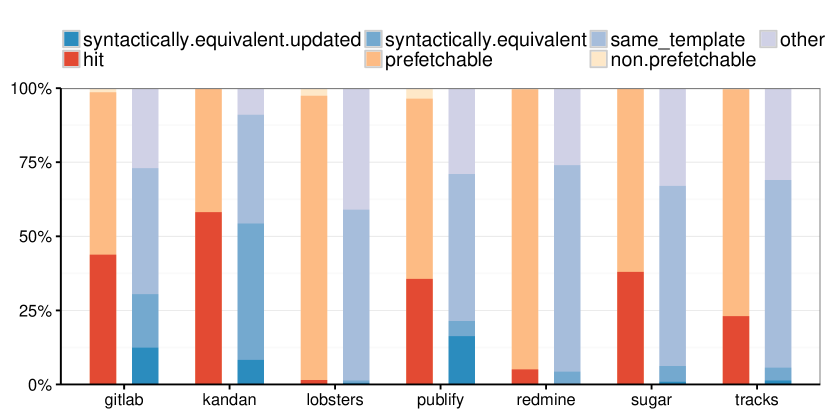
First, we compare query results across actions. For each query, we check whether all its result tuples can be found in the data retrieved by some queries from earlier actions in the same session. If yes, this query can benefit from caching and is categorized as a “hit” query, represented by the red bars in Figure 15 and Figure 16.
Second, we compare query strings across actions. For each query Q, we check whether a query with exactly the same query string has been issued by previous actions in this session. If yes, Q is considered as having a syntactically equivalent peer and is a good candidate for using cache. We further check whether the result of Q is the same as its syntactically equivalent peer Q’ or not, as the database content could have been updated between Q’ and Q. The results are represented by the two darkest blue bars in Figure 15 and Figure 16.
Findings and Implications We show the breakdowns of the number of all queries and the execution time of all queries in Figure 15 and Figure 16 respectively, following the two categorizing perspectives discussed above.
At the first glance, caching looks promising based on the query counts. For all applications profiled, on average 60% of read queries can obtain their results from inter-action cache (i.e., hit queries); on average 43% of read queries have syntactically equivalent queries issued by earlier actions, among which 10% can directly use the earlier results.
However, caching is actually not so beneficial in terms of query running time. Only 23.6% of query time is spent by hit queries and only 17.6% spent by queries with syntactically-equivalent peers.
Our findings reveal that although many queries can obtain their results from an ideal inter-action cache, these queries are usually short-running ones. Consequently, although it still depends on the type of application, when the system bottleneck is query execution instead of network, inter-action caching within a user session is not worthy to implement for most applications.
8.2 Prefetching
Motivations In this section we study the potential performance gain of prefetching. Similar to Section 8.1, we first analyze the optimistic performance improvement by prefetching (optimistically how many queries can be prefetched). We consider a query to be “prefetchable”, if all its parameters can be determined at the previous action. Then we look into a specific type of prefetchable queries — prefetchable queries from different actions that share the same template.
An example of queries sharing the same template is shown in Listing 11, where 40 sorted stories are listed on each page. When a user visits the first page, the query shown in Listing 12 is issued. Then, when the user visits the second page, the query in Listing 13 is issued. These two queries issued by consecutive actions share the same template but contain different parameters. Note that, the query shown in Listing 13 is considered prefetchable, because all the query parameters can be determined once we predict that page 2 (page_id is 1) will be visited next.
We pay special attention to the above type of queries, because the same-template property allows their prefetching to be efficiently done by combining them with queries from earlier actions. Such combinig brings non-trivial performance gain. For instance, the query in Listing 12 and Listing 13 can be combined as shown in Listing 14. The combining eliminates the redundant sorting work of query in Listing 13. Consequently, executing the combined query is faster than executing the two separate queries one by one.
CADO Profiling and Analysis We first analyze what queries can be prefetched, which depends on both the query itself and the action it resides in. As mentioned in Section 2.1, when visiting a webpage, a user can send another request to the server by either clicking a link on the current page, or filling and submitting a form. In the former case, the parameters to the next action are known once we predict which link the user will click. Consequently, the next action can be pre-run and all queries in the next action can be prefetched. In the latter case, the parameters to the next action come from the unpredictable content that the user will fill in the form. Consequently, not all queries in the next action can be prefetched — only those whose parameters do not depend on unpredictable user inputs are prefetchable.
We then check which prefetchable query shares the same template with a query issued by the previous action, because these queries can potentially be more efficiently prefetched through query combining as discussed earlier.
We do the above counting through both CADO profiling and CADO static analysis. During profiling, for an action triggered by a GET http request, we treat all the queries issued by it as prefetchable; for an action triggered by a POST request, we treat only those queries that do not use user inputs (i.e., parameters in the POST request) as prefetchable. We then analyze the query log across actions. For each prefetchable query Q, we go through all queries from the previous action to see if there exists a query Q’ that shares the same query template. The results of this counting is shown in Figure 15 and Figure 16.
In static analysis, CADO gets possible current–next action pairs linked by the next action edge described in Section 3.1, as well as whether a next action is invoked through GET or POST request. Inside each action, CADO marks the query that does not use user input as parameters (analysis of query source is described in Section 5.5) as prefetchable. For a prefetchable query Q in a next action, we check if there exists a query Q’ from the corresponding current action that is issued by the same piece of code as Q (e.g., queries in Listing 12 and Listing 13 are both issued by code on Line 3 of Listing 11). If Q’ exists, Q is considered to be a prefetchable query sharing the same template with a previous query. The statistics for all applications are shown in Figure 17.
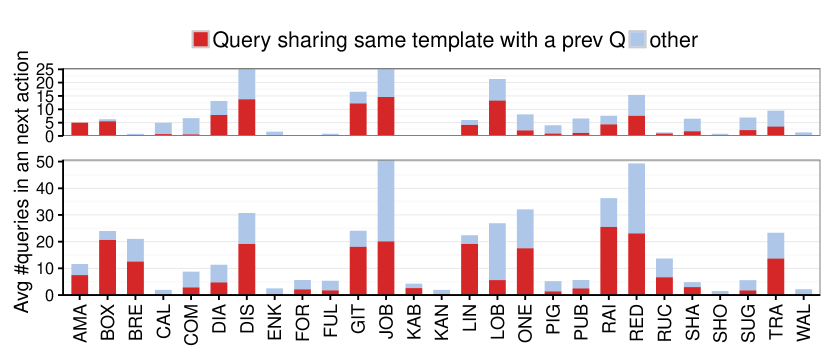
Findings & Implications Intuitively, a webpage usually contains more clickable links than forms to be filled. Consequently, most queries are prefetchable. This is confirmed by the results in Figure 15 and Figure 16, which show that most queries (93.6% in number and 98.7% in time) are prefetchable. The figures also show that many queries (40.4% in number and 54.3% in time) are not only prefetchable but also share the same template with queries from the previous action. A similar trend is also shown by static analysis in Figure 17: for each pair of current-next actions, 53.2% of queries issued in the next action share the same template with a query in the current action.
The above results reveal a great opportunity of improving performance by prefetching, and particularly by prefetching queries with the same template. Furthermore, since static program analysis is able to identify prefetchable queries with the same template, a query rewriting tool can use techniques proposed by [31] to automatically combine queries to prefetch data. However, it can be unrealistic to prefetch queries in all possible next actions if there are many links on a current page. A good prediction based on user behavior patterns will help only prefetch queries for actions that are most likely to be triggered next.
9 Software testing
Motivation Functional testing is crucial for all types of software, consuming 30% of software development resources [45]. The quality of functional testing is often measured by code coverage, such as statement coverage and branch coverage. Much research has been conducted to help generate test inputs that can drive the testing to achieve high coverage [30]. Unfortunately, existing input-generation techniques do not consider how to generate database content. Therefore, we want to examine how many branches’ outcomes depend on database content and figure out whether traditional testing techniques are sufficient for ORM-based software.
CADO Analysis For every branch inside a controller action, we want to know whether the outcome of its branch condition depends on database content or not. To do so, we track the data flow on AFG and identify all the source nodes of the branch condition in . If any of these source nodes includes database queries, the outcome of this branch could depend on database content and this branch is categorized as DB-sensitive. The result of our study is shown in Figure 18.
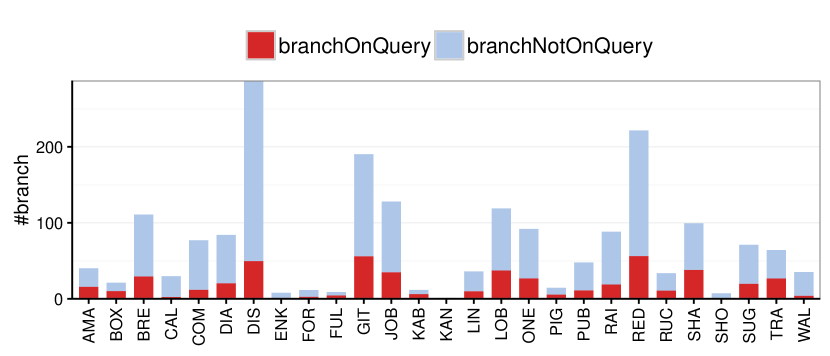
Findings & Implications We have observed that a significant portion of branches (26.5%) are DB-sensitive.
10 related work
Besides the prior work related to our findings, as mentioned in previous sections, we discuss two more major categories of related work.
Empirical studies A previous empirical study [32] investigated performance anti-patterns for ORM applications. However, this work only includes two anti-patterns, and only covers three applications using Hibernate ORM. This paper provides a much thorough study of performance problems in Rails-based ORM applications.
Another previous work [29] also studied open-source Rails applications like this paper does. However, it only focuses on how Rails applications use different concurrency control mechanisms. This work only studied the patterns in the code, while we performed a deeper study on these applications using program analysis and profiling.
Program analysis for database optimization Our work shares the same optimization philosophy with some recently proposed techniques — optimize the database-related applications based on program analysis instead of query log. DBridge [35, 47, 44, 40, 31] includes a series of work on holistic optimization. Besides query batching and binding as we mentioned earlier, this set of work also includes automatic transforming of regular object-oriented code into synthesized queries, decorrelation of user functions and queries, etc. Other holistic optimizations includes but not limited to, QBS [34, 35] for query synthesis, QURO [48] for query reordering in transactions, PipeGen [42] for automatic data pipe generation, etc.
11 conclusion
In this paper we studied the performance patterns on a set of 27 real-world web applications built with ORM framework We build CADO to perform static analysis on these applications and examine how the application interact with databases using ORM. CADO also generates synthetic data and profiles the application at runtime to better understand their performance.
Our findings reveal many optimization opportunities, for instance, program-analysis assisted multi-query optmization, automatic program transformation to reduce redundant data retrieval, determining domains/constraints of database columns by static analysis, automatic incremental loading, query combining for prefetching, etc. We point out that program analysis can play important role in many optimizations.
Future research can benefit from our study in various aspects. For example, web developers can use CADO to detect performance issues and apply solutions in our study. ORM designers can leverage program analysis to automate optimizations within ORM layer. Database designers can gain insights on how people use databases from our study and implement optimizations that potentially benefit a large number of applications.
References
- [1] Active record. https://github.com/rails/rails/tree/master/activerecord.
- [2] Alexa web traffic tracker. http://www.alexa.com/siteinfo.
- [3] The bidding benchmark from silo. http://jruby.org/apidocs/org/jruby/ir/instructions/Instr.html.
- [4] Caching in the orm. https://docs.phalconphp.com/en/latest/reference/models-cache.html.
- [5] Caching with rails: An overview. http://guides.rubyonrails.org/caching_with_rails.html.
- [6] Common length of a comment. https://www.reddit.com/r/dataisbeautiful/comments/2mkp6u/comment_length_by_subreddit_oc/.
- [7] Discussion on blog length. https://www.snapagency.com/blog/whatll-best-length-blog-article-2015-seo/.
- [8] Django. https://www.djangoproject.com/.
- [9] Enterprise javabeans. https://jcp.org/en/jsr/detail?id=220.
- [10] Entity framework. http://www.asp.net/entity-framework.
- [11] gitlab. https://github.com/gitlabhq/gitlabhq.
- [12] Hibernate. http://hibernate.org/.
- [13] Inheritance mapping. https://docs.jboss.org/hibernate/orm/3.5/reference/en-US/html/inheritance.html.
- [14] lobsters. https://github.com/jcs/lobsters.
- [15] Mapping objects to relational databases: O/r mapping in detail. http://agiledata.org/essays/mappingObjects.html.
- [16] N+1 query problem. https://www.sitepoint.com/silver-bullet-n1-problem/.
- [17] openstreetmap. https://github.com/openstreetmap/openstreetmap-website.
- [18] publify. https://github.com/publify/publify.
- [19] Rails association. http://guides.rubyonrails.org/association_basics.html.
- [20] redmine. https://github.com/redmine/redmine.
- [21] Render rules. http://guides.rubyonrails.org/action_view_overview.html.
- [22] Ruby on rails. http://rubyonrails.org/.
- [23] Speed up active record. https://blog.codeship.com/speed-up-activerecord/.
- [24] sugar. https://github.com/elektronaut/sugar.
- [25] tracks. https://github.com/TracksApp/tracks.
- [26] A. V. Aho, M. S. Lam, R. Sethi, and J. D. Ullman. Compilers: Principles, Techniques, & Tools. Addison Wesley, 2006.
- [27] J.-h. An, A. Chaudhuri, and J. S. Foster. Static typing for ruby on rails. In ASE, pages 590–594, 2009.
- [28] M. Armbrust, E. Liang, T. Kraska, A. Fox, M. J. Franklin, and D. A. Patterson. Generalized scale independence through incremental precomputation. In SIGMOD, pages 625–636, 2013.
- [29] P. Bailis, A. Fekete, M. J. Franklin, A. Ghodsi, J. M. Hellerstein, and I. Stoica. Feral concurrency control: An empirical investigation of modern application integrity. In SIGMOD, pages 1327–1342, 2015.
- [30] C. Cadar, D. Dunbar, and D. Engler. Klee: Unassisted and automatic generation of high-coverage tests for complex systems programs. In OSDI, pages 209–224, 2008.
- [31] M. Chavan, R. Guravannavar, K. Ramachandra, and S. Sudarshan. Dbridge: A program rewrite tool for set-oriented query execution. In ICDE, pages 1284–1287, 2011.
- [32] T.-H. Chen, W. Shang, Z. M. Jiang, A. E. Hassan, M. Nasser, and P. Flora. Detecting performance anti-patterns for applications developed using object-relational mapping. In ICSE, pages 1001–1012, 2014.
- [33] T.-H. Chen, W. Shang, Z. M. Jiang, A. E. Hassan, M. Nasser, and P. Flora. Finding and evaluating the performance impact of redundant data access for applications that are developed using object-relational mapping frameworks. IEEE Transactions on Software Engineering, 2016.
- [34] A. Cheung, A. Solar-Lezama, and S. Madden. Optimizing database-backed applications with query synthesis. In PLDI, pages 3–14, 2013.
- [35] K. V. Emani, K. Ramachandra, S. Bhattacharya, and S. Sudarshan. Extracting equivalent sql from imperative code in database applications. In SIGMOD, pages 1781–1796, 2016.
- [36] J. Ferrante, K. J. Ottenstein, and J. D. Warren. The program dependence graph and its use in optimization. pages 319–349, 1987.
- [37] S. Finkelstein. Common expression analysis in database applications. In SIGMOD, pages 235–245, 1982.
- [38] G. Giannikis, G. Alonso, and D. Kossmann. Shareddb: Killing one thousand queries with one stone. In VLDB, pages 526–537, 2012.
- [39] P. Godefroid, N. Klarlund, and K. Sen. Dart: directed automated random testing. In PLDI, pages 213–223, 2005.
- [40] R. Guravannavar and S. Sudarshan. Rewriting procedures for batched bindings. In VLDB, pages 1107–1123, 2008.
- [41] S. Harizopoulos, V. Shkapenyuk, and A. Ailamaki. Qpipe: A simultaneously pipelined relational query engine. In SIGMOD, pages 383–394, 2005.
- [42] B. Haynes, A. Cheung, and M. Balazinska. Pipegen: Data pipe generator for hybrid analytics. In SOCC, pages 470–483, 2016.
- [43] C. Loncaric, E. Torlak, and M. D. Ernst. Fast synthesis of fast collections. In PLDI, pages 355–368, 2016.
- [44] K. Ramachandra, M. Chavan, R. Guravannavar, and S. Sudarshan. Program transformations for asynchronous and batched query submission. IEEE Transactions on Knowledge and Data Engineering, pages 531–544, 2015.
- [45] SDTimes. Testers spend too much time testing. http://www.sdtimes.com/SearchResult/31134.
- [46] K. Sen, D. Marinov, and G. Agha. Cute: A concolic unit testing engine for c. pages 263–272, 2005.
- [47] V. Simhadri, K. Ramachandra, A. Chaitanya, R. Guravannavar, and S. Sudarshan. Decorrelation of user defined function invocations in queries. In 2014 IEEE 30th International Conference on Data Engineering, pages 532–543, 2014.
- [48] C. Yan and A. Cheung. Leveraging lock contention to improve oltp application performance. In VLDB, pages 444–455, 2016.