Galaxies with conspicuous optical warps ††thanks: E-mail: v.reshetnikov@spbu.ru ††thanks: Partly based on observations obtained with the 6-m telescope of the Special Astrophysical Observatory of the Russian Academy of Sciences.
Abstract
In this paper, we present results of a photometric and kinematic study for a sample of 13 edge-on spiral galaxies with pronounced integral-shape warps of their stellar discs. The global structure of the galaxies is analyzed on the basis of the Sloan Digital Sky Survey (SDSS) imaging, in the , and passbands. Spectroscopic observations are obtained with the 6-m Special Astrophysical Observatory telescope. In general, galaxies of the sample are typical bright spiral galaxies satisfying the Tully-Fisher relation. Most of the galaxies reside in dense spatial environments and, therefore, tidal encounters are the most probable mechanism for generating their stellar warps. We carried out a detailed analysis of the galaxies and their warps and obtained the following main results: (i) maximum angles of stellar warps in our sample are about 20o; (ii) warps start, on average, between 2 and 3 exponential scale lengths of a disc; (iii) stronger warps start closer to the center, weak warps start farther; (iv) warps are asymmetric, with the typical degree of asymmetry of about several degrees (warp angle); (v) massive dark halo is likely to preclude the formation of strong and asymmetric warps.
keywords:
galaxies: spiral – galaxies: structure – galaxies: kinematics and dynamics1 Introduction
According to the prevailing point of view, disc galaxies are usually highly thin and flat. This is true, but only to a certain extent. Peripheral parts of galactic discs often exhibit deviations from the united plane and demonstrate global warps. This phenomenon has been revealed in the neutral gas component, through HI observations (e.g. Sancisi, 1976, Bosma, 1981, Briggs, 1990, García-Ruiz, Sancisi & Kuijken 2002), and in a lesser extent through optical and infrared observations (e.g. Sánchez-Saavedra, Battaner & Florido, 1990, de Grijs, 1997, Reshetnikov & Combes, 1998, 1999, Schwarzkopf & Dettmar, 2001, Sánchez-Saavedra et al., 2003, Ann & Park, 2006, Saha, de Jong & Holwerda, 2009, Guijarro et al., 2010).
Typically, warps appear in the outskirts of optical discs, and careful investigation of edge-on galaxies have revealed that a significant fraction (e.g. 50% – Sánchez-Saavedra, Battaner & Florido, 1990, 40% – Reshetnikov & Combes, 1998, 50% – Ann & Park, 2006) of stellar discs shows integral-shape with typical amplitudes of a few degrees. This high percentage of observed warps would suggest that the majority of galaxies are warped, since the projection effects should hide large fraction of warps, whose line of nodes is perpendicular to the line of sight. Optical warps were also common in the past, with even greater amplitudes at (Reshetnikov et al., 2002).
Several theoretical mechanisms have been proposed to explain the formation and maintenance of warped discs (e.g. Binney, 1992, Kuijken & Garcia-Ruiz, 2001, Sellwood, 2013 and references therein). Among the proposed scenarios, discrete modes of bending in a self-gravitating disc (Toomre, 1983, Sparke & Casertano, 1988), misaligned dark halos (Dubinski & Kuijken, 1995), galaxy interactions and accretion of satellites (e.g. Huang & Carlberg, 1997, Schwarzkopf & Dettmar, 2001, Kim et al., 2014), direct accretion of intergalactic matter in the outskirts of galaxies (e.g. Revaz & Pfenniger, 2001, van der Kruit, 2007, Roškar et al., 2010), extragalactic magnetic fields (Battaner et al., 1990), and others. This large variety of proposed mechanisms and their modifications probably indicates that there is no single mechanism responsible for all observable warps in galaxies. The current situation looks like the largest warps are mostly caused by tidal distortions (Schwarzkopf & Dettmar, 2001, Ann & Park, 2006), whereas relatively small warps are triggered and supported by a variety of mechanisms.
Most previous studies of optical warps have been devoted to receiving a quantitative description of this phenomenon by collecting statistics for their properties and frequency depending on galaxy morphology, while thorough investigations of warped discs for individual galaxies were quite rare. (This is partly explained by the weakness of the phenomenon: warps are usually seen in the periphery of stellar discs, and their amplitudes are often small.) Some representative examples of galaxies with the detailed studies of their optical warps are M 33 (Sandage & Humphreys, 1980), NGC 5907 (warp angle – Sasaki, 1987), Mrk 176 ( – Reshetnikov, 1989), NGC 4013, NGC 4565, NGC 6504 (Florido et al., 1991), MCG 06-30-005 ( – Kemp & Meaburn, 1993), UGC 3697 ( – Ann, 2007). Stellar discs of the Milky Way (Reed, 1996), LMC (Olsen & Salyk, 2002), and the Andromeda galaxy (Innanen et al., 1982) were found to be also warped.
The main goal of this paper is to perform a detailed photometric and kinematic study of thirteen edge-on spiral galaxies with integral-shaped stellar discs in order to derive observational characteristics of these galaxies and their warps. This information is very important for understanding the mechanisms responsible for the generation and maintenance of these prominent galaxy features. Until now, a detailed analysis of warped galaxies has been carried out for a few objects. In this paper, we are about to make a new contribution in this area.
This paper is organized as follows. In the next section we present our sample. In Section 3, we introduce our decomposition technique, as well as the preparation and fitting of optical galaxy images. In Section 4, we describe our own spectroscopic observations. The results of our investigation are presented in Section 5. We summarize our main findings and conclusions in Section 6.
Throughout this article, we adopt a standard flat CDM cosmology with =0.3, =0.7, =70 km s-1 Mpc-1.
2 The sample
We selected our sample of galaxies based on the view of their non-flat stellar discs in the Sloan Digital Sky Survey (SDSS, Alam et al., 2015). Most of them were visually selected during the creation of the Sloan-based Polar Ring Catalogue (SPRC Moiseev et al., 2011) and the catalogue of Edge-on disc Galaxies In SDSS (EGIS Bizyaev et al., 2014). Our sample contains 13 objects and it is biased to galaxies with strong optical warps.
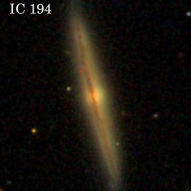
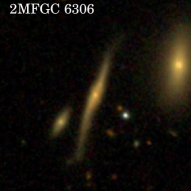
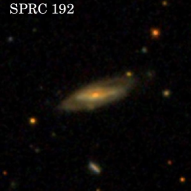
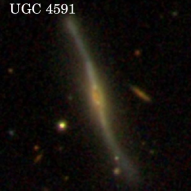
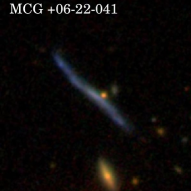
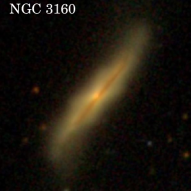
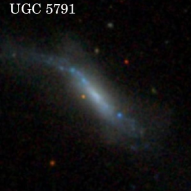
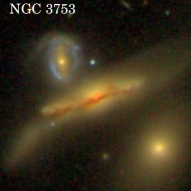
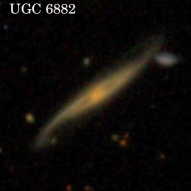
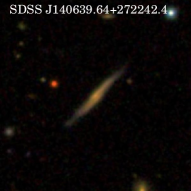
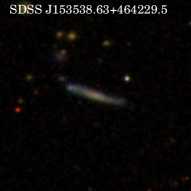
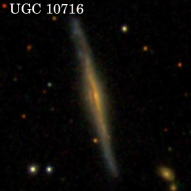
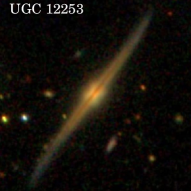
Selected galaxies belong to different environments – from group members to relatively isolated objects (this information is taken from the NASA/IPAC Extragalactic Database, NED111http://ned.ipac.caltech.edu/ hereafter). An overview of the basic properties of the sample galaxies is given in Table 1. Fig. 1 shows SDSS thumbnail images of the galaxies. Some brief notes on each object are given below.
IC 194 (UGC 1542, RFGC 439, PGC 7812) is seen almost exactly edge-on. Optical disc warping is not strong: edge-on disc tips have a barely detectable -shape. This galaxy has no nearby bright companions, but a loose group of galaxies PPS2 136 with the close redshift is located at a projected distance of 170 kpc from IC 194 (Trasarti-Battistoni, 1998).
2MFGC 6306 is classified within the framework of the GalaxyZoo project (Lintott et al., 2008, 2011), with the weighted fraction of votes out of all responses that this galaxy is edge-on . Its stellar disc looks asymmetric and warped. 2MFGC-6306 probably forms a group with three other galaxies with close redshifts – SDSS J075644.97+440536.7, CGCG 207-007, and 2MASSX J07563889+4407408.
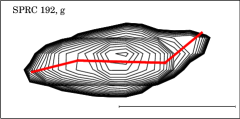
SPRC-192 is classified as a related to polar-ring galaxies (PRGs) object (Moiseev et al., 2011). It is an early-type spiral with the visible dust lane along the disc major axis surrounded by an inclined ring-like structure. Morphologically, it is similar to the well-known polar-ring galaxy NGC 660. Obviously, if this galaxy had a higher inclination, it would look like a strongly warped spiral. The galaxy has no nearby companions of comparable sizes, but its morphology may point to a profound external perturbation or an accretion event in the past.
UGC 4591 (RFGC 1430, PGC 24674) is an edge-on spiral galaxy, a member of the group of three galaxies WBL 193 (White et al., 1999) (the brightest of them is the spiral galaxy IC 2394). The apparent disc bending starts at the half-radius of the galaxy.
MCG +06-22-041 (RFGC 1674, PGC 28776) at is a thin late-type spiral galaxy without any presence of a bulge. It was classified in the GalaxyZoo as an edge-on galaxy (). Similar redshifts of nearby objects (elliptical galaxy CGCG 182-048 and 2MASSX J09574267+3603307, both at ) suggest that MCG +06-22-041 may be in a group.
NGC 3160 (UGC 5513, PGC 29830) is one of the most interesting objects in our sample. It was classified in the GalaxyZoo as an edge-on galaxy with . NGC 3160 shows several prominent features such as strong disc warping and a contrast X-shaped structure in the central part of the galaxy. NGC 3160 is a member of the cluster of galaxies NRGb 78, with the brightest elliptical galaxy NGC 3158 at the centre.
UGC 5791 (SPRC-197, PGC 31697) is a blue peculiar galaxy for which S4G (Sheth et al., 2010) analysis has been done. It is the nearest galaxy in the sample. The inclination angle for this galaxy is barely measurable because of its peculiar shape. It is a pair member, together with the galaxy UGC 5798 (Peterson, 1979). UGC 5791 is classified as a PRG-related object (Moiseev et al., 2011).
NGC 3753 (UGC 6602, Arp 320, SPRC-203, PGC 36016) is an interacting galaxy, marked by Moiseev et al. (2011) as an object related to PRGs. It belongs to the compact group Hickson 57 (Hickson, 1982) and was included in the catalogue of nearby poor clusters of galaxies (White et al., 1999). The warped dust disc has apparent edge-on orientation. The stellar disc is significantly warped and has an asymmetric view. The galaxy image gives us a hint that its structure may include a bar or an inner disc overlapping with a dust component. Two bright companions near NGC 3753 are the spiral galaxy NGC 3754 and the elliptical galaxy NGC 3750.
UGC 6882 (SPRC-204, PGC 37372) is another galaxy related to PRGs (Moiseev et al., 2011), which is probably close to edge-on orientation according to the classification from the GalaxyZoo (). It also belongs to the 2MASS selected Flat Galaxy Catalog (2MFGC, Mitronova et al., 2004). Some small nearby galaxies are seen in the SDSS image, although they do not have optical spectra, and, thus, estimated redshifts.
SDSS J140639.64+272242.4 and SDSS J153538.63+464229.5 are the two most distant and small in angular size galaxies in our sample. Both galaxies have several nearby companions in projection, but, unfortunately, they do not have measured redshifts.
UGC 10716 (RFGC 3242, PGC 59657) is a late-type spiral galaxy viewed almost edge-on (). It was selected in the RFGC catalogue and in the catalogue of edge-on galaxies created by Kautsch et al. (2006). The galaxy forms a triplet with UGC 10714 and SDSS J170726.32+301316.6 (Berlind et al., 2006).
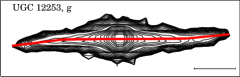
UGC 12253 (RFGC 4028, PGC 70040) is seen in almost exactly edge-on orientation. The sharp dust lane divides the main body of UGC 12253 almost ideally in two halves. The X-pattern at the centre suggests that this galaxy has a boxy/peanut-shaped bulge, a possible evidence of the presence of a bar (Bureau et al., 2006). There are two nearby galaxies with close redshifts (PGC 070044 and SDSS J225556.61+124701.9) and, therefore, UGC 12253 can be a member of a triplet or a group of galaxies.
| # | Galaxy | RA | Dec | (Mpc) | (mag) | (′′) | (deg) | ||||
|---|---|---|---|---|---|---|---|---|---|---|---|
| (1) | (2) | (3) | (4) | (5) | (6) | (7) | (8) | (9) | (10) | (11) | (12) |
| 1 | IC 194 | 02:03:05 | +02:36:51 | 83.8 | -20.88 | 61.9 | 0.25 | 0.75 | 0.51 | Sb | 87.31.2 |
| 2 | 2MFGC 6306 | 07:56:43 | +44:05:49 | 192.0 | -21.12 | 36.4 | 0.22 | 0.85 | 0.52 | Sb | 88.01.6 |
| 3 | SPRC 192 | 08:23:01 | +32:00:54 | 266.5 | -21.93 | 25.7 | 0.37 | 0.75 | 0.46 | Sab | 80.05.1 |
| 4 | UGC 4591 | 08:46:58 | +28:14:17 | 91.5 | -20.26 | 47.4 | 0.34 | 0.64 | 0.34 | Scd | 89.70.4 |
| 5 | MCG +06-22-041 | 09:57:43 | +36:04:09 | 113.3 | -18.85 | 29.9 | 0.22 | 0.05 | -0.1 | Sd | 89.80.6 |
| 6 | NGC 3160 | 10:13:55 | +38:50:34 | 98.2 | -21.40 | 56.2 | 0.36 | 0.85 | 0.44 | Sb | 89.21.7 |
| 7 | UGC 5791 | 10:39:27 | +47:56:50 | 14.6 | -16.68 | 56.3 | 0.43 | 0.31 | 0.16 | Sc | 85.05.0 |
| 8 | NGC 3753 | 11:37:54 | +21:58:53 | 124.0 | -22.29 | 74.6 | 0.31 | 0.89 | 0.49 | Sab | 84.32.7 |
| 9 | UGC 6882 | 11:54:43 | +33:32:12 | 135.1 | -20.98 | 43.2 | 0.23 | 0.74 | 0.38 | Sbc | 80.16.2 |
| 10 | SDSS J140639.64+272242.4 | 14:06:40 | +27:22:42 | 303.5 | -20.89 | 24.3 | 0.18 | 0.64 | 0.49 | — | 88.61.3 |
| 11 | SDSS J153538.63+464229.5 | 15:35:39 | +46:42:30 | 271.4 | -20.17 | 20.7 | 0.22 | 0.41 | 0.18 | — | 84.41.9 |
| 12 | UGC 10716 | 17:07:44 | +30:19:35 | 132.5 | -20.61 | 39.9 | 0.23 | 0.66 | 0.41 | Sb | 87.91.3 |
| 13 | UGC 12253 | 22:56:02 | +12:45:59 | 101.4 | -20.61 | 49.8 | 0.27 | 0.84 | 0.42 | Sb | 89.80.5 |
Columns:
(1) Designation number in the sample,
(2) first name from NED,
(3), (4) J2000 coordinates from NED,
(5) 3K CMB distance from NED (except for 2MFGC 6306 for which the distance was calculated from the radial velocity taken from the HyperLeda database),
(6) absolute magnitude in the band inside of the isophote of 25.5 mag/arcsec2. Galactic extinction (according to Schlafly & Finkbeiner, 2011) and K-correction (using the NED K-Correction calculator based on Chilingarian & Zolotukhin, 2012) was taken into account,
(7), (8) semi-major axis and galaxy flattening of the 25.5 mag/arcsec2 isophote in the -band,
(9), (10) colours corrected for Galactic extinction and K-correction,
(11) morphological type from NED. For SDSS J140639.64+272242.4 and SDSS J153538.63+464229.5, there is no morphological classification in NED or HyperLeda databases,
(12) galaxy disc inclination (see Appendix A in Mosenkov et al., 2015). For UGC 4591 and MCG +06-22-041, we applied the first approach from Mosenkov et al. (2015) using the 3D disc decomposition available in the IMFIT code. Inclination estimate for UGC 5791 is found on the basis of the apparent axial ratio of the central part of the galaxy. For the remaining galaxies, we estimated the inclination by the orientation of the dust lane (the second method from Mosenkov et al., 2015).
3 Preparation and decomposition of galaxy images
3.1 Photometric decomposition technique
An ordinary way to the determine structural parameters of spiral galaxies implies performing the decomposition of their 1D- or 2D-brightness distributions into their two main components: a spherical bulge and a flat disc. The main goal of the decomposition analysis is to separate contributions of different components in the overall brightness distribution and to build a photometric model of the galaxy.
The common empirical model for the bulge representation (in mag/) is the Sérsic model (Sérsic, 1968):
| (1) |
where is the central surface brightness, is the effective radius, and is the so-called Sérsic index with to be a function depending on (, 1993).
The disc is usually described by the exponential law, which in the logarithmic scale (in mag/) turns into a simple linear function of the radius (Patterson 1940; Freeman 1970):
| (2) |
where is the disc central surface brightness and is its exponential scale length.
The distribution of the surface brightness in the radial and vertical directions for the transparent “exponential” disc observed at the edge-on orientation is described by the following expression (in intensities):
| (3) |
where is the disc central intensity, is the radial scale length, is the “isothermal” scale height of the disc (Spitzer, 1942; van der Kruit & Searle, 1981a; van der Kruit & Searle, 1981b, 1982a, 1982b), and is the modified Bessel function of the first order. To find the edge-on disc central surface brightness, we should calculate . The central surface brightness reduced to the face-on is found as . Further, we will use its logarithmic value in mag/.
The above and other models are implemented into many open-access software tools designed to perform photometric decomposition of galaxy images on several components: budda (de Souza, Gadotti & dos Anjos 2004), gim2d (Simard et al. 2002), galfit (Peng et al. 2010), imfit (Erwin 2015), deca (Mosenkov 2014), etc.
In our study, we will use a non-standard approach of applying genetic algorithms (GA) to find the best fit model for a galaxy (Goldberg, 1989). This approach allows us to perform decomposition in a more robust way and avoid local minima of , whereas a standard way to find an optimal model is to apply the gradient descent (Levenberg-Marquardt) or downhill simplex (Nelder-Mead) methods. Also, since genetic algorithms are random and a parameter space is vast, the fitting procedure can be repeated multiple times without resulting in the exact the same solution. This gives us an estimate of the uncertainty for the fit parameters. Other advantages and robustness of GA for decomposition of galaxy images are presented in De Geyter et al. (2013, 2014). Below we provide a brief description of GA properties used in the current work.
GA is an effective computational algorithm for searching solutions of an optimisation problem. It simulates the natural selection process and represents possible solutions of the problem as “organisms”, with “genes” as free parameters of a model. During the optimisation procedure these “organisms” evolve through “breeding” and “mutation” processes.
We use galfit (and imfit for the galaxy SPRC-192, see details in Sect. 3.3) to generate model images of the galaxies convolved with the point spread function (PSF) images (“organisms”), and find value (the fitness which characterizes the quality of the model). is calculated internally in galfit and imfit which take into account the mask (to ignore all objects which will affect our simple bulge/disc decomposition) and the weight images of the galaxy. The values of each gene of each organism of zero-generation are being set randomly. The ranges of possible values for each gene are chosen such that they undoubtedly overlap the true value of the corresponding model parameter. Although using the larger range decreases the rate of the method convergence, we set the parameter ranges as large as possible, to make sure that the true values of the parameters are inside these ranges. The zero generation and any further generation comprises 200 organisms. The total number of generations is chosen to be 100. To retrieve estimates of uncertainties (their lower bounds) for each free parameter, we repeat GA ten times. The best model with minimal is then taken as an initial guess for the subsequent galfit (or imfit) decomposition. This is done in order make the solution found by GA more precise: galfit and imfit implement the Levenberg-Marquardt algorithm which is suitable for searching the global minimum of when a solution, found with GA, is close to the true one.
3.2 Data handling
For our photometric analysis of galaxies, we use the data release DR12 of SDSS. The corrected frames and PSF images (prefix “psField”) for three , , bands were retrieved directly from the SDSS Science Archive Server (SAS). Although downloaded frames have been bias subtracted and flat-fielded, we need to do some additional preparation of the galaxy images for the further decomposition and analysis of galactic warping. All the images were sky-subtracted (sky background was fitted with the polynomial), rotated (such as the plane of the galaxy would be horizontal) and cut out from the original image (the final galaxy image should have a horizontal extent of and a vertical extent of , where and are the major and minor axes respectively). Foreground stars and other contaminants were detected with the Source Extractor (Bertin & Arnouts, 1996), revisited by eye, and then properly masked222These steps were done with the special python package https://github.com/latrop/pipeline..
3.3 Photometric decomposition
Once the data preparation is done, we can perform photometric decomposition of the sample galaxies in the , , and bands. For this, we used the GA approach described in Sect. 3.1. In addition to the masks built in the previous step (Sect. 3.2), we also masked by hand some prominent features of the galaxies which could affect the results of the fitting: dust lanes, which were detected in the band images, and disc warps at radii where the disc bending begins to appear (see Sect. 3.4).
As the band is the deepest band in SDSS, we will mainly use the decomposition results in this band for our further analysis of the galaxy structure. However, we carried out decomposition in two other bands as well. This information is useful to estimate the model colours and of the bulge and the disc, and compare them for different galaxies. Also, the disc scale length as well as the disc scale height can be, in principal, different in different passbands, and it is interesting to compare radial colour gradients for the galaxies of the sample. Some important details on the image decomposition are given below.
All the galaxies (except UGC 6882) were fitted to the edge-on disc plus bulge model (3). The galaxy UGC 6882 looks to be not exactly edge-on, therefore for this galaxy we used an exponential non-edge-on disc model (2) with the apparent disc flattening of . However, we fitted the minor axis surface brightness distribution of this galaxy with the edge-on disc function and estimated its scale height to be , or 1.87 kpc. Since this galaxy is not purely edge-on, we can assume that its vertical scale is somewhat overestimated, and the found value should be used as its upper limit.
Five galaxies (UGC 4591, MCG +06-22-041, UGC 5791, SDSS J140639.64+272242.4, SDSS J153538.63+464229.5) do not exhibit the presence of a well-defined bulge, and thus they were fitted to the single disc model. SPRC-192 is a galaxy with inclined ring-like structure, for which the ring was fitted with the “GaussianRing” function using the imfit code (galfit does not offer this function). We found that the ring has the diameter of 12.6 kpc and its major axis is oriented at the angle of about relative to the edge-on disc plane.
We should note that for the half of the galaxies the dust lane is quite prominent, and, therefore, the dust extinction can severely affect the results of our fitting. In those cases where the dust lane was masked, the model of the bulge can become unreliable since the number of unmasked pixels of the compact bulge can be significantly reduced. For this reason, we do not rely on the retrieved bulge parameters, and only investigate the disc model. The best fit parameters and their uncertainties for the band are presented in Table 2. The bulge-to-total luminosity ratio () can be somewhat underestimated and should be used with caution.
| # | Name | ||||||||
|---|---|---|---|---|---|---|---|---|---|
| () | (kpc) | (kpc) | (mag) | (mag) | (mag) | (mag) | |||
| 1 | IC 194 | 21.98 0.12 | 1.50 0.06 | 6.55 0.65 | 0.27 | 0.64 | 0.44 | 0.91 | 0.59 |
| 2 | 2MFGC 6306 | 20.71 0.10 | 1.25 0.04 | 3.95 0.21 | 0.09 | 1.12 | 0.45 | 0.38 | 0.52 |
| 3 | SPRC 192 | 20.69 0.10 | 3.36 0.10 | 4.84 0.51 | 0.45 | 0.68 | 0.28 | 1.09 | 0.76 |
| 4 | UGC 4591 | 21.22 0.01 | 1.25 0.01 | 3.25 0.04 | 0.0 | 0.55 | 0.29 | — | — |
| 5 | MCG +06-22-041 | 22.18 0.02 | 0.65 0.01 | 2.87 0.07 | 0.0 | 0.04 | -0.11 | — | — |
| 6 | NGC 3160 | 20.62 0.18 | 2.00 0.13 | 4.77 0.59 | 0.07 | 0.80 | 0.39 | 0.65 | 0.88 |
| 7 | UGC 5791 | 21.48 0.28 | 0.34 0.04 | 0.66 0.13 | 0.0 | 0.26 | 0.15 | — | — |
| 8 | NGC 3753 | 20.70 0.34 | 3.25 0.50 | 7.00 1.89 | 0.20 | 0.80 | 0.44 | 1.06 | 0.57 |
| 9 | UGC 6882 | 22.34 0.05 | 1.87 0.49 | 7.15 0.03 | 0.17 | 0.28 | 0.72 | 1.15 | 0.57 |
| 10 | SDSS J140639.64+272242.4 | 20.17 0.13 | 1.61 0.14 | 5.96 0.51 | 0.0 | 0.27 | 0.20 | — | — |
| 11 | SDSS J153538.63+464229.5 | 20.97 0.12 | 1.73 0.11 | 6.15 0.49 | 0.0 | 0.20 | -0.13 | — | — |
| 12 | UGC 10716 | 22.89 0.13 | 1.18 0.11 | 7.47 0.91 | 0.49 | 0.40 | 0.28 | 1.13 | 0.49 |
| 13 | UGC 12253 | 22.45 0.10 | 1.41 0.09 | 6.33 0.63 | 0.37 | 0.71 | 0.38 | 0.89 | 0.41 |
3.4 Analysis of warps
In order to describe the structure of optical warps, we apply the following general technique to each galaxy image.
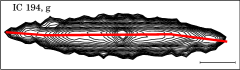
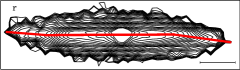
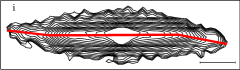
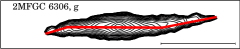
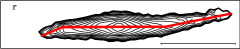
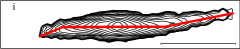
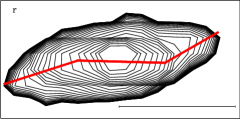
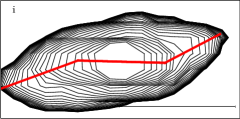
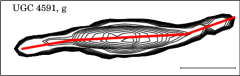
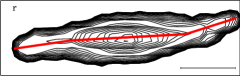
First, in each band we build an isophote map from 20.5 up to 25.5 mag/ level. (Due to complex morphology of 2MFGC 6306, we use isophotal level of 24.5 mag/ for it.) To plot the isophotes, we use the free astronomical application SAOImage DS9333http://ds9.si.edu/, with the smoothness factor of 5. We verified that this smoothing does not affect the geometry of the warps. Masked pixels are excluded from the analysis.
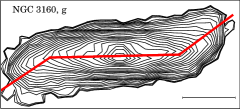
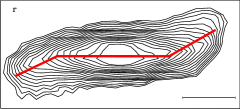
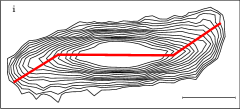
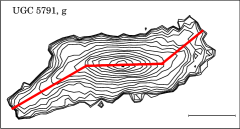
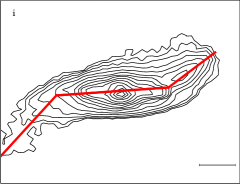
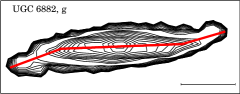
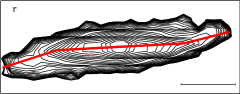
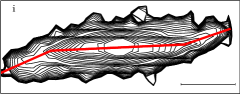
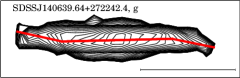
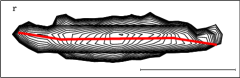
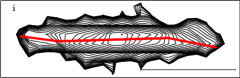
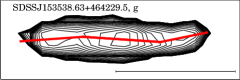
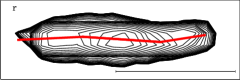
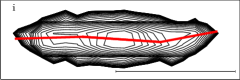
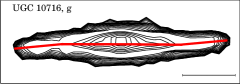
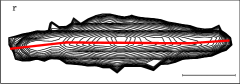
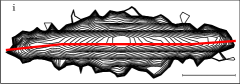
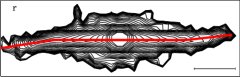
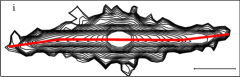
After that, we find the center-line for each isophote using the “skeletonization” process to obtain a skeletal remnant. This topological skeleton of the isophote is equidistant to its boundaries, and therefore determines the center-line of the isophote. For this purpose we use the scikit-image444http://scikit-image.org/ collection of algorithms for image processing. All center-lines are then averaged that results in the final center-line of the galaxy, which goes from the central region to its optical outskirts.
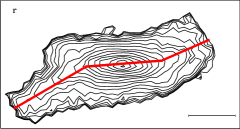
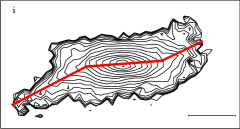
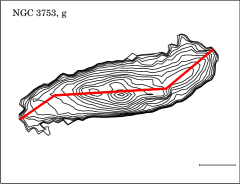
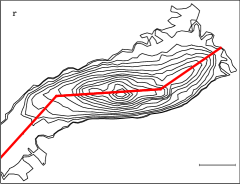
The found center-line then can be fitted with a piecewise linear function describing three different parts of the line: left (representing the left warp of the disc), middle part (the plane of the galaxy) and the right part (the right warp of the disc). As each segment has its own slope and intercept, we can obtain two points, where the warps begin (), and their orientation relative to the central segment. Here, we define the warp angle as an angle measured from the galaxy centre, between the plane (middle segment of our centre-line) and line from centre to tips of the outer 25.5 isophote (see Sánchez-Saavedra, Battaner & Florido, 1990, Reshetnikov & Combes, 1998). As warps are not always symmetric, we calculate the warp parameters on either side of each galaxy independently. Notice here that the measurement of the warp angle is independent of how well we horizontally aligned our galaxy.
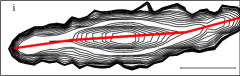
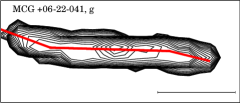
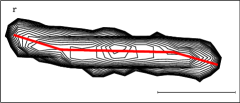
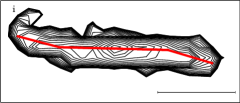
The results of the fitting are presented in Table 3 and in Fig. 2. In Fig. 2, the galaxies are oriented in such a way that their major axes are horizontal and the north part of the galaxies is up. Signs of warp angles in Table 3 are given as follows. For left (east) halves of the galaxy images, up-bending warps have positive angles, down-bending warps have negative values. For right (west) halves, on the contrary, up-bending has negative value and down-bending is described by positive warp angles.
| # | Galaxy | Band | ||||||
|---|---|---|---|---|---|---|---|---|
| () | () | (deg) | () | () | (deg) | |||
| North | South | |||||||
| 1 | IC 194 | g | 23.9 0.3 | 2.35 0.04 | -1.8 0.2 | 22.3 0.1 | 1.59 0.43 | 4.0 0.5 |
| r | 23.2 0.3 | 2.6 0.05 | -1.8 0.2 | 21.7 0.1 | 1.88 0.49 | 4.1 0.5 | ||
| i | 22.8 0.4 | 2.59 0.05 | -2.5 0.3 | 21.4 0.1 | 2.11 0.52 | 5.3 0.7 | ||
| 2 | 2MFGC 6306 | g | 22.7 0.2 | 2.91 0.12 | 6.2 0.6 | 22.6 0.2 | 2.35 0.24 | -4.6 0.5 |
| r | 21.9 0.1 | 3.4 0.14 | 7.5 0.5 | 21.9 0.1 | 2.98 0.28 | -6.3 0.4 | ||
| i | 21.7 0.2 | 3.84 0.14 | 7.2 0.5 | 21.3 0.1 | 2.68 0.29 | -6.2 0.5 | ||
| 3 | SPRC 192 | g | 21.7 0.2 | 1.65 0.36 | 5.8 2.7 | 21.9 0.4 | 1.75 0.02 | -15.9 1.7 |
| r | 21.0 0.2 | 1.95 0.41 | 9.8 2.4 | 21.4 0.4 | 2.06 0.01 | -13.2 1.8 | ||
| i | 20.7 0.2 | 2.04 0.42 | 13.9 2.7 | 20.9 0.3 | 2.15 0.0 | -14.2 1.6 | ||
| 4 | UGC 4591 | g | 22.7 0.3 | 2.03 0.09 | 2.1 0.4 | 22.9 0.1 | 2.7 0.56 | -6.1 0.6 |
| r | 22.3 0.2 | 2.48 0.14 | 1.5 0.5 | 22.4 0.1 | 3.29 0.72 | -5.4 1.0 | ||
| i | 21.9 0.1 | 2.71 0.16 | 1.4 0.6 | 22.2 0.1 | 3.61 0.79 | -5.5 1.1 | ||
| 5 | MCG +06-22-041 | g | 22.6 0.2 | 3.03 0.57 | -9.0 2.4 | 22.8 0.4 | 2.12 0.06 | 4.3 0.4 |
| r | 22.6 0.2 | 2.94 0.63 | -7.4 2.8 | 22.8 0.4 | 2.65 0.07 | 6.3 0.6 | ||
| i | 22.8 0.3 | 3.18 0.64 | -6.9 2.1 | 22.8 0.5 | 2.47 0.08 | 5.8 0.7 | ||
| 6 | NGC 3160 | g | 22.6 0.2 | 2.4 0.5 | 15.3 3.3 | 22.2 0.2 | 2.02 0.06 | -17.7 1.7 |
| r | 21.5 0.1 | 2.39 0.48 | 11.7 2.7 | 20.9 0.2 | 1.85 0.06 | -14.4 1.5 | ||
| i | 21.2 0.1 | 2.19 0.46 | 14.7 2.8 | 20.8 0.2 | 1.87 0.06 | -17.4 1.7 | ||
| 7 | UGC 5791 | g | 22.2 0.1 | 1.57 0.19 | 16.0 5.8 | 22.6 0.2 | 1.92 0.54 | -12.8 3.3 |
| r | 21.9 0.1 | 1.58 0.16 | 17.3 4.6 | 22.3 0.2 | 1.93 0.51 | -10.8 2.3 | ||
| i | 21.9 0.1 | 1.51 0.12 | 16.4 0.7 | 22.3 0.2 | 1.84 0.45 | -11.7 1.9 | ||
| 8 | NGC 3753 | g | 23.6 0.3 | 3.0 0.59 | 10.0 2.8 | 24.7 0.4 | 2.1 0.08 | -15.2 2.1 |
| r | 22.9 0.2 | 3.08 0.58 | 8.8 1.4 | 24.1 0.4 | 1.93 0.07 | -30.0 1.7 | ||
| i | 22.5 0.3 | 3.17 0.64 | 12.3 2.1 | 22.8 0.2 | 2.42 0.08 | -28.7 1.7 | ||
| 9 | UGC 6882 | g | 22.7 0.3 | 1.79 0.41 | 8.3 5.7 | 22.6 0.3 | 1.88 0.04 | -6.1 0.5 |
| r | 22.3 0.2 | 2.15 0.48 | 6.7 4.5 | 22.2 0.3 | 2.17 0.05 | -4.8 0.5 | ||
| i | 22.3 0.2 | 2.46 0.53 | 10.2 6.4 | 21.9 0.2 | 2.29 0.05 | -6.7 0.6 | ||
| 10 | SDSS J140639.64+272242.4 | g | 23.3 0.1 | 2.44 0.04 | -5.6 0.3 | 23.0 0.1 | 2.21 0.04 | 6.0 0.3 |
| r | 22.0 0.1 | 3.07 0.05 | -4.5 0.2 | 21.8 0.1 | 2.80 0.05 | 3.8 0.2 | ||
| i | 22.0 0.1 | 3.44 0.04 | -3.4 0.4 | 21.3 0.1 | 2.72 0.04 | 6.2 0.2 | ||
| 11 | SDSS J153538.63+464229.5 | g | 22.5 0.1 | 0.92 0.09 | 3.5 0.1 | 22.7 0.1 | 1.52 0.59 | -5.9 0.1 |
| r | 22.0 0.1 | 1.05 0.10 | 0.2 0.1 | 22.2 0.1 | 1.70 0.08 | -1.6 0.4 | ||
| i | 21.9 0.1 | 1.19 0.12 | 2.2 0.1 | 22.0 0.1 | 1.93 0.10 | -6.4 0.1 | ||
| 12 | UGC 10716 | g | 23.5 0.3 | 1.51 0.04 | 3.9 0.3 | 22.9 0.1 | 1.58 0.35 | -0.9 0.2 |
| r | 22.8 0.2 | 1.76 0.06 | 4.0 0.4 | 22.5 0.1 | 2.24 0.46 | -1.0 0.1 | ||
| i | 22.5 0.3 | 2.12 0.07 | 4.1 0.3 | 22.4 0.3 | 2.59 0.54 | -0.4 0.1 | ||
| 13 | UGC 12253 | g | 22.9 0.1 | 1.69 0.41 | 3.6 2.2 | 23.2 0.2 | 1.94 0.04 | -1.7 0.2 |
| r | 22.3 0.2 | 2.51 0.55 | 4.9 2.5 | 22.7 0.3 | 2.45 0.06 | -1.7 0.2 | ||
| i | 21.9 0.2 | 2.47 0.56 | 4.4 3.3 | 22.2 0.3 | 2.52 0.06 | -2.2 0.3 | ||
4 Spectroscopic observations and data reduction
The spectroscopic observations of our sample galaxies were carried out at the prime focus of the SAO RAS 6-m telescope with the multi-mode focal reducer SCORPIO-2 (Afanasiev & Moiseev, 2011), UGC 10716 was observed with the previous version of the focal reducer (SCORPIO, Afanasiev & Moiseev, 2005). In the long-slit mode both devices have the same slit size (6 arcmin 1 arcsec) with a scale of 0.36 arcsec per pixel. The exception was UGC 5791 observed with 0.7 arcsec slit width.
The spectral resolution was similar in all cases (FWHM about 5 Å), while SCORPIO-2 provides a twice broader spectral range than old SCORPIO. The log of spectral observation is given in Table 4. The slit position was chosen along the major axis of each galaxy. For several objects we used two slit positions – along the major axis and along the tips of apparent warp.
Data reduction was performed in a standard way using the IDL software package developed at the SAO RAS for reducing the data obtained with SCORPIO/SCORPIO-2. The brightest emission lines H and [NII] were fitted by Gaussian profiles in order to calculate the ionized gas velocities along the slit. The line-of-sight velocity distributions were then converted to the galaxy rotation curves (RCs) assuming a constant disc inclination .
| # | Galaxy | Slit PA | Date | Spectral range | Exp. time | Seeing |
|---|---|---|---|---|---|---|
| (deg) | (ÅÅ) | (s) | (′′) | |||
| 1 | IC 194 | 193 | 20.11.2014 | 3650–7250 | 2900 | 1.7 |
| 2 | 2MFGC 6306 | 164 | 10.10.2012 | 3650–7250 | 51200 | 2.1 |
| 3 | SPRC 192 | 98 | 10.10.2012 | 3650–7250 | 51200 | 2.3 |
| 110 | 08.12.2012 | 3650–7250 | 7900 | 2.9 | ||
| 4 | UGC 4591 | 14 | 14.12.2014 | 3650–7250 | 6900 | 1.0 |
| 5 | MCG +06-22-041 | 132 | 15.12.2014 | 3650–7250 | 7900 | 1.1 |
| 6 | NGC 3160 | 140 | 24.02.14 | 3650–7250 | 6900 | 1.3 |
| 150 | 15.12.2014 | 3650–7250 | 4900 | 1.1 | ||
| 7 | UGC 5791 | 60 | 10.12.2012 | 3600–8500 | 3900 | 2.9 |
| 8 | NGC 3753 | 107 | 06.03.2013 | 3650–7250 | 41200 | 1.8 |
| 125 | 06.03.2013 | 3650–7250 | 41200 | 3 | ||
| 9 | UGC 6882 | 120 | 12.12.2012 | 3650–7250 | 41200 | 1.1 |
| 130 | 12.12.2012 | 3650–7250 | 41200 | 1.2 | ||
| 10 | SDSS J140639.64+272242.4 | 140 | 07.03.2013 | 3650–7250 | 51200 | 1.9 |
| 11 | SDSS J153538.63+464229.5 | 74 | 07.03.2013 | 3650–7250 | 31200 | 1.5 |
| 12 | UGC 10716 | 12 | 12.07.2013 | 5700–7500 | 21200 | 1.4 |
| 13 | UGC 12253 | 144 | 15.12.2014 | 3650–7250 | 8900 | 1.7 |
5 Results and discussion
5.1 Photometric characteristics of galaxies
The mean characteristics of the sample galaxies – , , , – are typical for bright edge-on disc-dominated spirals (e.g. Bizyaev et al., 2014). As expected, bulges of our galaxies are redder than their discs: vs. and vs. .
The galaxies show notable radial colour gradients: and , where , , – scale lengths of the discs in the , and passbands respectively. Such gradients are usual for the discs of late-type spirals (e.g. Elmegreen & Elmegreen, 1984, de Grijs, 1998).
The average disc flattening for the sample is or, excluding four most inclined galaxies (SPRC-192, NGC 3753, UGC 6882 and SDSS J153538.63+464229.5 – see Table 1), ( passband). Both values are somewhat higher as compared to normal spirals of the same morphological types, luminosities and colours (Mosenkov et al., 2015) but, within the quoted scatter, the difference is not significant.
5.2 Kinematical characteristics of galaxies
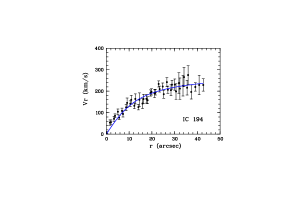
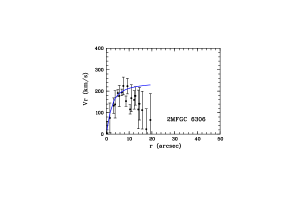
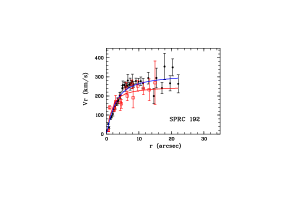
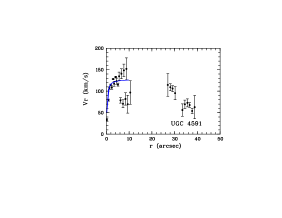
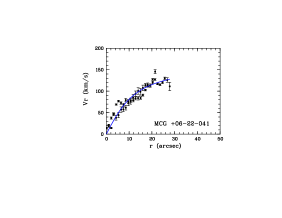
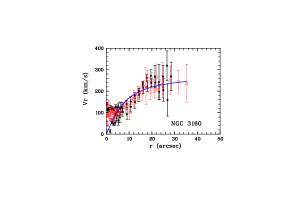
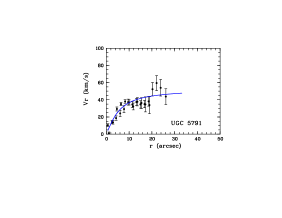
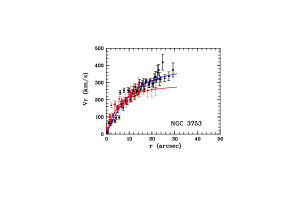
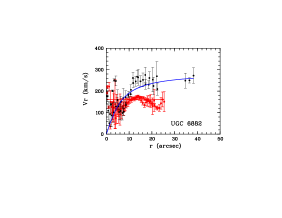
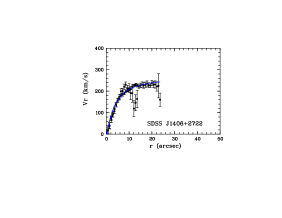
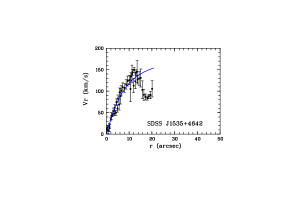
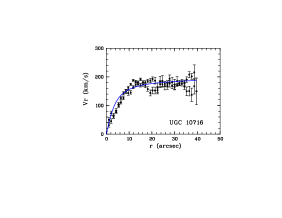
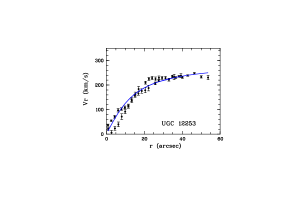
Fig. 3 presents rotation curves (RCs) of the galaxies averaged with respect to their dynamic centres. Optical RCs of edge-on galaxies are strongly suffered by internal absorption which changes their shapes (e.g. Bosma et al., 1992, Zasov & Khoperskov, 2003, Stepanova & Volkov, 2013). However, our RCs are sufficiently extended (mean extension of the curves is (0.80 0.19) , where is a semi-major axis of the galaxy, see Table 1) to estimate rotational velocities and to check the Tully-Fisher (TF) relation for the sample galaxies.
Following the standard practice, we have fitted RCs by the arctangent function (Courteau, 1997, Willick, 1999)
| (4) |
where is an asymptotic velocity and is a turnover radius where the rotation curve goes from rising to flat. (For two galaxies with apparently peculiar RCs – 2MFGC 6306 and UGC 4591 – we have used the observed velocities within in our calculations, for SDSS J153538.63+464229.5 we have took the data within . At larger radii, the spectrograph slit, probably, shifted away from the warped edge-on disc for these galaxies.)
The fitted value can significantly overestimate the true rotation velocity when the observed points do not reach the flat part of the rotation curve. In order to avoid this, the rotation speed at 2.2 disc scale lengths () is used in our work. To obtain , we find the value of the arctangent function at a distance of 2.2.
The results of our analysis are summarized in Table 5. For each galaxy the table gives fitted and values, as well as their uncertainties. The last column of Table 5 presents values corrected for the cosmological broadening.
| # | Galaxy | |||||
|---|---|---|---|---|---|---|
| (′′) | (′′) | (km/s) | (km/s) | (km/s) | ||
| 1 | IC 194 | 11.2 | 1.3 | 283 | 13 | 223 |
| 2 | 2MFGC 6306 | 2.2 | 1.1 | 247: | 30 | 202: |
| 3 | SPRC 192 (PA=110) | 2.7 | 0.3 | 318 | 10 | 239 |
| SPRC 192 (PA=278) | 1.6 | 0.3 | 252 | 13 | 210 | |
| 4 | UGC 4591 | 0.3 | 0.3 | 128: | 10 | 124: |
| 5 | MCG +06-22-041 | 10.2 | 1.6 | 165 | 10 | 87 |
| 6 | NGC 3160 | 7.4 | 0.8 | 282 | 14 | 220 |
| 7 | UGC 5791 | 5.3 | 1.3 | 53 | 5 | 45 |
| 8 | NGC 3753 (PA=107) | 9.4 | 0.8 | 433 | 16 | 326 |
| NGC 3753 (PA=125) | 4.6 | 0.6 | 302 | 14 | 260 | |
| 9 | UGC 6882 (PA=300) | - | - | 162: | 4 | 157: |
| UGC 6882 (PA=310) | 5.8 | 0.9 | 288 | 13 | 236 | |
| 10 | SDSS J140639.64+272242.4 | 3.7 | 0.3 | 270 | 8 | 188 |
| 11 | SDSS J153538.63+464229.5 | 7.0 | 0.9 | 194: | 15 | 113: |
| 12 | UGC 10716 | 3.5 | 0.4 | 198 | 4 | 175 |
| 13 | UGC 12253 | 12.5 | 1.1 | 293 | 6 | 210 |
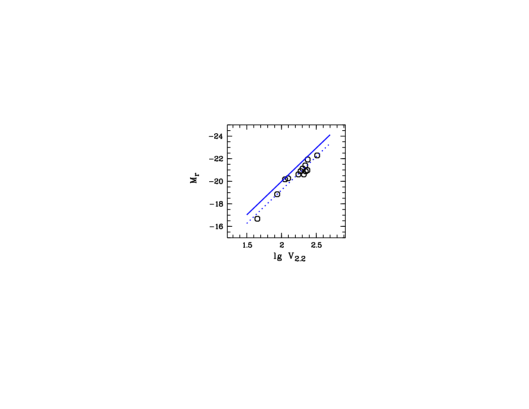
The Tully-Fisher relation for the sample galaxies is presented in Fig. 4. (For the galaxies with rotation curves obtained at two position angles, we use the larger value of .) As one can see, warped galaxies follow the relation for normal spirals in a wide range of luminosities. The slope of the TF for warped galaxies (–5.990.50) is consistent with the slope for usual spirals (–5.910.20 – see Pizagno et al., 2007). Some systematic shift of warped spirals towards fainter absolute magnitudes ( = 076) can be explained by the internal extinction taking place in edge-on spiral galaxies.
5.3 Characteristics of warps
Table 6 presents average characteristics of stellar disc warps in the three filters.
| North | South | All | |
|---|---|---|---|
| 22.840.60 | 22.800.67 | 22.820.62 | |
| 22.210.59 | 22.220.77 | 22.220.68 | |
| 22.010.60 | 21.870.67 | 21.940.63 | |
| 2.100.65 | 1.980.33 | 2.040.51 | |
| 2.380.67 | 2.300.49 | 2.340.58 | |
| 2.530.75 | 2.400.47 | 2.470.62 | |
| 7.04.6 | 7.85.6 | 7.45.0 | |
| 6.64.7 | 8.07.9 | 7.36.4 | |
| 7.75.2 | 9.07.5 | 8.36.4 |
Rows:
(1)–(3) average surface brightness where warp starts,
(4)–(6) average projected distance where warp begins (in units of scale length ),
(7)–(9) average warp angle in degrees
On average, warps start at a projected distance of 2.5 . There is a clear dependence of on a passband (Table 6), but this dependence just reflects the fact that the scale length depends on the colour. The scale lengths are larger in the filter (Sect. 5.1), therefore, values in units of blue scale lengths are smaller. As for values in absolute units (in arcseconds or in kpc), warps start from about the same projected distance in all three filters: average ratio of the projected distances in the and passbands is 1.000.09, in the and passbands – 0.990.07.
Projected starting points of stellar warps vary among different sources. For example, de Grijs (1997) gives in the filter. Ann & Park (2006) studied 325 edge-on galaxies from the Digitized Sky Survey (DSS) and found that , where is the semi-major axis of the mag/ isophote. For the standard exponential disc (Freeman, 1970) with the central surface brightness in the filter of mag/ this result transforms into . For ten galaxies observed in the Spitzer/IRAC 4.5-m band, the mean warp radius is (4.11.0) (Saha, de Jong & Holwerda, 2009). Since the disc scale length decreases with wavelength (see e.g. de Grijs, 1998; Xilouris et al., 1999), the last estimate of is in general agreement with the values obtained in optical filters.
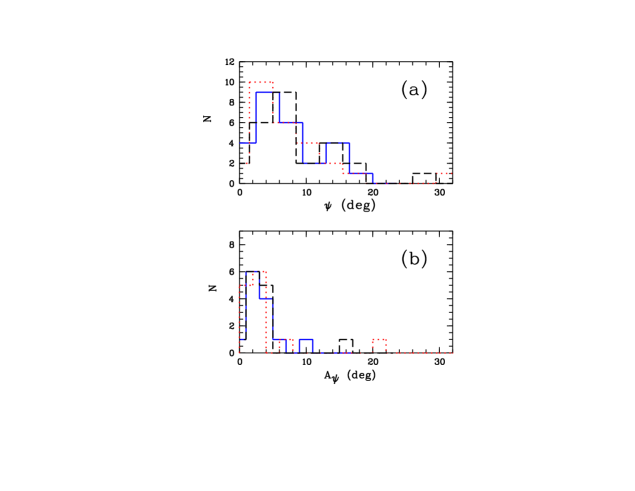
Fig. 5a shows the observed distribution of warp angles in the north and south sides of galaxies ( and together). As one can see, the warp angles have a relatively wide distribution which extends to . Average values of (see Table 6) are large in comparison with the typical values for spiral galaxies (e.g. Sánchez-Saavedra, Battaner & Florido, 1990, Reshetnikov & Combes, 1998, Ann & Park, 2006). Apparently, this can be regarded a consequence of the selection effect, since our sample includes galaxies with perceptible warps only.
There is a tendency for stronger warps to start from a closer distance to the center. This tendency is almost absent in the band but quite pronounced in the and filters. For instance, the mean projected starting point of warp for the galaxies with the mean warp angle is (2.450.57) , but for this value is (2.100.31) . The same values in the -band: for and for . Probably, the dependence in the filter does not appear due to the influence of the dust extinction on the observable structure of edge-on galaxies.
If we exclude two galaxies in which spiral arms can mimick warps (UGC 6882 and SDSS J153538.63+464229.5), the effect becomes stronger:
vs.
( and ,
respectively)
and
vs.
( and ,
respectively).
The data presented in Table 6 clearly show that warps measured within the certain isophotes are asymmetric for all galaxies in the sample (partially this may be explained again by the presence of dust lanes). To quantify the observed asymmetry, we used different asymmetry indexes (see García-Ruiz, Sancisi & Kuijken, 2002, Castro-Rodríguez et al., 2002, Saha, de Jong & Holwerda, 2009). First two indexes provide asymmetry as the difference of and values in two sides of galaxies (both values of must be positive, regardless of the sign in Table 3):
(in degrees),
(in units of scale length ).
Two other indexes give dimensionless measure of warp (both
values of are taken positive):
and .
| 3.32.4 | 4.05.4 | 3.84.0 | |
| 0.450.30 | 0.450.32 | 0.530.33 | |
| 0.280.18 | 0.330.24 | 0.300.29 | |
| 0.110.07 | 0.100.08 | 0.110.06 |
Rows:
(1)–(2) absolute asymmetries of warp ( in degrees, in units
of scale length ),
(3)–(4) relative warp asymmetries.
Table 7 presents average values of the warp asymmetries. As can be seen in the table, typical asymmetries reach several degrees in (see also Fig. 5) and about 50 per cent of the exponential scale length in .
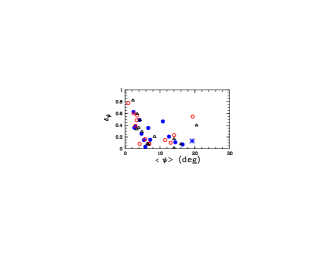
Fig. 6 shows dependence of the relative asymmetry on the average warp angle. As one can see, for larger mean warp angles we have less relative asymmetry (Fig. 6). This anti-correlation was noted earlier by Castro-Rodríguez et al. (2002) (see fig. 1i in their work). Most likely, this dependence does not have physical sense and just reflects the definition of : assuming that is restricted within the narrow region, we can expect that . (In fact, for most galaxies – see Fig. 5b.)
5.4 Dark haloes and optical warps
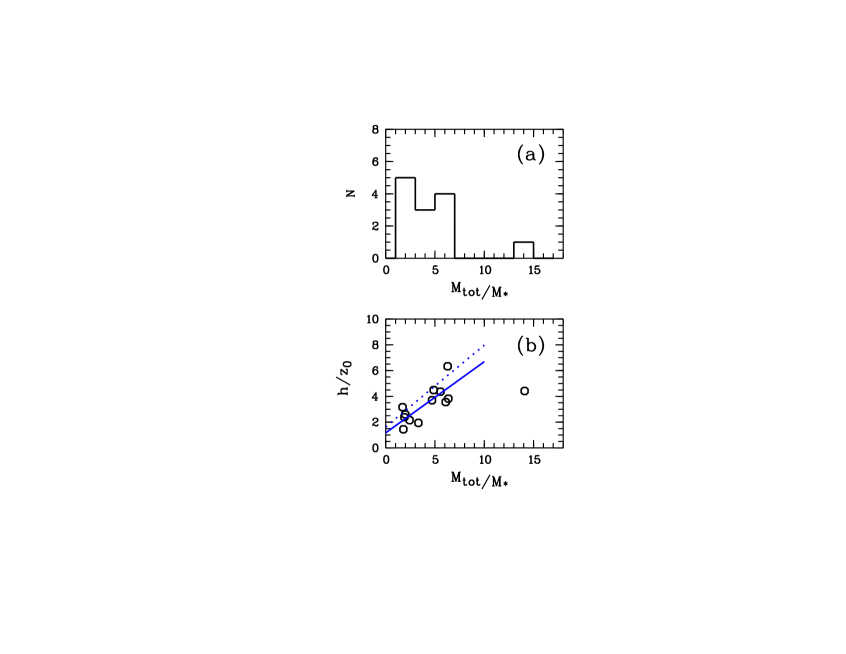
According to most theoretical models, dark haloes play a significant or even decisive role in the fate of warps. In order to verify the effect of dark halo, we calculate the ratio of the dynamical mass of our galaxies to their stellar mass. The dynamical mass is defined as the total mass enclosed within the sphere of radius : M. The stellar mass was estimated according to Bell et al. (2003) using the colours and band luminosities of galaxies. The total (dynamical) mass includes the stellar mass of the galaxy (M∗) and the dark halo (Mh). Therefore, Mtot/M∗ = (Mh + M∗)/M∗ = Mh/M∗ + 1.
Most of the galaxies in the sample (12 of 13) show the Mtot/M∗ ratio in the range from 1.7 to 6.4 (Fig. 7a) with the mean value Mtot/M. These values are in agreement with what was obtained by Mosenkov et al. (2010) for the sample of edge-on spirals with photometry (see fig. 13a in their work). (MCG +06-22-041 is the most dark-matter dominated galaxy in the sample with Mtot/M. Rotation curve of this galaxy steeply rises up to the last observational point (Fig. 3). Also, MCG +06-22-041 has unusually blue optical colours – see Table 1.) Fig. 7b illustrates that the sample galaxies follow a trend for the disc flattening with the relative contribution of the dark halo – more dark-dominated galaxies are, on average, thinner (e.g. Zasov et al., 2002).
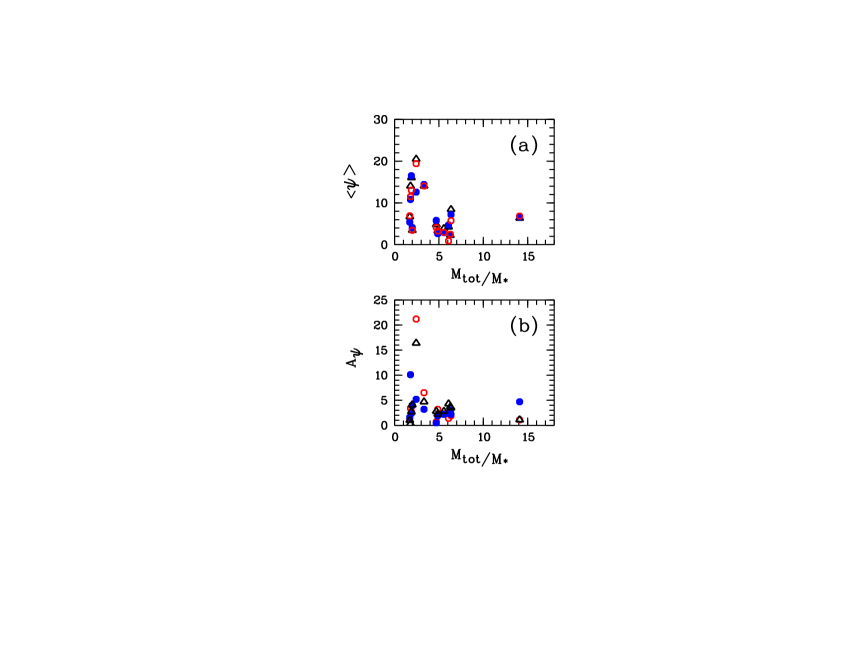
We have investigated possible correlations of the warp parameters with Mtot/M∗ ratio. The most promising trends we found are shown in Fig. 8a,b. As one can see that the mean warp angle and the warp asymmetry both decrease with the rise of the dark halo contribution. Large and strongly asymmetric warps are more common among galaxies with relatively less massive haloes. (Several related correlations were presented in Castro-Rodríguez et al., 2002.)
6 Conclusions
We have performed detailed photometric and kinematic study of the 13 edge-on spiral galaxies with warped stellar discs. The galaxies were selected solely on the basis of their optical morphology and, therefore, they are a priori with notable integral-shape warp. As it turned out, most of them reside in dense spatial environments – in pairs, groups, clusters – and, hence, tidal interaction (current or past) with companions may be possible mechanism for the origin of stellar warps in our sample.
Our main conclusions are as follows:
(i) The sample galaxies demonstrate wide distribution of the warp angles , with maximum values of (Fig. 5a).
(ii) On average, stellar warps start at a projected distances of (2–3) , i.e. near or just beyond the maximum of the rotation curve of a self-gravitating exponential disc (Table 6).
(iii) Stronger warps have on average a smaller projected starting point (Sect. 5.3).
(iv) Warps show notable asymmetry in all the sample galaxies. Typically, asymmetry reaches several degrees in , about 50 per cent of the exponential scale length in , and about 0.5 mag in (Tables 3 and 7).
(v) Apparently, as the dark halo becomes more and more massive compared to the stellar disc, it prevents the formation of very strong and asymmetric warps (Fig. 8).
In order to investigate the formation of stellar warps, Kim et al. (2014) recently presented a set of -body simulations of fly-by encounters between galaxies. They have found that fly-bys can excite integral-shape warps in galaxies, and such induced warps can survive for a few billion years. In Kim et al. (2014) simulations, the maximum warp angle reaches about 25o, and warps are often non-symmetric. These results are quite consistent with our observational data. Significant asymmetry of the projected starting points of warps (Sect. 5.3) could probably arise due to the underlying asymmetry in the dark halo potential (Saha, de Jong & Holwerda, 2009), which could be induced by the galaxy-galaxy interactions.
Our results are based on a small sample of galaxies, and they can only be regarded as preliminary. Also, these results can be biased due to the misidentification of strongly inclined spirals as warped stellar discs. Reshetnikov & Combes (1998) simulated this projection effect and found that no more than 15% of integral-shaped warps could actually be spiral arms. Careful study of the sample galaxies showed that, with a certain probability, in 2 of 13 galaxies the global warp can be explained as inclined spiral arms (these galaxies are UGC 6882 and SDSS J153538.63+464229.5). Thus, the fraction of possible false warps in the sample is in general agreement with the Reshetnikov & Combes (1998) results. We verified the position of the studied characteristics of these two galaxies in our figures and found that they do not bias our conclusions.
A further extended studies of warped galaxies in different spatial environments will help us to better understand this common but still puzzling phenomenon.
Acknowledgments
The observations at the 6-meter BTA telescope were carried out with the financial support of the Ministry of Education and Science of the Russian Federation (agreement No. 14.619.21.0004, project ID RFMEFI61914X0004). This work was partly supported by the Russian Foundation for Basic Researches (grant number 14-02-810). Aleksandr Mosenkov is a beneficiary of a mobility grant from the Belgian Federal Science Policy Office. Alexei Moiseev is grateful for the financial support a grant from the President of the Russian Federation (MD-3623.2015.2). We thank Sergey Dodonov, Dmitri Oparin, Roman Uklein and Oleg Egorov, who performed the significant part of SCORPIO/SCORPIO-2 observations and especially Victor Afanisiev for his great contribution to spectroscopy at the 6-m telescope. Also we thank Tatiana Briukhareva for her help in spectral data reduction. We are thankful to the referee for useful comments.
Funding for the SDSS has been provided by the Alfred P. Sloan Foundation, the Participating Institutions, the National Science Foundation, the U.S. Department of Energy, the National Aeronautics and Space Administration, the Japanese Monbukagakusho, the Max Planck Society, and the Higher Education Funding Council for England. The SDSS Web Site is http://www.sdss.org/.
We acknowledge the usage of the HyperLeda database. This research has made use of the NASA/IPAC Extragalactic Database (NED) which is operated by the Jet Propulsion Laboratory, California Institute of Technology, under contract with the National Aeronautics and Space Administration.
References
- Afanasiev & Moiseev (2005) Afanasiev V. L., Moiseev A. V., 2005, Astron. Lett., 31, 194
- Afanasiev & Moiseev (2011) Afanasiev V. L., Moiseev A. V., 2011, Baltic Astron., 20, 363
- Alam et al. (2015) Alam S., Albareti F.D., Allende Prieto C. et al., 2015, ApJS, 219, 12
- Ann (2007) Ann H.B., 2007, JKAS, 40, 9
- Ann & Park (2006) Ann H.B., Park J.-C., 2006, New Astronomy, 11, 293
- Battaner et al. (1990) Battaner E., Florido E., Sanchez-Saavedra M.L., 1990, A&A, 236, 1
- Bell et al. (2003) Bell E.F., McIntosh D.H., Katz N., Weinberg M.D., 2003, ApJS, 149, 289
- Berlind et al. (2006) Berlind A.A., Frieman J., Weinberg D.H. et al., 2006, ApJS, 167, 1
- Bertin & Arnouts (1996) Bertin E., Arnouts S., 1996, A&AS, 117, 393
- Binney (1992) Binney J., 1992, ARA&A, 30, 51
- Bizyaev et al. (2014) Bizyaev D.V., Kautsch S.J., Mosenkov A.V. et al., 2014, ApJ, 787, 24
- Bosma (1981) Bosma A., 1981, AJ, 86, 1825
- Bosma et al. (1992) Bosma A., Byun Y., Freeman K.C., Athanassoula E., 1992, ApJ, 400, L21
- Briggs (1990) Briggs F.H., 1990, ApJ, 352, 15
- Bureau et al. (2006) Bureau, M., Aronica, G., Athanassoula, E., et al. 2006, MNRAS, 370, 753
- (16) Caon N., Capaccioli M., D’Onofrio M., 1993, MNRAS, 265, 1013
- Castro-Rodríguez et al. (2002) Castro-Rodríguez N., López-Corredoira M., Sánchez-Saavedra M.L., Battaner E., 2002, A&A, 391, 519
- Chilingarian & Zolotukhin (2012) Chilingarian I.V., Zolotukhin I.Y., 2012, MNRAS, 419, 1727
- Courteau (1997) Courteau S., 1997, AJ, 114, 2402
- De Geyter et al. (2013) De Geyter G., Baes M., Fritz J., Camps P., 2013, A&A, 550, A74
- De Geyter et al. (2014) De Geyter G., Baes M., Camps P. et al., 2014, MNRAS, 441, 869
- de Grijs (1997) de Grijs R., 1997, Edge-on Disk Galaxies – A Structure Analysis in the Optical and Near-Infrared, PhD thesis, Univ. Groningen, The Netherlands
- de Grijs (1998) de Grijs R., 1998, MNRAS, 299, 595
- de Souza, Gadotti & dos Anjos (2004) de Souza R.E., Gadotti D.A., dos Anjos S., 2004, ApJS, 153, 411
- Dubinski & Kuijken (1995) Dubinski J., Kuijken K., 1995, ApJ, 442, 492
- Elmegreen & Elmegreen (1984) Elmegreen D.M., Elmegreen B.G., 1984, ApJS, 54, 127
- Erwin (2015) Erwin, P. 2015, ApJ, 799, 226
- Florido et al. (1991) Florido F., Prieto M., Battaner E., Mediavilla F., Sanchez-Saavedra M.I., 1991, A&A, 242, 301
- Freeman (1970) Freeman K.C., 1970, ApJ, 160, 811
- García-Ruiz, Sancisi & Kuijken (2002) García-Ruiz I., Sancisi R., Kuijken K., 2002, A&A, 394, 769
- Goldberg (1989) Goldberg D.E., 1989, Genetic Algorithms in Search, Optimization, and Machine Learning (Reading, MA: Addison-Wesley)
- Guijarro et al. (2010) Guijarro A., Peletier R.F., Battaner E. et al., 2010, A&A, 519, A53
- Hickson (1982) Hickson P., 1982, ApJ, 255, 382
- Huang & Carlberg (1997) Huang S., Carlberg R.G., 1997, ApJ, 480, 503
- Innanen et al. (1982) Innanen K.A., Kamper K.W., Papp K.A., van den Bergh S., 1982, A&A, 254, 515
- Kautsch et al. (2006) Kautsch S.J., Grebel E.K., Barazza, F.D., Gallagher J.S., 2006, A&A, 445, 765
- Kemp & Meaburn (1993) Kemp S.N., Meaburn J., 1993, A&A, 274, 19
- Kim et al. (2014) Kim J.H., Peirani S., Kim S. et al., 2014, ApJ, 789, id.90
- Kuijken & Garcia-Ruiz (2001) Kuijken K., Garcia-Ruiz I., 2001, ASP Conference Series, 230, 401
- Lintott et al. (2008) Lintott C.J., Schawinski K., Slosar A. et al., 2008, MNRAS, 389, 1179
- Lintott et al. (2011) Lintott C., Schawinski K., Bamford S. et al., 2011, MNRAS, 410, 166
- Mitronova et al. (2004) Mitronova S.N., Karachentsev I.D., Karachentseva V.E., Jarrett T.H., Kudrya Y.N., 2004, Bulletin of the Special Astrophysics Observatory, 57, 5
- Moiseev et al. (2011) Moiseev A.V., Smirnova K.I., Smirnova A.A., Reshetnikov V.P., 2011, MNRAS, 418, 244
- Mosenkov et al. (2010) Mosenkov A.V., Sotnikova N.Ya., Reshetnikov V.P., 2010, MNRAS, 401, 559
- Mosenkov (2014) Mosenkov A.V., 2014, Astrophysical Bulletin, 69, 99
- Mosenkov et al. (2015) Mosenkov A.V., Sotnikova N.Y., Reshetnikov V.P., Bizyaev D.V., Kautsch S.J., 2015, MNRAS, 451, 2376
- Olsen & Salyk (2002) Olsen K.A.G., Salyk C., 2002, AJ, 124, 2045
- Peng et al. (2010) Peng Ch.Y., Ho L.C., Impey Ch.D., Rix H.-W., 2010, AJ, 139, 2097
- Patterson (1940) Patterson F.S., 1940, Harvard Bull. No.914, 9
- Pizagno et al. (2007) Pizagno J., Prada F., Weinberg D.H. et al., 2007, AJ, 134, 945
- Peterson (1979) Peterson S.D., 1979, ApJS, 40, 527
- Reed (1996) Reed B.C., 1996, AJ, 111, 804
- Reshetnikov (1989) Reshetnikov V., 1989, Astrophysics, 30, 359
- Reshetnikov & Combes (1998) Reshetnikov V., Combes F., 1998, A&A, 337, 9
- Reshetnikov & Combes (1999) Reshetnikov V., Combes F., 1999, A&AS, 138, 101
- Reshetnikov et al. (2002) Reshetnikov V., Battaner E., Combes F., Jiménez-Vicente J., 2002, A&A, 382, 513
- Revaz & Pfenniger (2001) Revaz Y., Pfenniger D., 2001, ASP Conference Series, 240, 278
- Roškar et al. (2010) Roškar R., Debattista V.P., Brooks A.M. et al., 2010, MNRAS, 408, 783
- Saha, de Jong & Holwerda (2009) Saha K., de Jong R., Holwerda B., 2009, MNRAS, 396, 409
- Sánchez-Saavedra, Battaner & Florido (1990) Sánchez-Saavedra M.L., Battaner E., Florido E., 1990, MNRAS, 246, 458
- Sánchez-Saavedra et al. (2003) Sánchez-Saavedra M.L., Battaner E., Guijarro A., López-Corredoira M., Castro-Rodríguez N., 2003, A&A, 399, 457
- Sancisi (1976) Sancisi R., 1976, A&A, 53, 159
- Sandage & Humphreys (1980) Sandage A., Humphreys R.M., 1980, ApJ, 236, L1
- Sasaki (1987) Sasaki T., 1987, PASJ, 39, 849
- Schlafly & Finkbeiner (2011) Schlafly E.F., Finkbeiner D.P., 2011, ApJ, 737, 103
- Schwarzkopf & Dettmar (2001) Schwarzkopf U., Dettmar R.-J. , 2001, A&A, 373, 402
- Sellwood (2013) Sellwood J.A., 2013, Planets, Stars and Stellar Systems, 5, 923
- Sérsic (1968) Sérsic J.L., 1968, Atlas de Galaxias Australes, Observatorio Astronomico, Cordoba
- Simard et al. (2002) Simard L., Willmer C.N.A., Vogt N.P. et al., 2002, ApJS, 142, 1
- Sheth et al. (2010) Sheth K. et al., 2010, PASP, 122, 1397
- Sparke & Casertano (1988) Sparke L.S., Casertano S., 1988, MNRAS, 234, 873
- Spitzer (1942) Spitzer L., 1942, ApJ, 95, 325
- Stepanova & Volkov (2013) Stepanova K.V., Volkov E.V., 2013, Astronomy Letters, 39, 405
- Toomre (1983) Toomre A., 1983, in Internal kinematics and dynamics of galaxies, Proceedings of the Symposium, 177
- Trasarti-Battistoni (1998) Trasarti-Battistoni R., 1998, A&AS, 130, 341
- van der Kruit (2007) van der Kruit P.C., 2007, A&A, 466, 883
- van der Kruit & Searle (1981a) van der Kruit P.C., Searle L., 1981a, A&A, 95, 105
- van der Kruit & Searle (1981b) van der Kruit P.C., Searle L., 1981b, A&A, 95, 116
- van der Kruit & Searle (1982a) van der Kruit P.C., Searle L., 1982a, A&A, 110, 61
- van der Kruit & Searle (1982b) van der Kruit P.C., Searle L., 1982b, A&A, 110, 79
- White et al. (1999) White R.A., Bliton M., Bhavsar S.P. et al., 1999, AJ, 118, 2014
- Willick (1999) Willick J.A., 1999, ApJ, 516, 47
- Xilouris et al. (1999) Xilouris, E. M., Byun, Y. I., Kylafis, N. D., Paleologou, E. V., Papamastorakis, J. 1999, A&A, 344, 868
- Zasov et al. (2002) Zasov A.V., Bizyaev D.V., Makarov D.I., Tyurina N.V., 2002, Astronomy Letters, 28, 527
- Zasov & Khoperskov (2003) Zasov A.V., Khoperskov A.V., 2003, Astronomy Letters, 29, 437