SMA observations towards the compact, short-lived bipolar water maser outflow in the LkH 234 region
Abstract
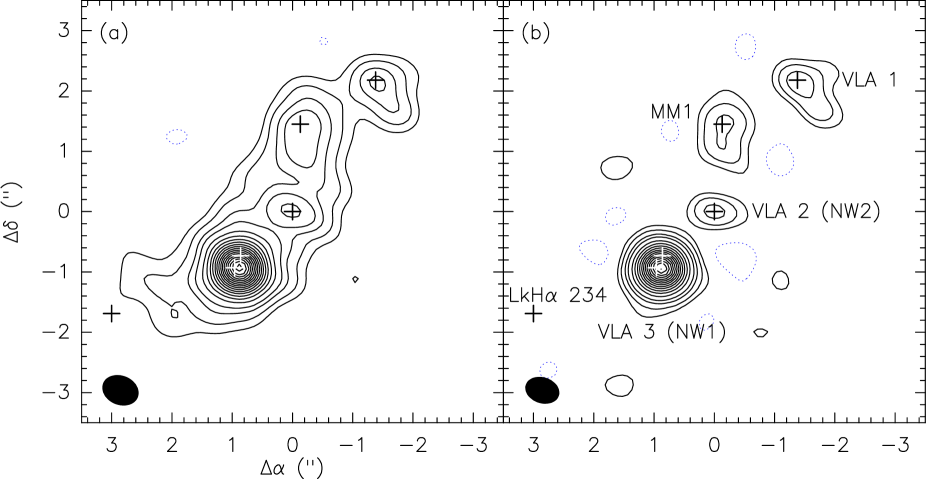
We present Submillimeter Array (SMA) 1.35 mm subarcsecond angular resolution observations toward the LkH 234 intermediate-mass star-forming region. The dust emission arises from a filamentary structure of 5 arcsec (4500 au) enclosing VLA 1-3 and MM 1, perpendicular to the different outflows detected in the region. The most evolved objects are located at the southeastern edge of the dust filamentary structure and the youngest ones at the northeastern edge. The circumstellar structures around VLA 1, VLA 3, and MM 1 have radii between 200 and 375 au and masses in the 0.08–0.3 M range. The 1.35 mm emission of VLA 2 arises from an unresolved (r au) circumstellar disk with a mass of 0.02 M. This source is powering a compact (4000 au), low radial velocity (7 km s) SiO bipolar outflow, close to the plane of the sky. We conclude that this outflow is the “large-scale” counterpart of the short-lived, episodic, bipolar outflow observed through HO masers at much smaller scales (180 au), and that has been created by the accumulation of the ejection of several episodic collimated events of material. The circumstellar gas around VLA 2 and VLA 3 is hot (130 K) and exhibits velocity gradients that could trace rotation. There is a bridge of warm and dense molecular gas connecting VLA 2 and VLA 3. We discuss the possibility that this bridge could trace a stream of gas between VLA 3 and VLA 2, increasing the accretion rate onto VLA 2 to explain why this source has
an important outflow activity.
keywords:
masers – stars: formation – ISM: individual objects: LkH 234-VLA 2 – ISM: jets and outflows – ISM: molecules1 Introduction
Accretion disks and mass-loss processes with the presence of magnetic fields govern the formation of low-mass stars (e.g. mac08; fra14; rao14). These mass-loss processes are non-steady, presenting pulsed events that are probably related to episodic increases in the accretion rates (e.g. re01; pec10; aud14). In the case of high-mass protostars, there is increasing evidence that the associated outflows are also non-steady. This is seen, in particular, with the detection through Very Long Baseline Interferometry (VLBI) HO maser observations of short-lived (tens of years), episodic outflow events, which are interpreted as due to variability in the accretion processes as in the case of low-mass protostars (e.g. tor01; san12; tri13; car15).
| (J2000) | (J2000) | Deconvolved Size | ||||||
|---|---|---|---|---|---|---|---|---|
| Major axis, Minor axis | P.A. | |||||||
| Source | () | () | (mJy) | (arcsecarcsec) | () | (M) | ( cm) | ( cm) |
| VLA 3 | 6.461 | 55.00 | 1393 | 0.440.020.260.02 | 12 | 0.25 | ||
| VLA 2 | 6.321 | 55.95 | 121 | 0.3 | 0.023 | |||
| MM 1 | 6.292 | 57.26 | 242 | 0.830.150.240.15 | 10 | 0.09–0.29 | (3–9) | (1–4) |
| VLA 1 | 6.084 | 58.06 | 222 | 0.740.150.230.11 | 3512 | 0.08–0.26 | (3–10) | (1–4) |
Obtained by fitting a Gaussian with the CASA imfit task to each source in the image from Fig. 1b. The major and minor axis are the full width at half maximum values of the deconvolved size.
Mass estimated from the dust emission assuming: optically thin emission, a gas to dust ratio of 100, a dust opacity per unit of dust mass of 1.1 cm/g for VLA 2–3 and 0.9 cmg for MM 1 and VLA 1, which are the computed values by Ossenkopf94 at the observed wavelength and for dust particles with thin and thick ices, respectively. See Section 3.1 for the value of temperature used for each source.
The source appears to be unresolved. The Gaussian fit yields an uncertainty for the major axis of arcsec. We adopt an upper limit which is three times this uncertainty (i.e., at 3- level).