The XXL Survey: IX. Optical overdensity and radio continuum analysis of a supercluster at ††thanks: The full catalogue is available as a queryable database table XXL_VLA_15 via the XXL Master Catalogue browser http://cosmosdb.iasf-milano.inaf.it/XXL. A copy of the catalogue and the mosaic are is also available at the CDS via anonymous ftp to cdsarc.u-strasbg.fr (130.79.128.5).
We present observations with the Karl G. Jansky Very Large Array (VLA) at 3 GHz (10 cm) toward a sub-field of the XXL-North 25 deg2 field targeting the first supercluster discovered in the XXL Survey. The structure has been found at a spectroscopic redshift of 0.43 and extending over on the sky. The aim of this paper is twofold. First, we present the 3 GHz VLA radio continuum observations, the final radio mosaic and radio source catalogue, and, second, we perform a detailed analysis of the supercluster in the optical and radio regimes using photometric redshifts from the CFHTLS survey and our new VLA-XXL data. Our final 3 GHz radio mosaic has a resolution of , and encompasses an area of with rms noise level lower than Jy beam-1. The noise in the central region is Jy beam-1. From the mosaic we extract a catalogue of 155 radio sources with signal-to-noise ratio (S/N), eight of which are large, multicomponent sources, and 123 () of which can be associated with optical sources in the CFHTLS W1 catalogue. Applying Voronoi tessellation analysis (VTA) in the area around the X-ray identified supercluster using photometric redshifts from the CFHTLS survey we identify a total of seventeen overdensities at , 7 of which are associated with clusters detected in the XMM-Newton XXL data. We find a mean photometric redshift of 0.43 for our overdensities, consistent with the spectroscopic redshifts of the brightest cluster galaxies of seven X-ray detected clusters. The full VTA-identified structure extends over on the sky, which corresponds to a physical size of Mpc2 at . No large radio galaxies are present within the overdensities, and we associate eight (S/N) radio sources with potential group/cluster member galaxies. The spatial distribution of the red and blue VTA-identified potential group member galaxies, selected by their observed colours, suggests that the clusters are not virialised yet, but are dynamically young, as expected for hierarchical structure growth in a CDM universe. Further spectroscopic data are required to analyse the dynamical state of the groups.
Key Words.:
Astronomical databases: catalogues - Galaxies: clusters: general - Galaxies: groups: general - Radio continuum: galaxies - Radio continuum: general1 Introduction
Over the last decade, deeper insights into various physical properties of galaxies, their formation and their evolution through cosmic time have been gained by sensitive, multiwavelength surveys such as GOODS (Dickinson et al., 2003), COSMOS (Scoville et al., 2007), GAMA (Driver et al. 2009, 2011) and CANDELS (Koekemoer et al. 2011; Grogin et al. 2011). The XXL111http://irfu.cea.fr/xxl is a panchromatic survey (X-ray to radio) of two regions on the sky, each 25 deg2 in size. Constraining the time evolution of the Dark Energy equation of state using galaxy clusters is the main goal of the XXL project. In a deep (6 Ms) XMM-Newton222http://xmm.esac.esa.int/ survey to a depth of in the [0.5-2] keV band several hundred galaxy cluster detections () were made over the 50 deg2 (Pierre et al., 2015) (hereafter Pierre et al. (2015)). The XXL South region (XXL-S) is located in the southern hemisphere in the Blanco Cosmology Survey (BCS) field333http://www.usm.uni-muenchen.de/BCS/ and the XXL North region (XXL-N) near the celestial equator encompasses the smaller XMM Large Scale Structure Survey (XMM-LSS)444http://wela.astro.ulg.ac.be/themes/spatial/xmm/LSS/ field. Multiwavelength photometric data ( in AB mag) from the UV/optical to the IR drawn from GALEX, Canada-France-Hawaii Telescope Legacy Survey (CFHTLS), BCS, Sloan Digital Sky Survey (SDSS)555http://www.sdss.org/, the Two Micron All Sky Survey (2MASS)666http://www.ipac.caltech.edu/2mass/, Spitzer Space Telescope777http://ssc.spitzer.caltech.edu/, and Wide-field Infrared Survey Explorer (WISE)888http://wise.ssl.berkeley.edu/ already exist over almost the full area (Pierre et al. (2015)). Even deeper observations are available over smaller areas (Pierre et al. (2015)), and will be conducted over the full area with the DECam999http://www.darkenergysurvey.org/DECam/camera.shtml to magnitude in griz bands, and in bands with Hyper-SuprimeCam101010http://www.naoj.org/Projects/HSC/. Photometric redshifts are expected to reach accuracies better than %, sufficient for large-scale structure studies out to intermediate redshift (z), and for evolutionary studies of galaxies and AGN to . More than 15,000 optical spectra are already available (see Pierre et al. (2015)).
To complement the multiwavelength coverage of the field, we present new radio observations with the Karl G. Jansky Very Large Array (VLA) at 3 GHz over a subarea of the XXL-N field. These observations target the first supercluster discovered in the XXL survey by Pompei et al. (hereafter Pompei et al. (2015)). One cluster within this large structure was previously identified at using photometric redshifts in the CFHTLS wide field by Durret et al. (2011). The XMM-Newton XXL observations revealed six X-ray clusters within as described in Pierre et al. (2015), see also Pacaud et al. (2015) (hereafter Pacaud et al. (2015)). Based on further spectroscopic observations of the brightest cluster galaxies by Koulouridis et al. (2015) (hereafter Koulouridis et al. (2015)), Pompei et al. (2015) reports the redshift of the structure of . The structure, thus, has a physical extent of Mpc2 () . Here we present a detailed analysis of this structure based on the CFHTLS optical data and our new VLA radio data.
Throughout this paper we use cosmological parameters in accordance with the Wilkinson Microwave Anisotropy Probe satellite final data release (WMAP9) combined with a set of baryon acoustic oscillation measurements and constraints on from Cepheids and type Ia supernovae (Hinshaw et al., 2013). These parameters are , and . All sizes given in this paper are physical. All magnitudes are in the AB magnitude system, and all coordinates in J2000 epoch.
2 Data
2.1 Optical data
We use the photometric redshift catalogues from the CFHTLS111111http://www.cfht.hawaii.edu/Science/CFHTLS/. The CFHTLS Wide survey is divided into fields W1, W2, W3 and W4 covered by the *, ’, ’, ’, ’, and ’ bands with an 80% completeness limit in AB magnitudes for point sources of *=25.2, ’=25.5, ’=25.0, ’=24.8 and ’=23.9. The XXL-N field lies within the CFHTLS W1 field. The photometric redshift accuracy in this field is at , at , where is the difference between photometric and spectroscopic redshift as described in Ilbert et al. (2006) and Coupon et al. (2009) (see also catalogue documentation)121212http://cesam.lam.fr/cfhtls-zphots/files/ cfhtls_wide_T007_v1.2_Oct2012.pdf. Since the redshift accuracy rapidly deteriorates for magnitudes above in the optical analysis of the structure, we have adopted a cut in -band magnitude at .
To obtain stellar mass estimates used in Section 4 we used publicly available data from the Canada-France-Hawaii Lensing Survey (CFHTLenS) (see Heymans et al. 2012, Hildebrandt et al. 2012, Erben et al. 2013, and Velander 2012). The stellar masses were extracted using ”LePhare” (see Ilbert et al. 2006 and Arnouts et al. 1999) assuming a Chabrier initial mass function (see Chabrier 2003).
2.2 VLA 3 GHz radio data
2.2.1 Observations, data reduction, and imaging
We observed nine regularly spaced pointings separated by 10′ in RA and Dec in the XXL-N field with the VLA in B configuration, as given in the Table 13. The area observed has central coordinates RA. Three hours of observations were taken on August 30, 2012 (7:35 10:35 UTC) in S-band with central frequency of 3 GHz and 2 GHz bandwidth divided into 16 spectral windows 128 MHz in width. Owing to large-amplitude radio frequency interference (RFI) between 2.12-2.38 GHz, the second and third spectral windows were completely flagged. For flux calibration we observed the calibrator 0521+166 (Seyfert 1 galaxy 3C138) for 105 seconds at the end of the observations. For phase calibration we used J0241-0815 (Seyfert 2 galaxy NGC1052). The phase calibrator was observed every 30 minutes for 2 minutes on-source throughout the observations. The observations were taken under a clear sky at a temperature of 12C.
| Pointing | RA | Dec | Time on-source |
|---|---|---|---|
| [h m s] | [] | [s] | |
| (1) | (2) | (3) | (4) |
| P1 | 02 10 14.66 | -06 22 20.00 | 972 |
| P2 | 02 10 14.66 | -06 12 20.00 | 987 |
| P3 | 02 10 14.66 | -06 02 20.00 | 975 |
| P4 | 02 10 54.89 | -06 22 20.00 | 984 |
| P5 | 02 10 54.89 | -06 12 20.00 | 981 |
| P6 | 02 10 54.89 | -06 02 20.00 | 975 |
| P7 | 02 11 35.11 | -06 22 20.00 | 999 |
| P8 | 02 11 35.11 | -06 12 20.00 | 984 |
| P9 | 02 11 35.11 | -06 02 20.00 | 978 |
Calibration of the data was done using the AIPSLite pipeline (e.g. Bourke et al. 2014) developed for the Caltech-NRAO Stripe 82 Survey (Mooley et al., 2015). The calibrated data were then imported into the CASA package and data with amplitudes greater than 0.4 Jy were further flagged using the CASA task FLAGMINMAX. Using the task SPLIT the data were then split into separate pointings prior to imaging. Imaging of the data was performed for each pointing separately using multifrequency synthesis within the CASA task CLEAN (Rau & Cornwell 2011; see also Novak et al. 2015). The algorithm models the sky brightness in the entire 2 GHz bandwith using a linear combination of Gaussian functions with amplitudes following a Taylor polynomial in frequency. A two-term expansion was used with 10,000 iterations, threshold 3 (40 Jy), default gain value of 0.1 and ‘gridmode’ parameter set to wide field with 128 w-projection planes for convolution. We used Briggs weighting with a robust value of 0.5. This value was chosen as it optimally balances rms and sidelobe contamination. After the imaging, a wide-band primary beam correction was applied using the CASA task WIDEBANDPBCOR. This was executed with two Taylor terms (‘nterms’) and a threshold of 20% of the primary beam response was set.
Each pointing was convolved to with position angle of to assure a uniform synthesised beam across the final mosaic. To construct the mosaic we combined the nine individual pointings by performing an rms-weighted sum of the pixels in the overlapping regions. For each pixel the local rms value was obtained from the corresponding pixel in the noise map. These noise maps were constructed using the AIPS141414http://www.aips.nrao.edu/ task RMSD and are discussed in more detail in Sect. 2.2.2.
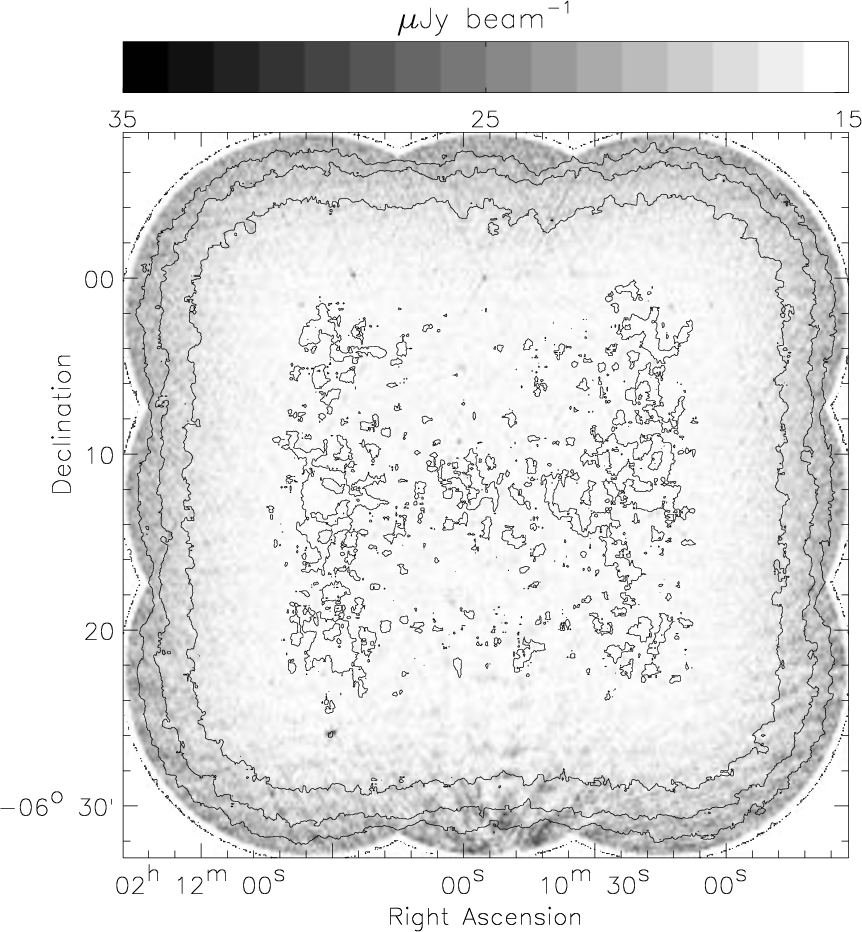
In summary, the final resolution mosaic shown in Fig. 1 covers a total area of ( deg2) and has an average rms of Jy beam-1. The average rms of the inner region is Jy beam-1. Within this central area the noise is nearly Gaussian.
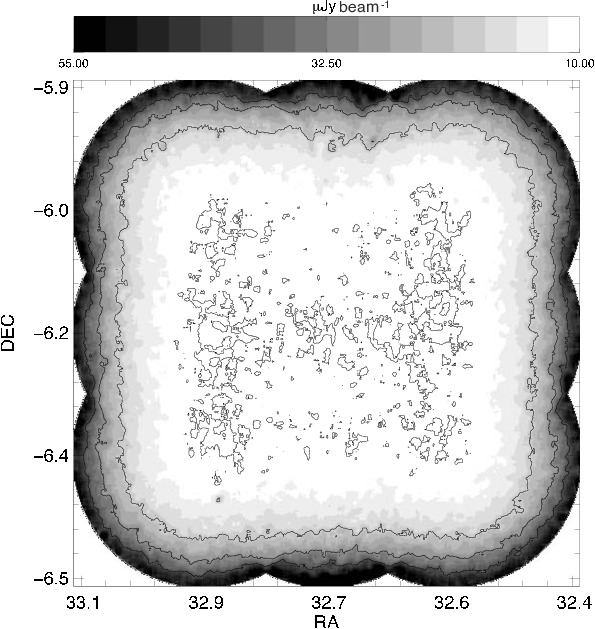
2.2.2 Cataloguing
To catalogue all sources present in the mosaic down to a specific signal-to-noise ratio (S/N) we used the AIPS task Search and Destroy (SAD). The SAD task looks for potential sources in an image by identifying agglomerations of pixels (islands) with values above a certain level and then fits Gaussian components to them (see AIPS CookBook151515http://www.aips.nrao.edu/cook.html). We ran SAD using both the mosaic and the rms maps as inputs. The latter was generated via the AIPS task RMSD and is used by SAD to determine the local S/N values (see Fig. 2). The size of the box from which the rms is sampled (parameter ‘imsize’) was set to 8080 pixels and parameters ‘xinc’ and ‘yinc’, which define the increments for calculating rms, were set to 10 pixels. The task SAD was configured with the following parameters: ‘ngauss’ is the maximum number of components to look for was set to 10,000, ‘cparm’ defines the S/N levels down to which the task will look for potential sources and was set to 50 10 7 4.5, ‘dparm(9)’ was set to 2.1 to set the units of ‘cparm’ levels to S/N, ‘doall’ was set to -1 to fit only one Gaussian per island. The parameter ‘dparm(7)’, which defines total residual flux in the fitting box, was set to 85 Jy. All other parameters were kept at default values. This procedure yielded 311 radio source components down to 4.5 times the local rms, all of which were visually inspected and compared to CFHTLS optical images of field W1 with a 1 position cross-match radius.
A total of 28 components were manually combined into eight multicomponent sources. Their total integrated flux densities were measured using the AIPS task TVSTAT down to 2 contours (while their peak surface brightness values, major and minor axes, position angles, and their respective errors are set to -99.99 values in the catalogue; see below). In all such cases the coordinates of the component that overlapped with the optical detection were taken as the source position.
The fraction of radio and optical matches (within 1″matching radius) is roughly constant at around 80% down to 6, and then drops to 56% for S/N. Therefore, in the final catalogue we report only 155 sources above 6.
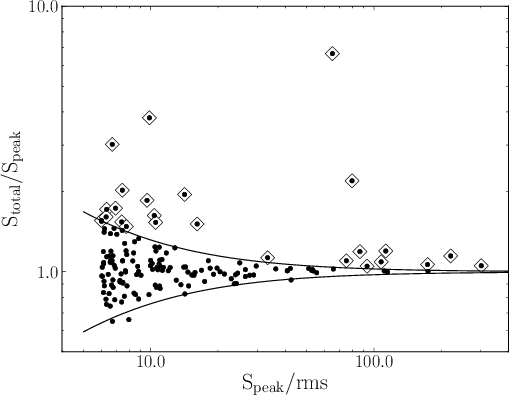
To separate resolved from unresolved sources we made use of the ratio of total flux density and peak surface brightness, which is a measure of extendedness of the sources. The ratio as a function of the S/N is shown in Fig. 3, and spreads with decreasing S/N (see, e.g. Bondi et al. 2008). Following the method of Bondi et al. (2008), we fitted a lower envelope containing 95% of the sources with . This envelope was then mirrored above the line defined by , giving an equation for the upper envelope
| (1) |
Sources in Fig. 3 above the upper envelope are considered resolved. For unresolved sources the values of total flux densities are then set equal to their peak surface brightnesses. Lengths of major and minor axes, and position angles (with their respective errors) are set to 0.0.
A total of 25 (130) sources were considered resolved (unresolved). A sample page of the catalogue is given in Table 17. The Table 17 shows a sample radio catalogue page adn the relevant parameters. In summary, 155 sources are catalogued, 25 of which are considered resolved, 8 are flagged as multicomponent, and 11 are positioned on a sidelobe.
2.2.3 Multiwavelength properties of the 3 GHz sources
We found 123 optical counterparts of the 155 3 GHz sources using the CFHTLS W1 field catalogue and a 1 matching radius, corresponding to 79% of the sources. All sources with optical counterparts are visible across all CFHTLS bands (*,,,,). For comparison, a correlation of 155 randomly distributed artificial sources across the field yielded nine matches with the CFHTLS catalogue within 1 matching radius. This sets the false-match probability to .
The -band magnitudes of the matched sources are in the range to with an average . Redshifts range from to and have an average of .
We obtained 1.4 GHz information for our 3 GHz sources using the Faint Images of the Radio Sky at Twenty-cm (FIRST 161616http://sundog.stsci.edu/ ). The FIRST survey is an all-sky survey conducted at 1.4 GHz; it has angular resolution of (Becker et al., 1995) and a typical rms of 0.15 mJy. For comparison, the average beam size in the VLA-XXL survey was with an average rms of Jy, giving times better sensitivity (for an assumed spectral index of ) and a factor of better resolution. The FIRST source catalogue lists sources brighter than mJy.
By positionally matching our 3 GHz source catalogue with the FIRST Survey Catalog (Helfand et al., 2015) using a matching radius of we find 21 matches. Of these 21 sources, 16 are singlecomponent at 3 GHz. We find a mean spectral index of with a standard deviation of between the 3 and 1.4 GHz fluxes for these singlecomponent sources (assuming , where is the radio flux density at frequency , and is the spectral index). These values are expected for radio sources at these flux levels (e.g. Kimball & Ivezić 2008).
| ID | RA | Dec | S | S | Res | SL | Multi | Maj | Min | PA | |||||||
|---|---|---|---|---|---|---|---|---|---|---|---|---|---|---|---|---|---|
| [h m s] | [] | [″] | [″] | [Jy beam-1] | [Jy beam-1] | [Jy] | [Jy] | [″] | [″] | [″] | [″] | [∘] | [∘] | ||||
| (1) | (2) | (3) | (4) | (5) | (6) | (7) | (8) | (9) | (10) | (11) | (12) | (13) | (14) | (15) | (16) | (17) | (18) |
| 1 | 02 09 41.78 | -06 19 10.56 | 0.18 | 0.43 | 199 | 30 | 601 | 42 | 1 | 0 | 0 | 6.7 | 1.0 | 2.7 | 0.4 | 172.4 | 6.0 |
| 2 | 02 09 42.38 | -05 59 42.66 | 0.05 | 0.08 | 494 | 29 | 494 | 29 | 0 | 0 | 0 | 0.0 | 0.0 | 0.0 | 0.0 | 0.0 | 0.0 |
| 3 | 02 09 45.62 | -06 18 43.14 | 0.02 | 0.03 | 1229 | 23 | 1229 | 23 | 0 | 0 | 0 | 0.0 | 0.0 | 0.0 | 0.0 | 0.0 | 0.0 |
| 4 | 02 09 47.75 | -06 20 53.02 | 0.15 | 0.19 | 134 | 20 | 134 | 20 | 0 | 0 | 0 | 0.0 | 0.0 | 0.0 | 0.0 | 0.0 | 0.0 |
| 5 | 02 09 48.68 | -06 29 41.37 | 0.09 | 0.12 | 453 | 42 | 453 | 42 | 0 | 0 | 0 | 0.0 | 0.0 | 0.0 | 0.0 | 0.0 | 0.0 |
| 6 | 02 09 51.03 | -06 06 20.77 | 0.02 | 0.03 | 928 | 18 | 928 | 18 | 0 | 0 | 0 | 0.0 | 0.0 | 0.0 | 0.0 | 0.0 | 0.0 |
| 7 | 02 09 51.90 | -06 07 12.60 | 0.12 | 0.26 | 158 | 16 | 602 | 52 | 1 | 0 | 0 | 6.1 | 0.6 | 2.6 | 0.3 | 10.3 | 4.0 |
| 8 | 02 09 54.42 | -05 54 54.17 | 0.13 | 0.22 | 184 | 30 | 184 | 30 | 0 | 0 | 0 | 0.0 | 0.0 | 0.0 | 0.0 | 0.0 | 0.0 |
| 9 | 02 09 56.19 | -06 09 16.01 | 0.07 | 0.09 | 235 | 15 | 356 | 56 | 1 | 0 | 0 | 3.4 | 0.2 | 2.7 | 0.2 | 163.7 | 11.0 |
| 10 | 02 09 56.43 | -06 04 57.98 | 0.20 | 0.27 | 80 | 13 | 125 | 32 | 1 | 0 | 0 | 4.1 | 0.7 | 2.3 | 0.4 | 151.7 | 11.0 |
3 Analysis of the supercluster
In this section we analyse the first supercluster (XLSSC-e) identified in the XXL-N field (Pompei et al. (2015)). We use Voronoi tesselation analysis (VTA) and the CFHTLS photometric redshifts (Sect. 3.1), as well as the radio properties of the VTA-identified potential supercluster members (Sect. 3.2).
3.1 Optical properties
3.1.1 Identification of overdensities: Voronoi tessellation analysis
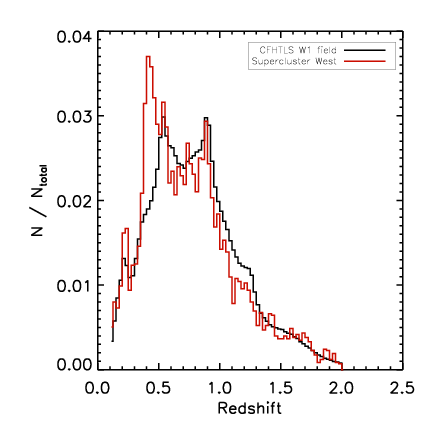
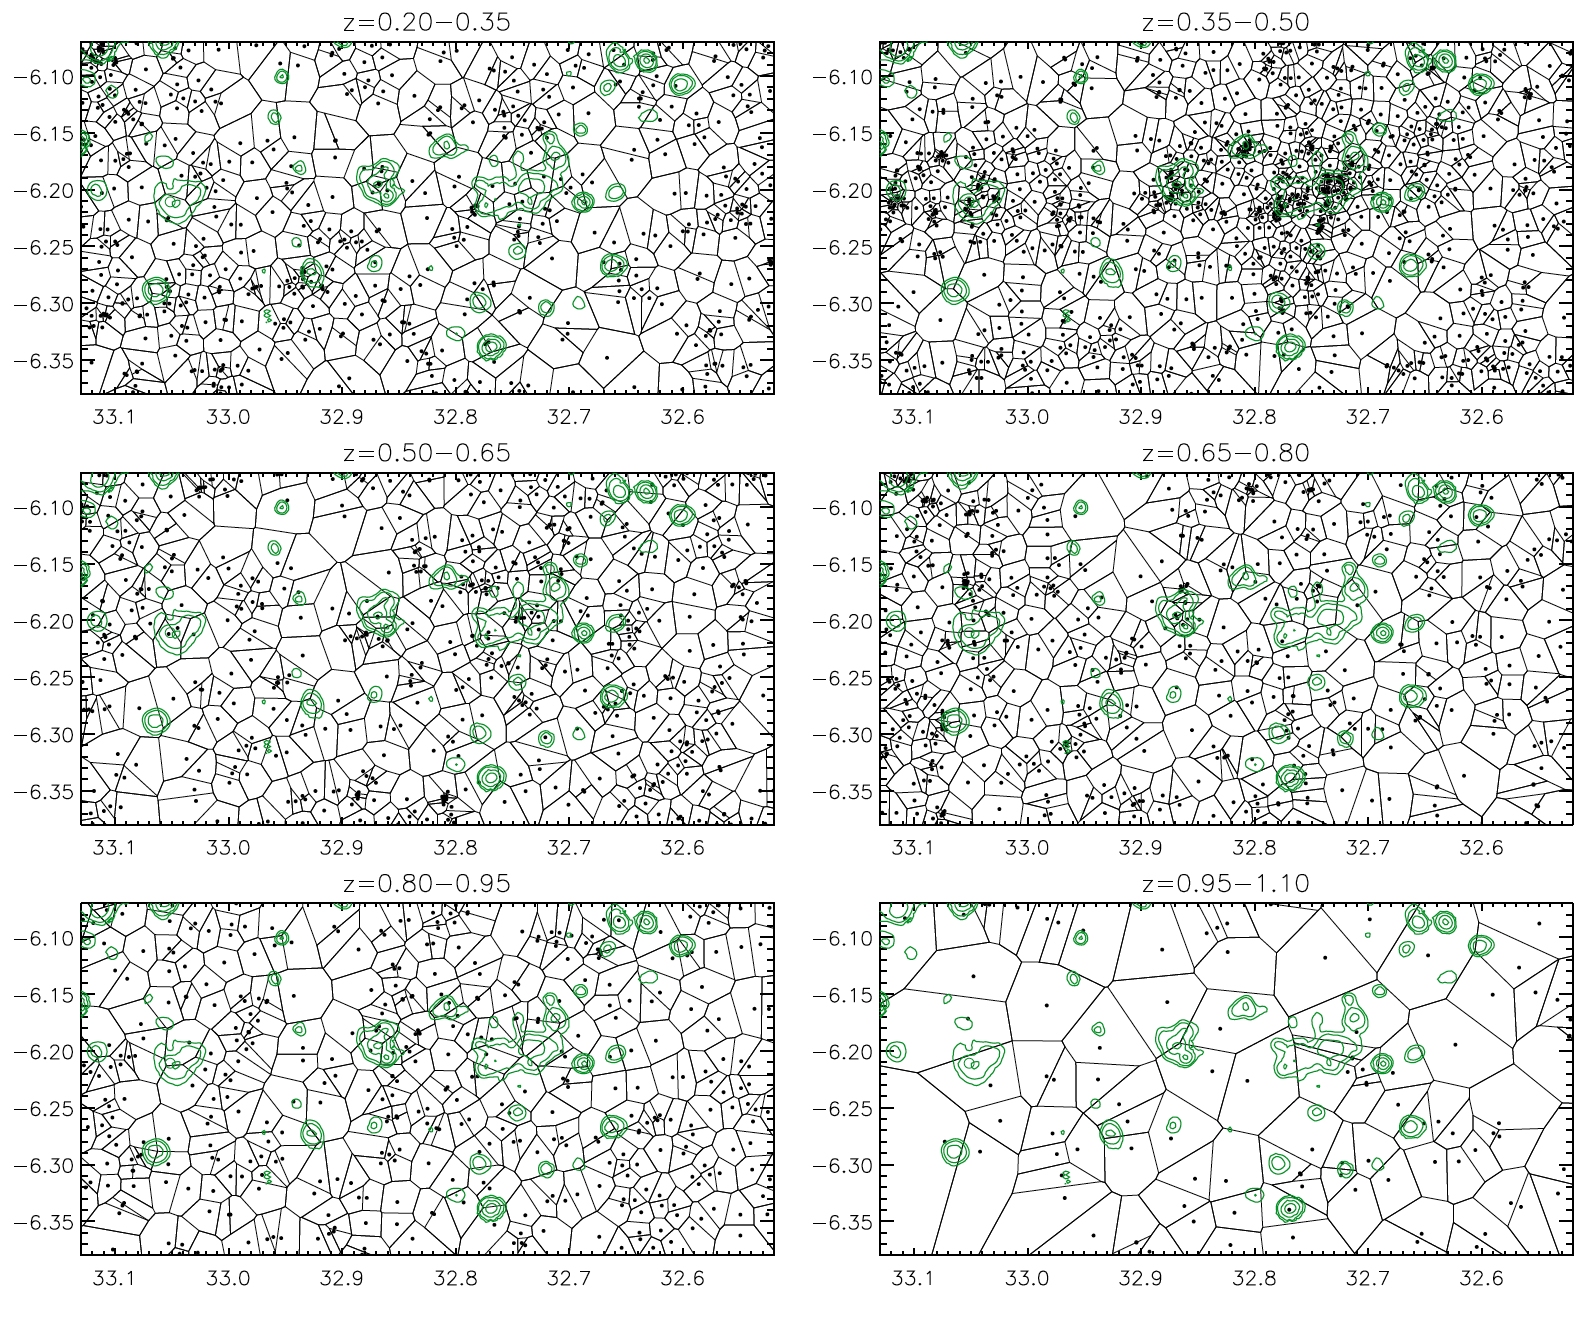
To identify the photometric redshift depth that the supercluster occupies, in Fig. 4 we compare the photometric redshift distribution data from the CFHTLS T0007 Data Release (described in Ilbert et al. 2006; Coupon et al. 2009, see also catalogue documentation181818http://cesam.lam.fr/cfhtls-zphots/files/cfhtls_wide_T007_v1.2_Oct2012.pdf), between the area encompassing the six westernmost X-ray clusters and the entire field. The comparison indicates an excess in the number of galaxies at in this area. In Fig. 5 we show the spatial distribution of galaxies in this cluster area for six wide redshift bins in the range . Consistent with the redshift peak at we find the strongest clustering of galaxies in the redshift bin (cf. Coupon et al. (2009)). This range corresponds to a width of at z=0.43, and we consider this redshift range in the analysis.
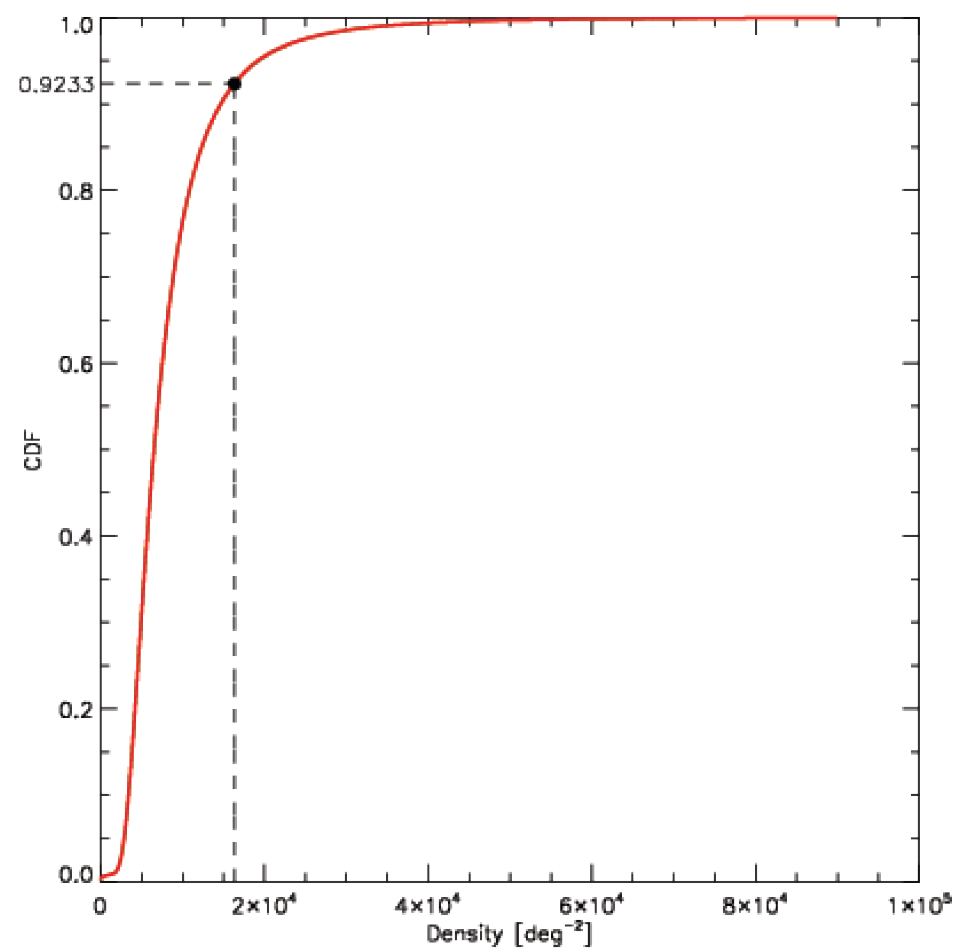
To identify potential supercluster galaxy members we perform a VTA in the area of interest for CFHTLS W1 galaxies with . In this technique (used in van de Weygaert & Icke 1989, and also recently in e.g. Smolčić et al. 2007; Oklopčić et al. 2011; Jelić et al. 2012) we divide the area into polygons and calculate their surface area. Each polygon contains only one galaxy with sides equidistant from the nearest neighbouring galaxies and from the galaxy within. This means the inverse of the surface of these polygons, , is proportional to the local galaxy density , i.e. . A robust ‘local’ galaxy density threshold value then identifies ‘overdense’ regions. To determine this threshold we performed the VTA on an area times larger than the area of interest. This area was populated by randomly distributed artificially generated galaxies. The number of galaxies is equal to the number of galaxies with within the CFHTLS catalogue in the same area. Based on the VTA on this field we calculated the average field number density, i.e. the median of the distribution where is the area of a given Voronoi cell. We note that the CFHTLS images of this region contained masked areas, for example around bright stars or artefacts. The impact of these masks on our density estimates was compensated for by scaling the overdensity criterion threshold by a factor equal to , which equates to 93%. The threshold was chosen as the 92% quantile of the cumulative distribution of galaxy densities in the mock catalogues (see Fig. 6) and equates to 16,357 galaxies per square degree. We then flagged as overdense those cells for which is greater than this threshold. Galaxies within such flagged cells are considered to be potential members of overdense structures.
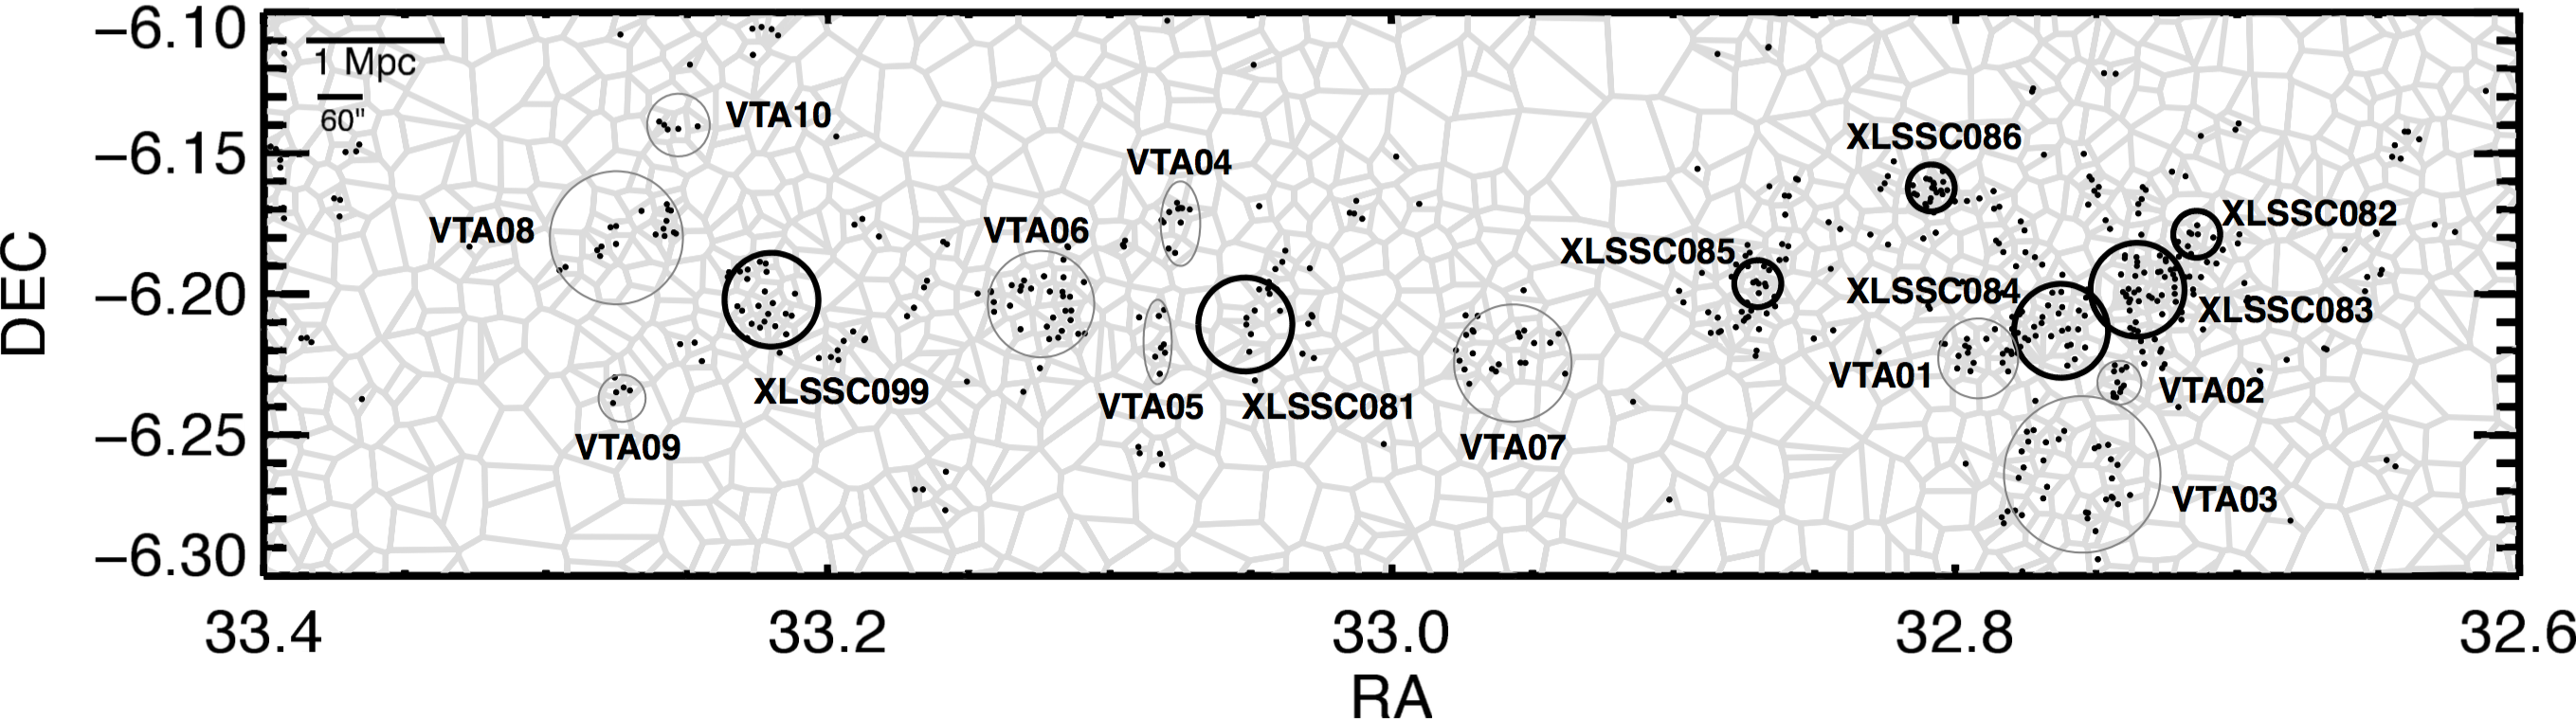
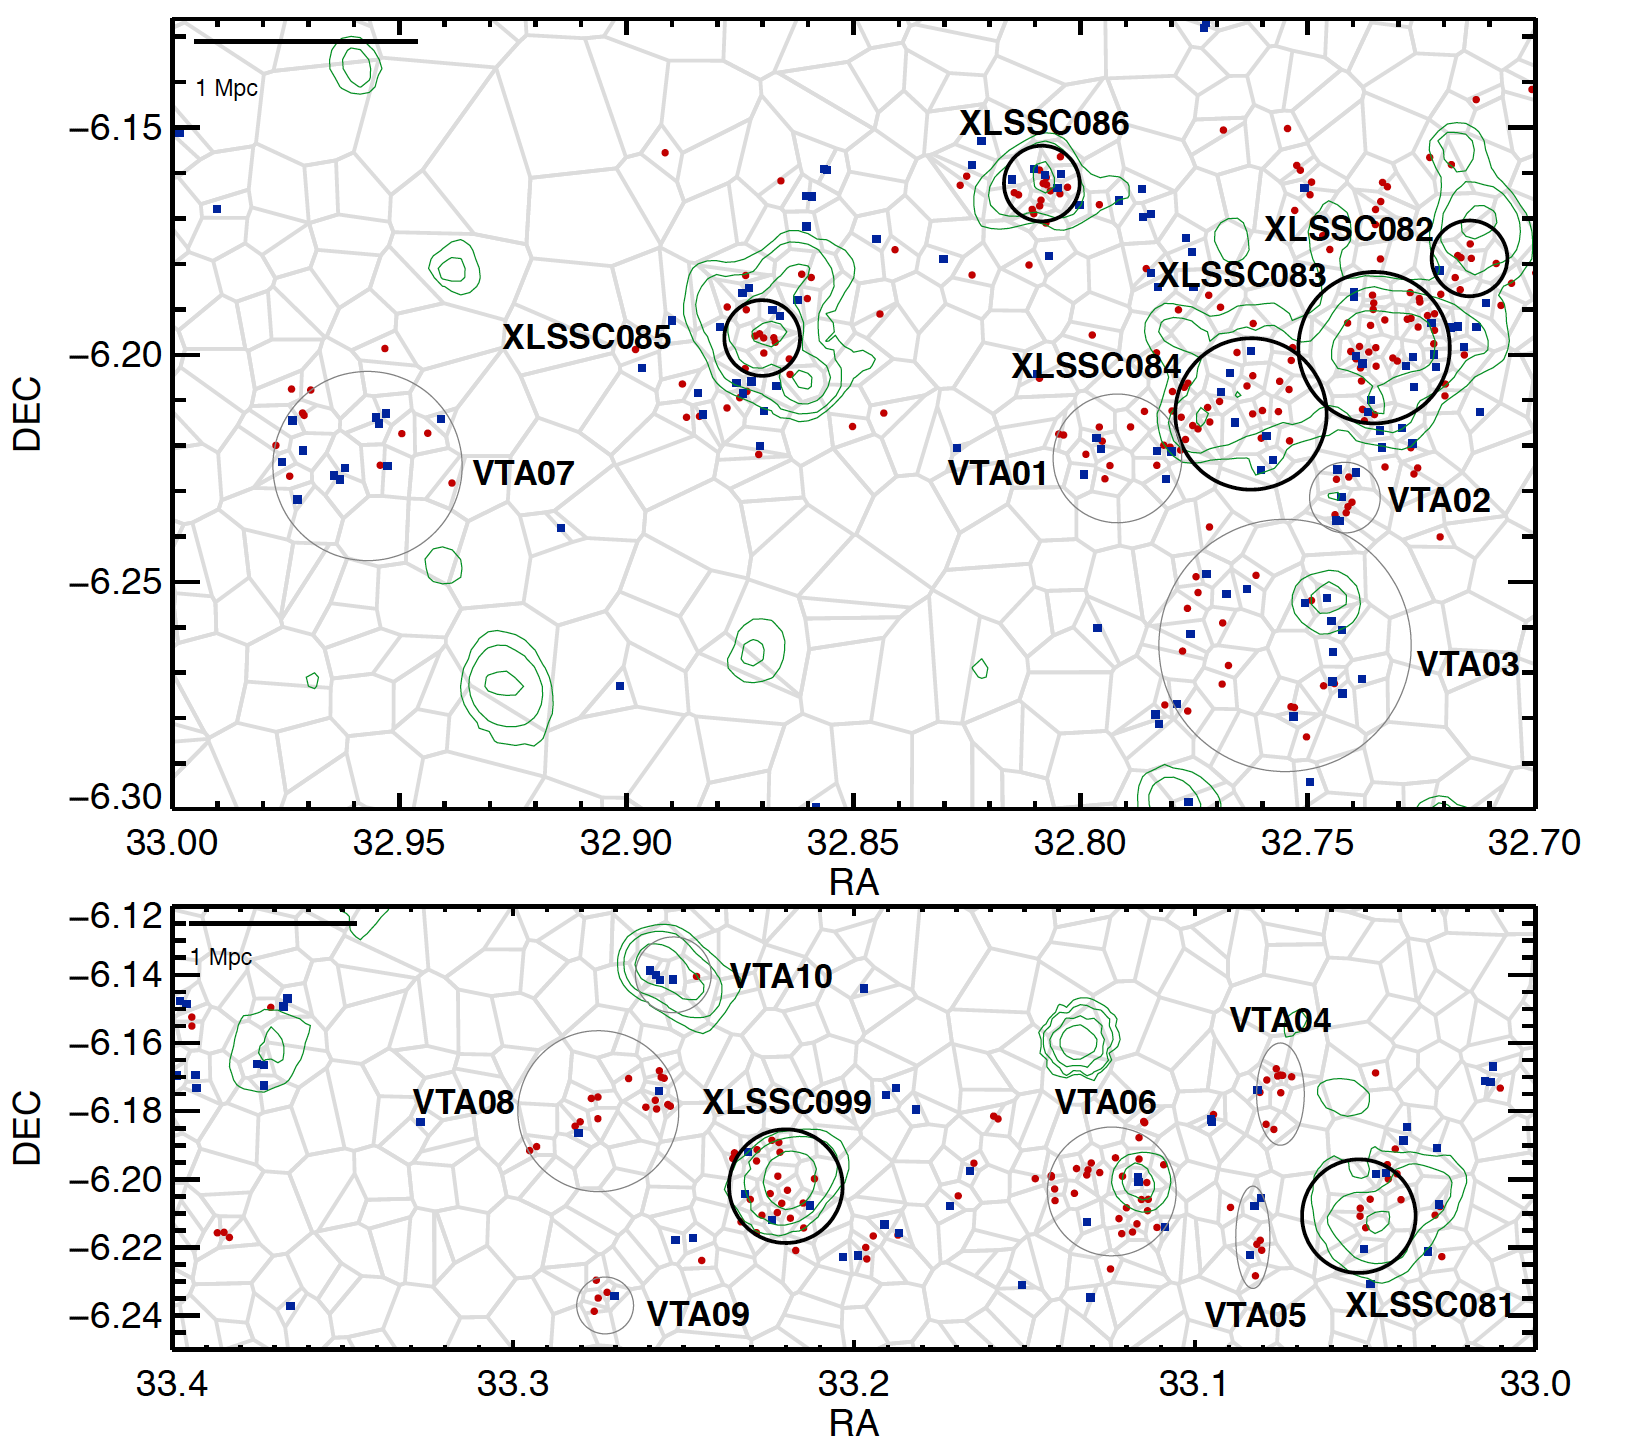
The results of the VTA at are shown in Fig. 7 where we indicate only potential overdense structure galaxy members. The regions from which galaxies were sampled were chosen so as to best encompass the VTA galaxy member candidates located either within the X-ray contours or within the VTA-identified overdensity structures (making sure that each galaxy was counted only in one overdensity). We show an area larger than encompassed by the X-ray emission of the seven identified X-ray clusters to quantify potential additional overdense structures that may be undetected in the X-rays. In addition to the clusters already identified in the X-rays (labelled in Fig. 7; see also Fig. 1 in Pompei et al. (2015)), we identify ten additional galaxy overdense structures, labelled VTA01 to VTA10 in the figure. The overdense structures seem to assemble into two agglomerations (eastern and western), with an extended potential overdense structure in between (VTA07 in Fig. LABEL:fig:voronoi_all). We note, however, that the area between these two agglomerations contains an optically masked area (a vertical strip at ; cf. Fig. 1 in Pompei et al. (2015)). Thus, no clustering information could be retrieved for this part of the sky, which could contain additional overdense structures connecting the two agglomerations. The VTA may be not effective in detecting highly elongated, filamentary overdense structures. Since the structures in the field studied here are relatively close to each other, we do not expect this feature to influence our results significantly. Our VTA analysis based on photometric redshifts clearly identifies the clusters, independently detected via extended X-ray emission. This assures that the VTA yields robust group/cluster candidates, as further verified in the next section.
3.1.2 Verification of the VTA-identified overdensities
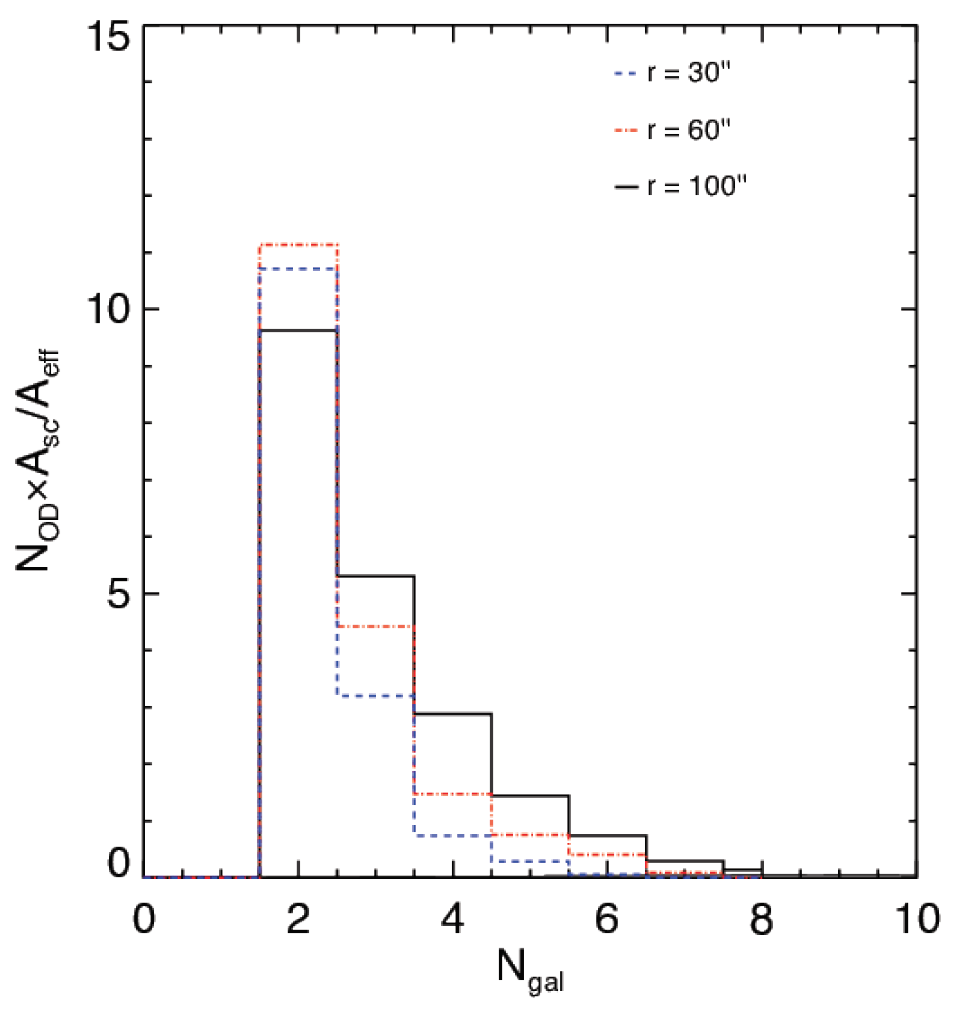
We test the probability of finding an overdensity caused by random density fluctuations using our te mock catalogues of randomly distributed galaxies across an area that is times larger than that occupied by the supercluster. By tiling the plane with non-overlapping circular regions of a fixed radius, we identify regions with simulated overdense galaxies. We perform this analysis for three different circular areas with radii , , and . The result is then normalised by the effective area to derive the expected number of false positive detections of overdense regions. In Fig. 8 we show the expected number of false positive detections with N galaxies within , , and in our supercluster area. Since our overdense regions contain five or more galaxies within an effective radius of , we expect to find less than one such overdense region that is the result of random density fluctuations in our field. This is in agreement with Ramella et al. (2001) who set the minimum number of closely separated galaxies to five, as the threshold for cluster detection, rendering the effect of Poisson fluctuation negligible.
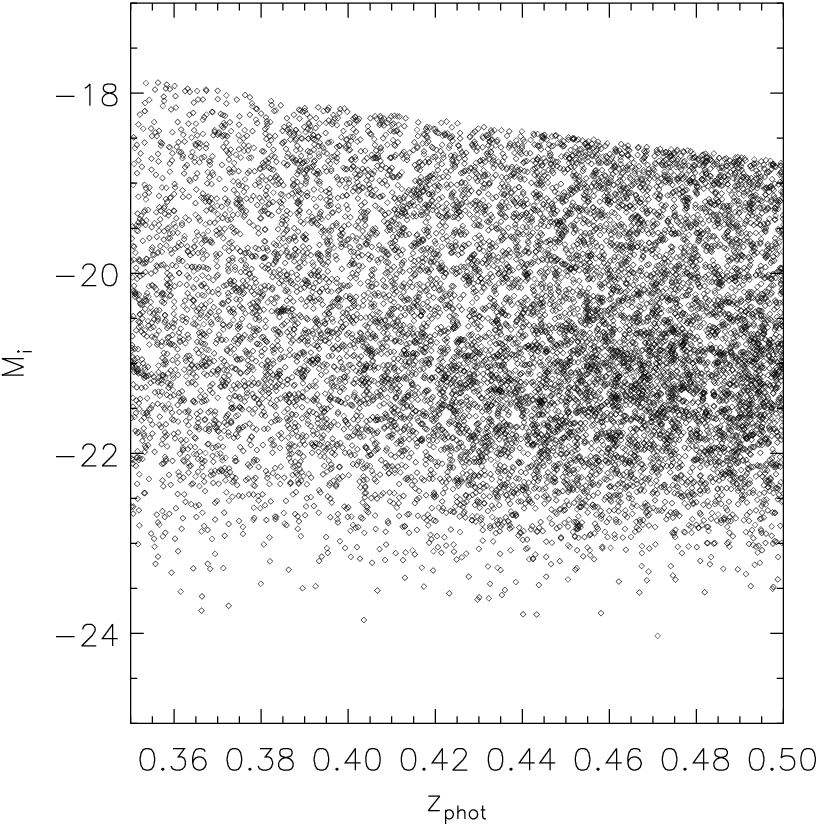
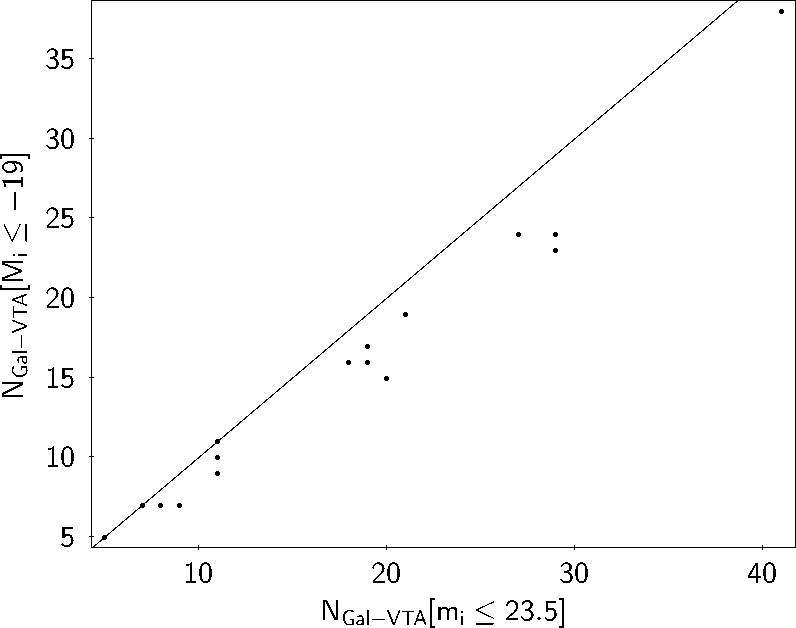
To assess the significance of Malmquist bias on the detection of overdense structures we calculated absolute magnitudes for galaxies in the studied redshift range of 0.35 - 0.5. These absolute magnitudes are shown as a function of redshift in the upper panel of Fig. 9. We note a drop in the absolute magnitude limit from at to at . Cutting the optical catalogue at instead of , we find the same overdense regions, although with a slightly lower number of galaxies in each of them (lower panel in Fig. 9). Thus, we conclude that Malmquist bias does not affect the results of the overdensity detections presented here. Finally, we performed an a posteriori verification of the validity of choosing the redshift range . In the first step, we concatenated the CFHTLS photometric redshift and the CFHTLS photometric catalogue for an area times the size of the supercluster. Using this catalogue we performed the VTA (as described in Sec. 3.1.1) for various wide redshift ranges centred at , where . In each redshift range the number of overdense galaxies within the identified overdensity regions were then identified. We find that all 17 overdense regions peak in the chosen redshift bin (), suggesting this is the optimal range to describe all the overdense regions. However, to accurately report the mean redshift of each overdense region and the corresponding standard deviation we analyse each region within its own extent in redshift. We consider the region extended in redshift if the number of galaxies in redshift bins adjacent to the peak is within the Poissonian counting error of the peak value. We then use the extended redshift range to determine the mean redshift of overdense galaxies in each VTA region.
Redshifts used to calculate the and its standard deviation for all overdense regions (including XLSSC clusters) are sampled from the range , except for VTA02, VTA09, and VTA10. These overdense regions show a broader distribution in redshift, as determined by the criterion described above. Specifically, VTA02 was extended to , VTA09 to , and VTA10 to . The mean photometric redshifts and the corresponding standard deviations of our VTA-identified overdense structure member candidates are listed in Table 3. They are in agreement with the spectroscopic redshifts of all of the brightest cluster galaxies determined in Pompei et al. (2015), also listed in Table 3. Spectroscopic redshift confirmation of the XLSSC 081-086 was performed on spectra of at least three galaxies (up to five) per cluster (Pompei et al., 2015). However, the spectroscopic redshift of the XLSSC 099 was determined from the spectrum of only one galaxy in the cluster (the brightest) using a spectrum from the GAMA191919http://www.gama-survey.org/ survey. The median redshift error is 33km/s for the of the GAMA objects (Baldry et al., 2014), rendering the error negligible. The photometric redshift of this bright galaxy ( = 17.88) is estimated to be = 0.3615, and is thus consistent with its spectroscopic redshift, since for sources with . Our analysis suggests that the mean overdensity redshift is slightly shifted relative to the redshift of this galaxy.
3.1.3 Galaxy colour properties
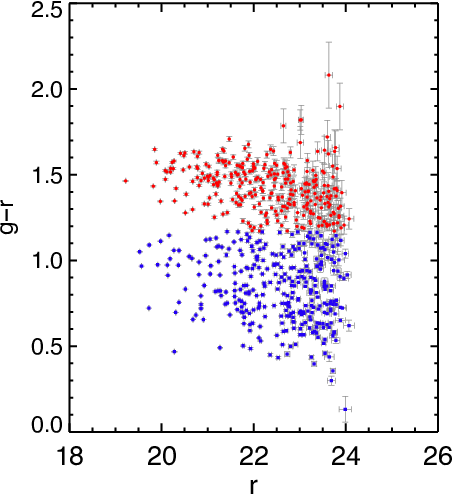
We separate blue from red galaxies using a threshold of . This value corresponds to the inflection point of the double-Gaussian function best fit to the histogram. The versus colour-magnitude diagram for the VTA-identified potential supercluster galaxy members is shown in Fig. 10. In Fig. 11 we show the spatial distribution of the red and blue potential supercluster galaxy members, overlaid with X-ray contours. In virialised clusters, red galaxies occupy the centre, while the blue galaxies occupy the outskirts of the cluster. As can be seen from the top and bottom panels of Fig. 11, this does not appear to be the case here in all identified overdense structures. This will be further discussed in Sect. 4.
| ID | RA | Dec | |||||||
|---|---|---|---|---|---|---|---|---|---|
| [h m s] | [d m s] | [ erg s-1] | [keV] | [kpc] | [ ] | ||||
| (1) | (2) | (3) | (4) | (5) | (6) | (7) | (8) | (9) | (10) |
| XLSSC 081 | 02 12 12∗*∗*Taken from Pompei et al. (2015). | -06 12 39∗*∗*Taken from Pompei et al. (2015). | 0.42 | 0.04 | 0.428∗*∗*Taken from Pompei et al. (2015). | 14.9∗*∗*Taken from Pompei et al. (2015). | 1.7∗*∗*Taken from Pompei et al. (2015). | 549∗*∗*Taken from Pompei et al. (2015). | 7∗*∗*Taken from Pompei et al. (2015). |
| XLSSC 082 | 02 10 51∗*∗*Taken from Pompei et al. (2015). | -06 10 44∗*∗*Taken from Pompei et al. (2015). | 0.42 | 0.04 | 0.424∗*∗*Taken from Pompei et al. (2015). | 17.1∗*∗*Taken from Pompei et al. (2015). | 3.9∗*∗*Taken from Pompei et al. (2015). | 878∗*∗*Taken from Pompei et al. (2015). | 29∗*∗*Taken from Pompei et al. (2015). |
| XLSSC 083 | 02 10 56∗*∗*Taken from Pompei et al. (2015). | -06 11 54∗*∗*Taken from Pompei et al. (2015). | 0.42 | 0.03 | 0.430∗*∗*Taken from Pompei et al. (2015). | 31.3∗*∗*Taken from Pompei et al. (2015). | 4.8∗*∗*Taken from Pompei et al. (2015). | 990∗*∗*Taken from Pompei et al. (2015). | 41∗*∗*Taken from Pompei et al. (2015). |
| XLSSC 084 | 02 11 03∗*∗*Taken from Pompei et al. (2015). | -06 12 47∗*∗*Taken from Pompei et al. (2015). | 0.42 | 0.04 | 0.430∗*∗*Taken from Pompei et al. (2015). | 13.8∗*∗*Taken from Pompei et al. (2015). | 4.5∗*∗*Taken from Pompei et al. (2015). | 955∗*∗*Taken from Pompei et al. (2015). | 37∗*∗*Taken from Pompei et al. (2015). |
| XLSSC 085 | 02 11 29∗*∗*Taken from Pompei et al. (2015). | -06 11 47∗*∗*Taken from Pompei et al. (2015). | 0.43 | 0.03 | 0.428∗*∗*Taken from Pompei et al. (2015). | 28.3∗*∗*Taken from Pompei et al. (2015). | 4.8∗*∗*Taken from Pompei et al. (2015). | 985∗*∗*Taken from Pompei et al. (2015). | 41∗*∗*Taken from Pompei et al. (2015). |
| XLSSC 086 | 02 11 14∗*∗*Taken from Pompei et al. (2015). | -06 09 44∗*∗*Taken from Pompei et al. (2015). | 0.41 | 0.04 | 0.424∗*∗*Taken from Pompei et al. (2015). | 11.2∗*∗*Taken from Pompei et al. (2015). | 2.6∗*∗*Taken from Pompei et al. (2015). | 698∗*∗*Taken from Pompei et al. (2015). | 15∗*∗*Taken from Pompei et al. (2015). |
| XLSSC 099 | 02 12 53 | -06 12 07 | 0.43 | 0.04 | 0.3911 | 14.4 | 5.1 | 1038 | 47 |
| VTA01 | 02 11 10 | -06 13 22 | 0.40 | 0.04 | … | ¡7.3 | ¡1.8 | ¡560.6 | ¡7.7 |
| VTA02 | 02 10 58 | -06 13 53 | 0.39 | 0.05 | … | ¡9.3 | ¡1.9 | ¡590.2 | ¡9.0 |
| VTA03 | 02 11 01 | -06 15 50 | 0.43 | 0.04 | … | ¡5.9 | ¡1.6 | ¡535.2 | ¡6.7 |
| VTA04 | 02 12 18 | -06 10 30 | 0.41 | 0.03 | … | ¡9.1 | ¡1.9 | ¡586.9 | ¡8.8 |
| VTA05 | 02 12 20 | -06 12 01 | 0.42 | 0.05 | … | ¡9.9 | ¡2.0 | ¡597.1 | ¡9.3 |
| VTA06 | 02 12 30 | -06 12 13 | 0.43 | 0.03 | … | ¡11.7 | ¡2.1 | ¡618.9 | ¡10.3 |
| VTA07 | 02 11 50 | -06 13 28 | 0.43 | 0.03 | … | ¡7.5 | ¡1.8 | ¡563.3 | ¡7.8 |
| VTA08 | 02 12 01 | -06 09 36 | 0.43 | 0.04 | … | ¡8.83 | ¡2.04 | ¡606.6 | ¡9.7 |
| VTA09 | 02 13 06 | -06 14 13 | 0.47 | 0.06 | … | ¡8.8 | ¡1.9 | ¡582.7 | ¡8.6 |
| VTA10 | 02 13 01 | -06 08 24 | 0.39 | 0.06 | … | ¡11.9 | ¡2.30 | ¡649.7 | ¡11.9 |
3.2 Radio properties
Our VLA-XXL-N mosaic covers only the western part of the supercluster (XLSSC 081-086, VTA01-03, and VTA07). The X-ray cluster XLSSC 081 is on the very edge of the mosaic and encompasses one source detected in VLA-XXL-N radio observations (VLA-XXL ID = 154), but without an optical counterpart. VTA04-09 and XLSSC 099 are outside the field-of-view of our 3 GHz VLA-XXL-N mosaic. Thus, for the eastern part of the supercluster we search for radio sources associated with CFHTLS galaxies at using the FIRST and NVSS 1.4 GHz survey catalogues (Becker et al. 1995; Condon et al. 1998). We find no radio sources or radio galaxies associated with galaxies at in the area of interest.
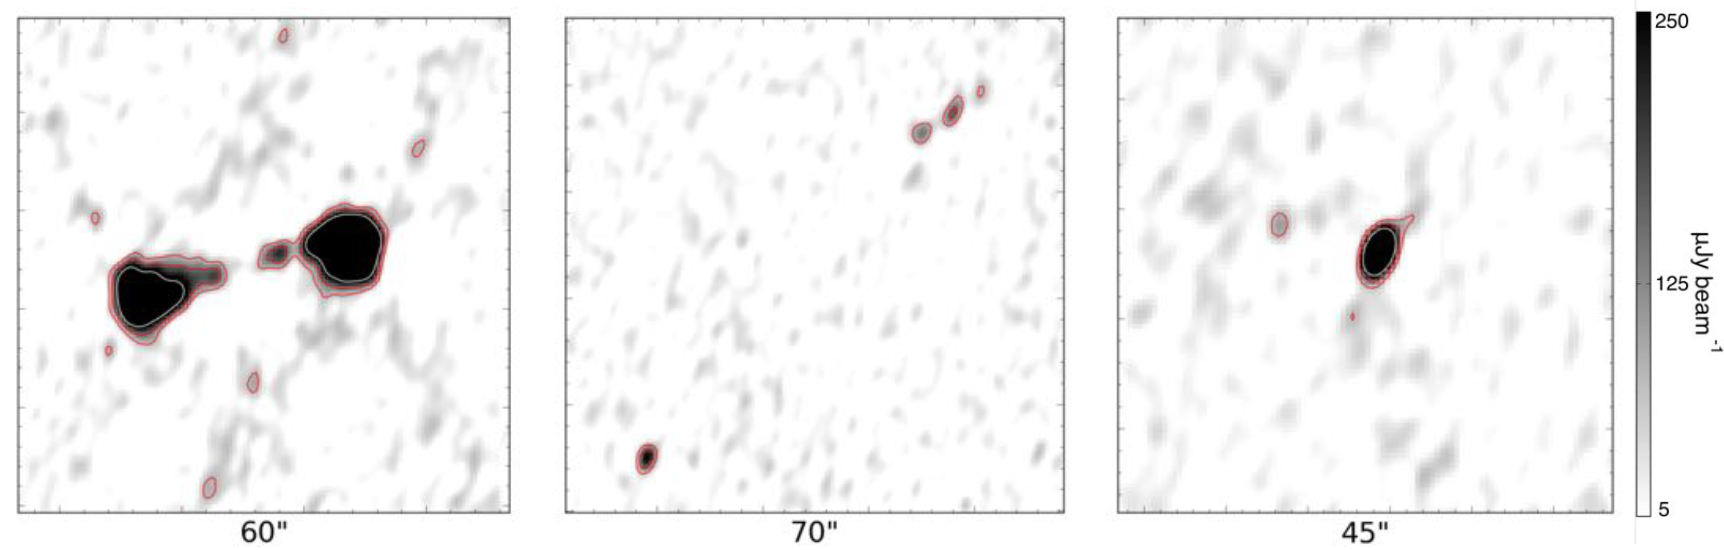
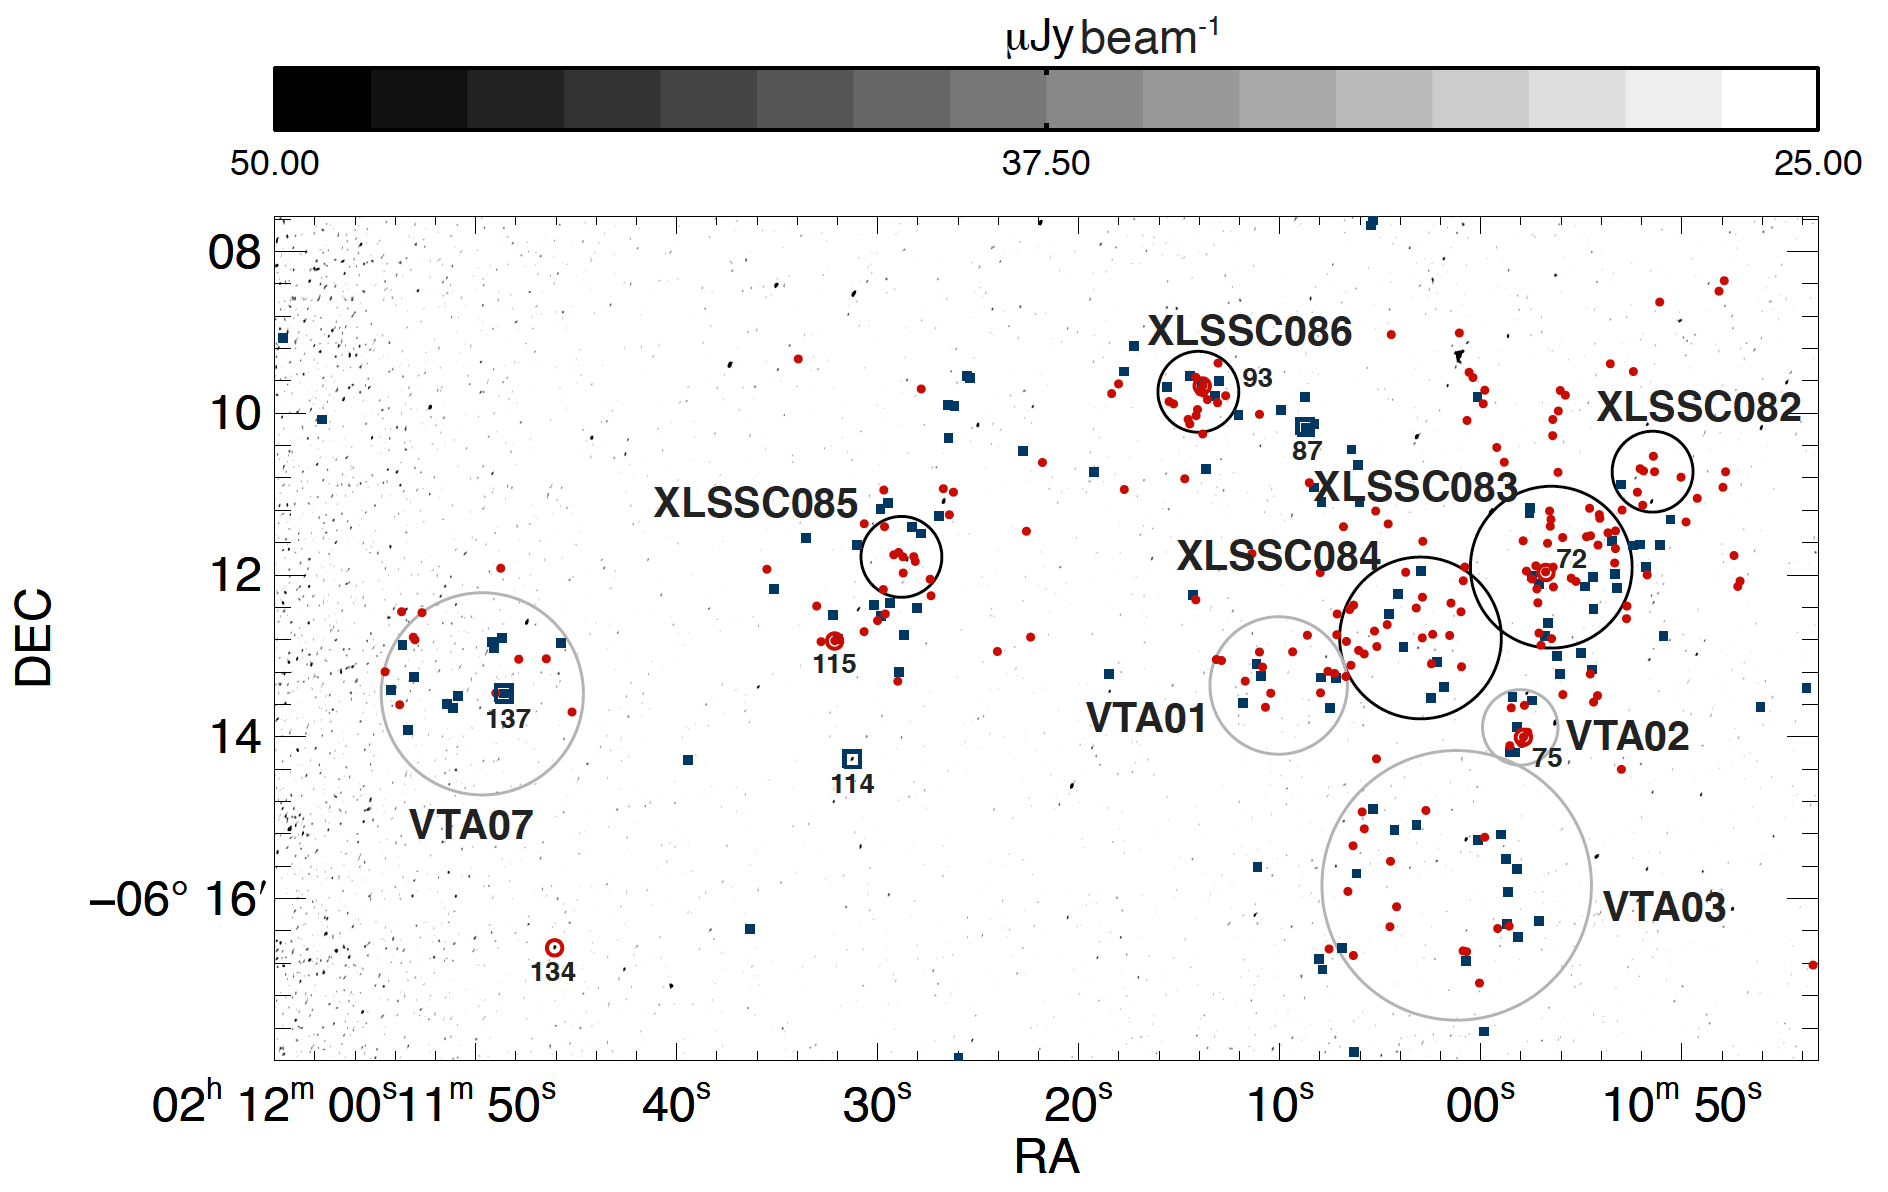
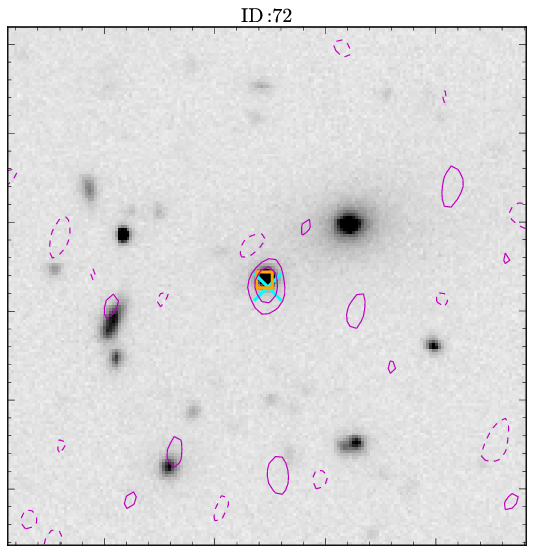
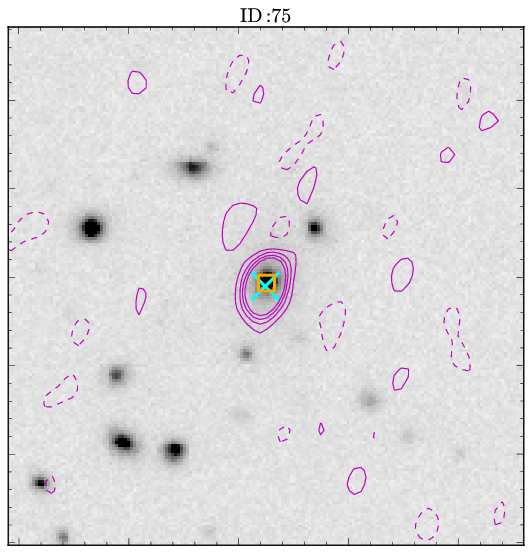
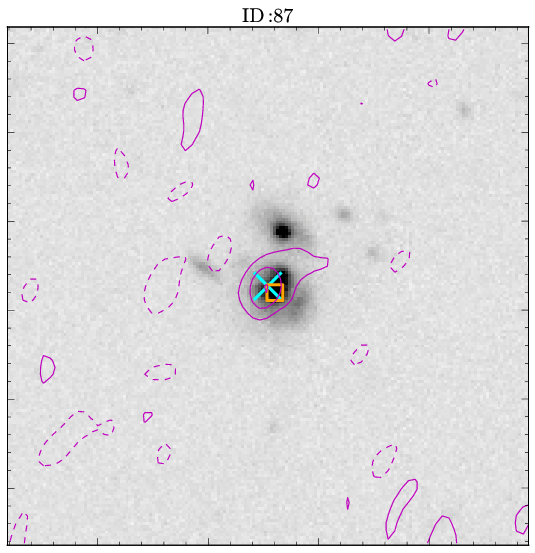
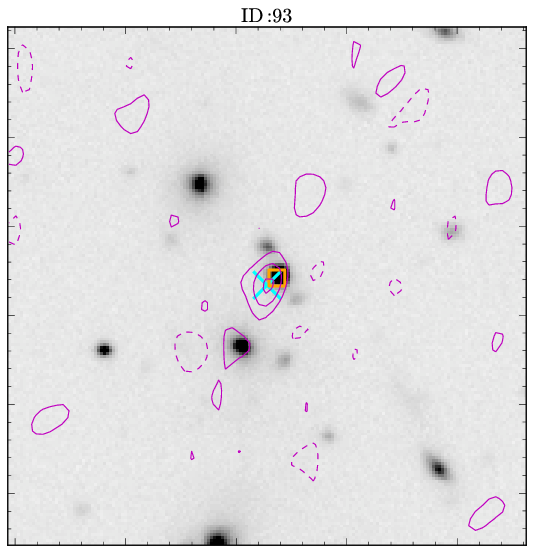
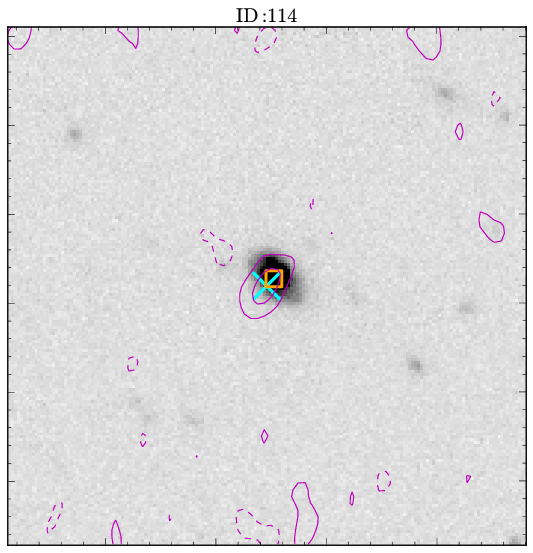
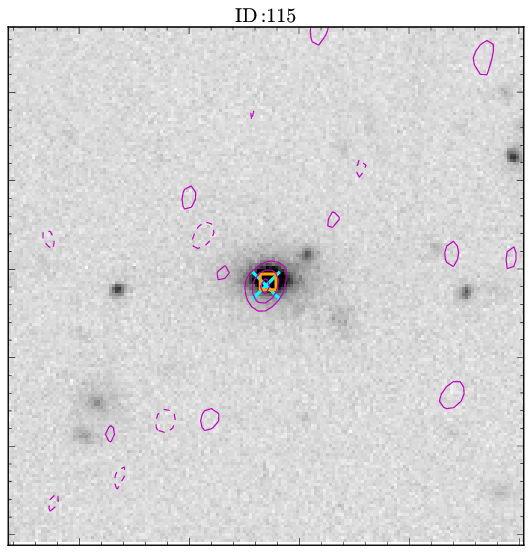
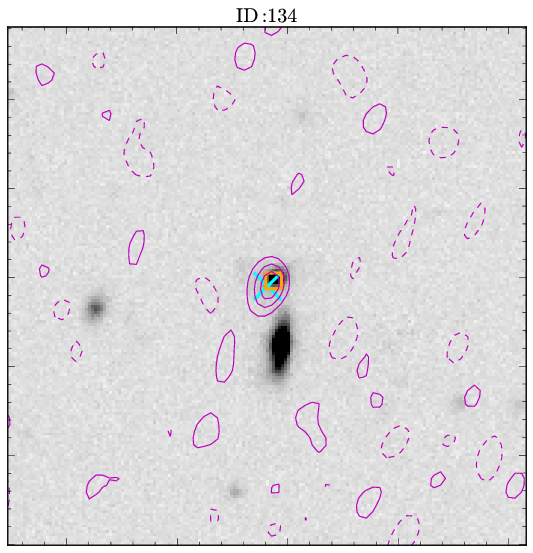
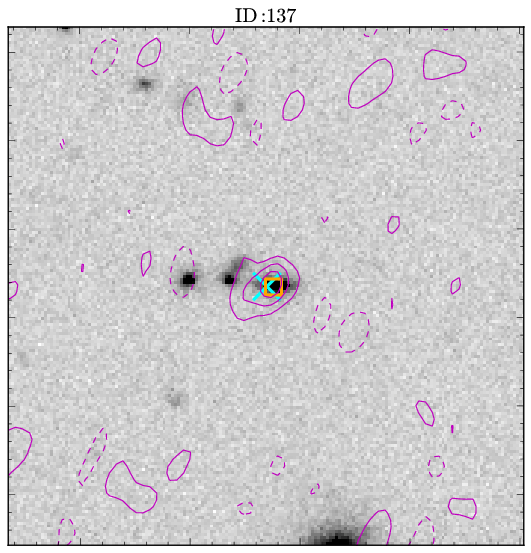
In Fig. 12 we show our 3 GHz radio mosaic of the area hosting the western part of the supercluster. In this area we find eight 3 GHz radio sources with matched CFHTLS photometric redshifts between 0.35 and 0.50. We show zoomed-in images of the host galaxies in the optical with radio contours overlaid in Fig. 13. No large radio galaxies are found within and around the X-ray identified cluster structure.
The properties of the radio sources are listed in Table 4. Four out of the eight sources are hosted by red galaxies, one has a colour consistent with blue galaxies, and two have host galaxy colours consistent with the green valley (upper part of the blue cloud; see Fig. 10). A visual inspection of the host galaxies shows that the colours are, as expected, linked to the morphologies of the galaxies (e.g. Strateva et al. 2001). The red galaxies are elliptical, while the blue galaxies show spiral features.
The 3 GHz luminosity densities of the sources (assuming a spectral index of ) are in the range of W Hz-1. Three out of the eight radio sources can be associated with the central regions of X-ray clusters or VTA identified overdense structures (VLA-XXL ID = 072 in XLSSC 083, VLA-XXL ID = 075 in VTA02 and VLA-XXL ID = 093 in XLSSC 086). The host galaxies of these are among the four brightest galaxies in the cluster/overdense structure. In particular, the host galaxy of VLA-XXL ID = 075 in the overdense structure VTA02 is the optically brightest galaxy in this structure.
| ID | RA | Dec | overdense structure ID | ||||
|---|---|---|---|---|---|---|---|
| [h m s] | [d m s] | [Jy beam-1] | [ W/Hz] | ||||
| (1) | (2) | (3) | (4) | (5) | (6) | (7) | (8) |
| 114 | 02 11 31.27 | -06 14 16.84 | 59.5 9.5 | 0.41 | 3.2 0.5 | 1.09 | … |
| 75 | 02 10 57.88 | -06 14 00.62 | 287.0 10.8 | 0.41 | 16.1 0.6 | 1.56 | VTA02 |
| 115 | 02 11 32.15 | -06 12 49.11 | 74.5 8.7 | 0.40 | 3.9 0.4 | 1.62 | XLSSC 085 |
| 72 | 02 10 56.76 | -06 11 58.37 | 72.2 9.7 | 0.41 | 4.0 0.5 | 1.59 | XLSSC 083 |
| 87 | 02 11 08.73 | -06 10 10.38 | 66.6 10.5 | 0.49 | 5.5 0.8 | 1.02 | XLSSC 086 |
| 93 | 02 11 13.86 | -06 09 39.96 | 74.9 10.8 | 0.40 | 4.0 0.5 | 1.28 | XLSSC 086 |
| 137 | 02 11 48.62 | -06 13 27.91 | 80.6 11.7 | 0.42 | 4.6 0.6 | 0.71 | VTA07 |
| 134 | 02 11 46.09 | -06 16 36.59 | 91.7 12.0 | 0.50 | 7.9 1.0 | 1.50 | … |
4 Discussion
4.1 Constraining total masses of the overdensitites
In Pompei et al. (2015) the six westernmost X-ray detected clusters in the XLSSC-e supercluster have been spectroscopically confirmed in the region of interest to lie at within an extent of on the sky (or a physical extent of Mpc2 at ). Using the XXL X-ray data they have also computed the virial masses within the radius encompassing 500 times the critical density of the six clusters to be in the range of M . This yields a total mass of all six of the westernmost X-ray detected clusters of (see Table 1 in Pompei et al. (2015); see also Table 3 in Pacaud et al. (2015)).
Additionally, ten VTA identified overdense structures have not been identified as X-ray clusters, presumably because their X-ray emission falls below the X-ray cluster detection threshold. Nevertheless, for these overdense structures we can put upper limits on their X-ray properties as follows. The upper limits on VTA overdense structures were calculated using upper limits on the count rates in a 300 kpc aperture centred at the middle of the optical structures listed in Table 3. The method consists of the Bayesian approach for calculating X-ray aperture photometry described in detail in J. Willis et al. (in prep.). It computes values and bounds for the intensity of the source (S) using counts and exposure data obtained in source and background apertures. It calculates the background-marginalised posterior probability distribution function of the source intensity (S), assuming Poisson likelihoods for the detected number of source counts and background counts in the given exposure time. The mode of this PDF is determined, and the lower and upper bounds of the confidence region are determined by summing values of the PDF alternately above and below the mode until the desired confidence level is attained. When the mode is at S=0 or the calculation for the lower bound reaches the value S=0, only the upper confidence bound is evaluated, which is considered an upper limit. With this upper limit on the count rate in a 300 kpc aperture we used the mass-temperature relation of Lieu et al. (2015) (hereafter Lieu et al. (2015)) and the luminosity-temperature relation of Giles et al. (2015), (hereafter Giles et al. (2015)) to calculate upper limits on the mass of the VTA overdense structures. Starting with an initial estimate of the temperature of the object, we use the relation to evaluate the mass and the radius corresponding to the overdense structure of 500 times the critical density. We integrate the given count rate to compute the X-ray luminosity up to , and re-estimate the temperature predicted from the corresponding relation. We re-iterate until we converge on the value of the temperature. The calculations for the upper limits are given in Table 3. For VTA10 we masked two AGN point sources leaving only 48% of the area of the 300 kpc aperture for the calculation of the upper limit on the flux. As expected, the upper limits on total masses estimated for our VTA-identified overdensities without X-ray detections are consistent with the structures being poor clusters or groups (e.g. Vajgel et al. 2014). A spectroscopic velocity dispersion of the structures would allow the classification of these structures (e.g. Dehghan & Johnston-Hollitt 2014). However, no such spectroscopic data is currently available.
4.2 Morphology and composition of the supercluster
As is evident from Fig. 11, the X-ray emission of the clusters XLSSC 082, 083, and 084 overlap into a morphologically elongated ensemble in the NW-SE direction. Our VTA analysis reveals multiple overdense structures of optical galaxies in the same field, three of which lie at the same redshift but are not detected in the X-ray (VTA01 - VTA03). Overdense structure VTA01 is located toward the SE from the ensemble revealed in the X-rays, and appears to be a distinct structure. The overdense structures VTA02 and VTA03 are located toward the south of the ensemble. The non-detection of the VTA-identified overdense structures in the X-ray data sets the upper limit to the combined total virial mass of these three overdense structures to 2.3 (see Table 3.).
The spatial distribution of red and blue galaxies in the X-ray ensemble (XLSSC 082, XLSSC 083, XLSSC 084) and VTA01-03 groups appears non-structured, i.e. there is no clear red-blue galaxy separation with increasing distance from the group centre, which suggests an unvirialised state of the groups. If this is the case, then the calculated virial masses may overestimate the real masses of these cluster candidates.
We find a 3 GHz radio source (VLA-XXL ID = 072) associated with the third brightest galaxy within the XLSSC 083 clusters close to the peak of the X-ray emission. Its monochromatic 3 GHz radio luminosity density is W Hz-1, and it is associated with a red-sequence galaxy (). This suggests that the radio synchrotron emission likely arises from a weak AGN within the galaxy, often found at the bottom of the gravitational potential wells of galaxy clusters (e.g. Smolčić et al. 2008, 2010).
The X-ray, radio and optical data combined, thus suggest that the bottom of the gravitational potential well is within the X-ray peak, and that the six clusters and overdense structures identified in this region (XLSSC 082, 083, 084 and VTA01, 02, 03) are likely in the process of merging and forming a larger structure. Based on the values calculated in Pompei et al. (2015), and using the upper mass limits given in Table 3, we can estimate that the upper limit to the total mass of the western structure after adding is .
The clusters XLSSC 085 and 086 are at a projected distance of and , respectively, from the XLSSC 083 cluster. This corresponds to a distance of and , respectively at . Our VTA identifies overdense structures associated with both clusters. The red-blue galaxy distribution in XLSSC 086 appears non-structured, and both structures show subclumping and elongated overdense structure features. It is interesting that the brightest galaxy (in the band) in XLSSC 086 is associated with a red galaxy toward the south of the X-ray emission, while the next three brightest galaxies (one of them hosting the radio source VLA-XXL ID = 093) are associated with the X-ray centroid. The E-W elongation of the X-ray emission of this cluster, supported by a similar elongation of the distribution of galaxies associated with VTA-identified overdense structures, suggests the existence of two substructures that are in the process of merging.
The X-ray detected cluster XLSSC 081 lies deg away from XLSSC 083 (see Fig. 11), while the cluster XLSSC 099 is located further to the east, deg from XLSSC 083. Furthermore, the VTA associates an elongated overdense structure of galaxies with this cluster. In addition to this cluster, our VTA has revealed seven more overdense structures toward the east of this cluster (VTA04-10), and a potential overdense structure toward the west (VTA07). All overdense structures identified in this region seem to have a non-segregated distribution of red and blue galaxies. This again suggests a dynamically young state for the structures. The X-ray emission coincident with VTA10 originates from two background X-ray sources, spectroscopically found to lie at and by SDSS and reported in Koulouridis et al. (2015).
In summary, the VTA resulted in the identification of seventeen overdense structures at , seven of which are associated with X-ray detected clusters, while the remaining 10 structures are likely groups. The full structure extends over on the sky, which corresponds to a size of Mpc2 at . Two main galaxy cluster agglomerations are located toward the east (XLSSC 081, XLSSC 099, VTA04-10) and west (XLSSC 082-086, VTA01-03) of this structure. The identified overdense structures seem unvirialised and dynamically young, suggesting that these structures are perhaps in the process of forming a larger structure. To shed further light on the dynamical state of the overdensity structures, in the next section we investigate the radio properties of the western cluster/group agglomeration covered by our 3 GHz observations.
4.3 Radio properties of the western cluster/group agglomeration
Previous studies used radio source counts and luminosity functions to investigate enhancement or supression of radio emission. Several authors have found that in the pre-merging stages the suppression of AGN activity has not yet reached the cluster core (Venturi et al., 1997, 2001) where radio AGN preferably reside (Dressler, 1980). A different situation is found in clusters that have already likely undergone the first core-to-core encounter and are now accreting smaller groups. In such cases, an excess in the number of blue galaxies is found at the expected positions of the shock fronts (Miller, 2005; Johnston-Hollitt et al., 2008) as the merging process has had enough time to influence the galaxies’ optical and radio properties. This implies that cluster mergers in later stages lower the probability of a galaxy developing an AGN (Venturi et al., 2000, 2001), but have also been shown to enhance the number of low-power radio galaxies driven by star formation (Miller, 2005; Johnston-Hollitt et al., 2008). In this sense, as can be seen in Fig. 12, the clusters XLSSC 082-084 are close to each other, and we find that the core of XLSSC 083 seems to be preserved. Thus it appears that the agglomeration of XLSSC 082-084 has not yet undergone the first core-to-core encounter. The cluster XLSSC 086 also contains a radio source within a red host galaxy at its centre, and we note the increase in number of blue galaxies between XLSSC 086 and the large cluster structure south-west of it, possibly indicating a shock front present in this area. This picture seems to be consistent with the merger process discussed by Venturi et al. (2001) - most massive structures are the first to undergo a merger (in this case XLSSC 082-084), and they later attract satellite structures of lower mass (in this case XLSSC 086, and possibly VTA02-03).
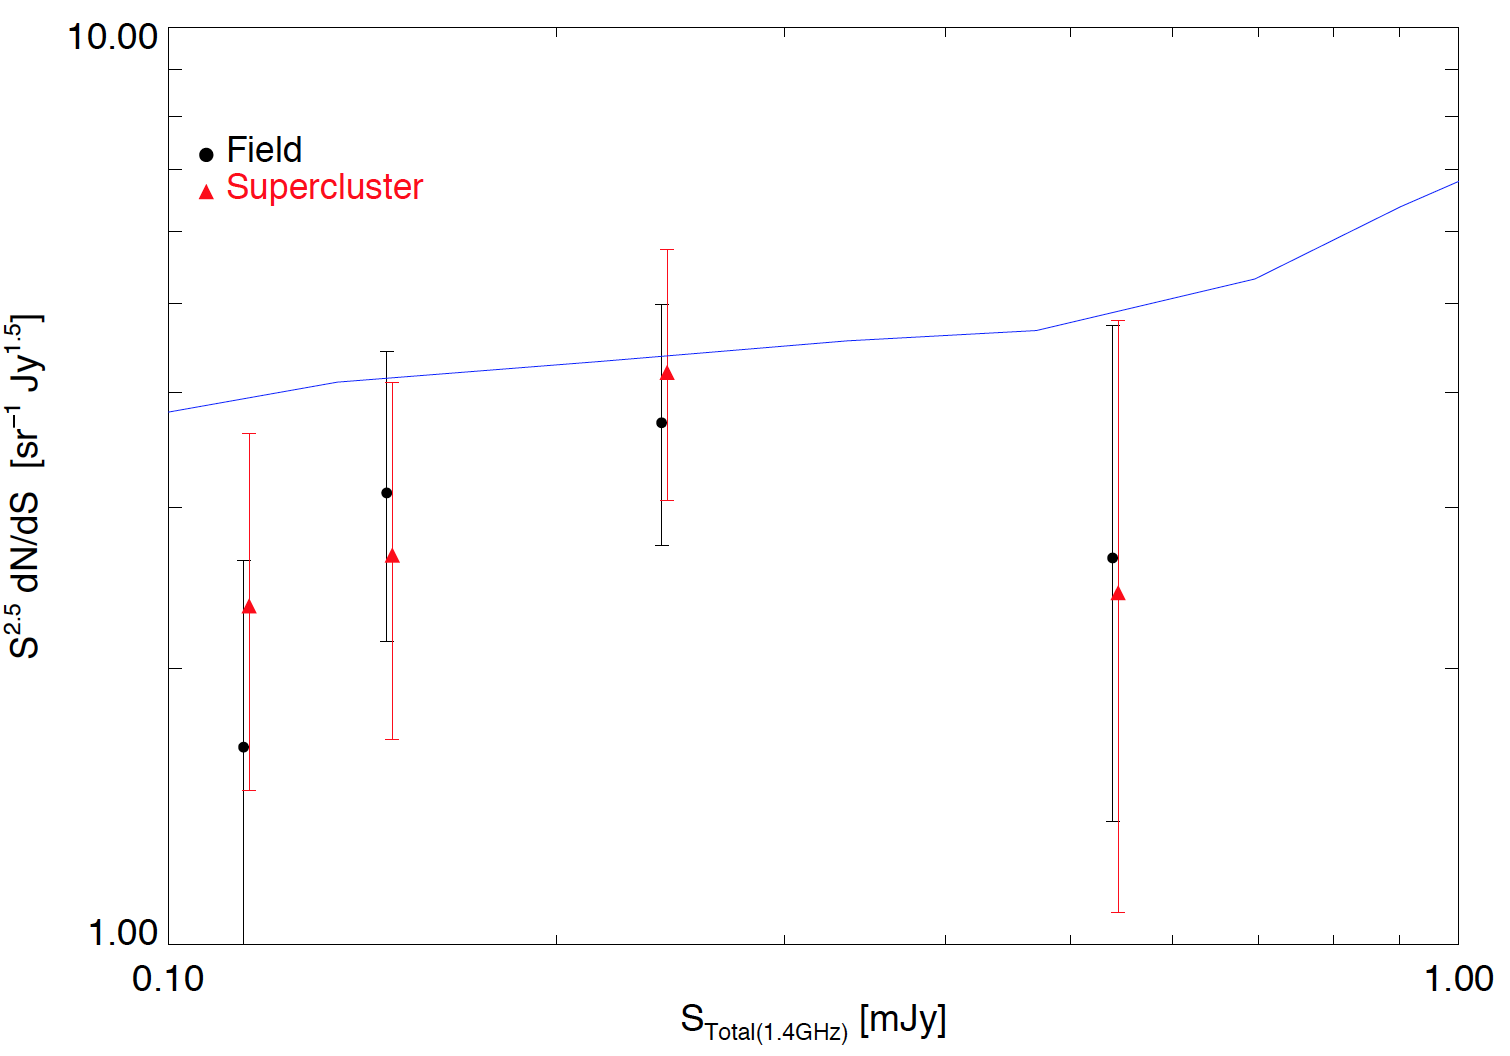
To further investigate this, in Fig. 14 we show the Euclidean normalised radio source counts for the supercluster area, and the field with good rms excluding the supercluster area, as well as the general field source counts taken from Condon et al. (2012). Given the low number of radio sources in our field the supercluster counts are consistent with those in the field. Our results suggest the radio counts within the supercluster may be slightly enhanced (suppressed) at low (high) fluxes relative to the field. This is similar to the suppresion of radio AGNs and an enhancement of low-power (likely star-forming) radio galaxies found in Shapely Supercluster (Venturi et al., 2000, 2002; Miller, 2005) and the Horologium-Reticulum Supercluster (Johnston-Hollitt et al., 2008) at 0.07. However, this is statistically not significant given the large error bars, and it prevents us from drawing further conclusions.
Our radio data probe . This limit is very close to the division between star-forming and AGN galaxies, thus in the range where volume densities of star-forming and AGN galaxies are comparable. Converting this limit to star formation rate (SFR) using the Bell (2003) relation yields SFR/year. Thus, our data are not deep enough to probe a potential enhancement of star-forming galaxies within the supercluster for . However, they are sensitive enough to detect powerful radio AGNs usually hosted by red galaxies (e.g. Best et al. 2006, Smolčić et al. 2008), if present within the supercluster.
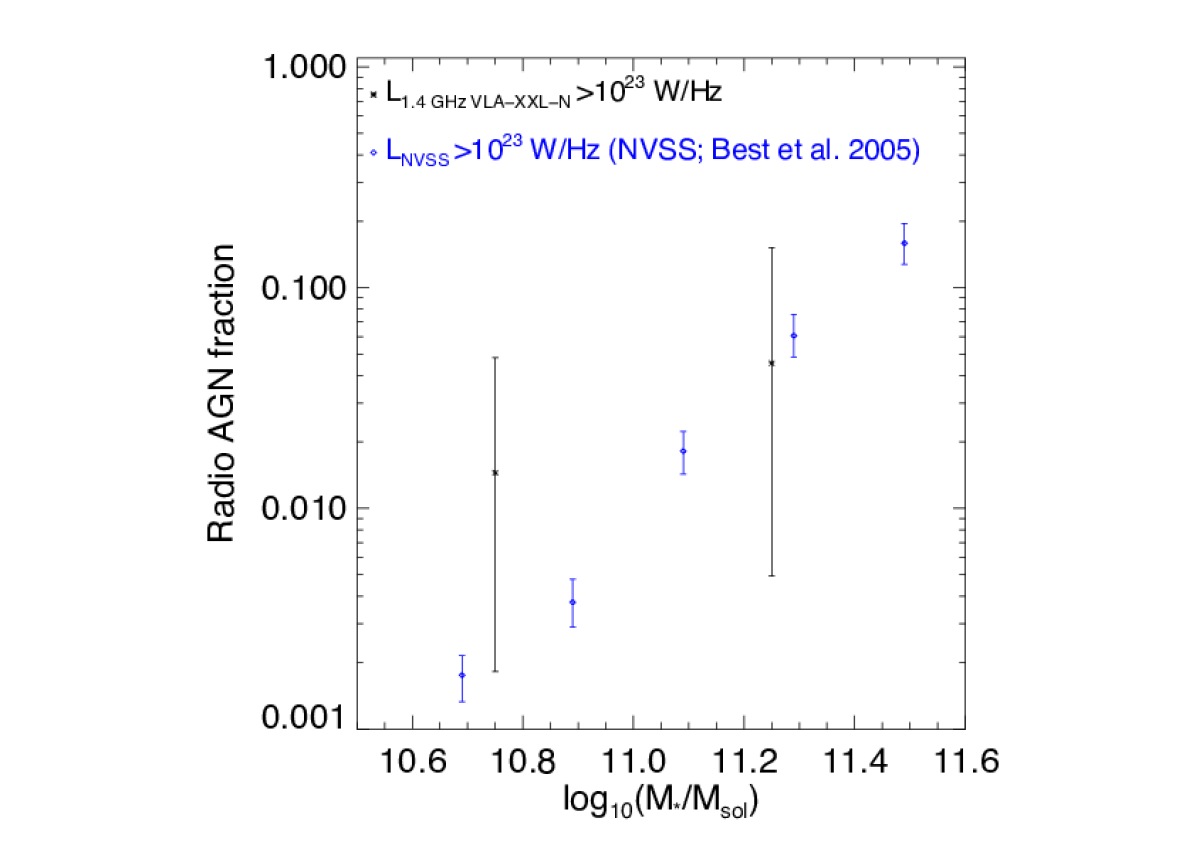
In Fig. 15 we show the fraction of red galaxies detected in the radio (radio AGNs, as mentioned above) with as a function of stellar mass for the region shown in the upper panel of Fig. 11. The fraction was calculated by taking the ratio of the number of red () galaxies from the supercluster area detected in the radio (see Tab. 4) with , and the number of optical red galaxies in the same field. The radio luminosity threshold was chosen to validate the comparison with the red galaxy fraction of NVSS-detected sources hosted by red galaxies from Best et al. (2005), and also shown in Fig. 15.
The fractions derived here for the general field derived by Best et al. (2005) agree well for masses above , however, for the fraction of radio AGNs is slightly higher than expected, although still within the errors.
If the excess in the fraction of radio detected galaxies of lower stellar mass () were real, it could be explained by the physical mechanisms in the cluster which favour the AGN activity in red galaxies. Best et al. (2005) find that richer environments preferably host radio AGN. For galaxies with stellar masses of they estimate a cooling rate of the order of magnitude of , which is consistent with a low-power radio AGN. This indicates that the cooling of gas in the hot atmosphere of the host galaxy is a plausible candidate for the fuel source of radio AGN in the cluster structure studied here. This leads to the possibility that this cluster structure is rich in cooling gas, and/or that the cooling gas is likely cospatial with the lower-mass galaxies.
In summary, by analysing the properties of radio sources within the structure, we conclude that the clusters and group candidates in the western agglomeration are likely in the pre-merger state, before the first core-to-core encounter. An increase in the surface density of blue galaxies between the XLSSC 086 and the XLSSC 082-084 agglomeration could indicate a formation of a shock front. Since the XLSSC 082-084 agglomeration is the most massive one in the area, it is likely that in the future the three most massive clusters will be the first to go radio silent, followed by the smaller satellite structures XLSSC 086 and VTA01-03.
5 Summary
We have presented observations of a subfield of the XXL-N 25 deg2 field with the VLA data at 3 GHz (10 cm). The final radio mosaic has a resolution of and encompasses an area of with Jy beam-1. The rms in the central area is Jy beam-1. From the mosaic we have extracted 155 sources with S/N, 8 of which are large, multicomponent sources. Of the 155 sources, we find optical counterparts for 123 sources within the CFHTLS W1 catalogue.
We also analysed the first supercluster discovered in the XXL project, partially located within the radio mosaic. Applying the Voronoi tessellation analysis using photometric redshifts from the CFHTLS survey have identified seventeen overdense structures at , seven of which are detected in the XMM-Newton XXL data. The structure is extended over on the sky, which corresponds to a size of Mpc2 at . No large radio galaxies are present within the overdense structures, and we associate eight (S/N7) radio sources with potential supercluster members. We find that the spatial distribution of the red and blue potential group member galaxies, selected by their observed colours, suggests that the groups are not virialised, but are dynamically young, which is consistent with the hierarchical structure growth expected in a CDM universe. Further spectroscopic follow-up is required for a more detailed analysis of the dynamical state of the structure.
Acknowledgements.
XXL is an international project based around an XMM Very Large Programme surveying two 25 deg2 extragalactic fields at a depth of erg cm-2 s-1 in the [0.5-2] keV band for point-like sources. The XXL website is http://irfu.cea.fr/xxl. Multiband information and spectroscopic follow-up of the X-ray sources are obtained through a number of survey programmes, summarised at http://xxlmultiwave.pbworks.com/. Funding Saclay group: long-term support by the Centre National d’Etudes Spatiales (CNES). F.P. : support from BMBF DLR grant 50 OR 1117 and support from the DfG Transregio Programme TR33. Zgal group: European Union’s Seventh Framework program under grant agreement 333654 (CIG, ’AGN feedback’; N.B., V.S.) and grant agreement 337595 (ERC Starting Grant, ’CoSMass’; V.S., J.D., O.Mi., M. N.). Italian and French groups: support from the International Programme for Scientific Cooperation CNRS-INAF PICS 2012. O.Me. acknowledges for the financial support provided by the European Union Seventh Framework Programme (FP7 2007-2013), grant agreement No 291823 Marie Curie FP7-PEOPLE-2011-COFUND (The new International Fellowship Mobility Programme for Experienced Researchers in Croatia - NEWFELPRO, project ”AGN environs in XXL”, Grant Agreement #83). We thank the referee for a very useful report. Authors of this paper acknowledge Olivier Ilbert’s valuable input. This work is based on observations obtained with XMM-Newton, an ESA science mission with instruments and contributions directly funded by ESA Member States and NASA. This work is also based on observations obtained with MegaPrime/MegaCam, a joint project of CFHT and CEA/DAPNIA, at the Canada-France-Hawaii Telescope (CFHT) which is operated by the National Research Council (NRC) of Canada, the Institut National des Sciences de l’Univers of the Centre National de la Recherche Scientifique (CNRS) of France, and the University of Hawaii. This research used the facilities of the Canadian Astronomy Data Centre operated by the National Research Council of Canada with the support of the Canadian Space Agency. CFHTLenS data processing was made possible thanks to significant computing support from the NSERC Research Tools and Instruments grant program.References
- Arnouts et al. (1999) Arnouts, S., Cristiani, S., Moscardini, L., et al. 1999, MNRAS, 310, 540
- Baldry et al. (2014) Baldry, I. K., Alpaslan, M., Bauer, A. E., et al. 2014, MNRAS, 441, 2440
- Becker et al. (1995) Becker, R. H., White, R. L., & Helfand, D. J. 1995, ApJ, 450, 559
- Bell (2003) Bell, E. F. 2003, ApJ, 586, 794
- Best et al. (2006) Best, P. N., Kaiser, C. R., Heckman, T. M., & Kauffmann, G. 2006, MNRAS, 368, L67
- Best et al. (2005) Best, P. N., Kauffmann, G., Heckman, T. M., et al. 2005, MNRAS, 362, 25
- Bondi et al. (2008) Bondi, M., Ciliegi, P., Schinnerer, E., et al. 2008, ApJ, 681, 1129
- Bourke et al. (2014) Bourke, S., Mooley, K., & Hallinan, G. 2014, in Astronomical Society of the Pacific Conference Series, Vol. 485, Astronomical Data Analysis Software and Systems XXIII, ed. N. Manset & P. Forshay, 367
- Chabrier (2003) Chabrier, G. 2003, PASP, 115, 763
- Condon et al. (2012) Condon, J. J., Cotton, W. D., Fomalont, E. B., et al. 2012, ApJ, 758, 23
- Condon et al. (1998) Condon, J. J., Cotton, W. D., Greisen, E. W., et al. 1998, AJ, 115, 1693
- Coupon et al. (2009) Coupon, J., Ilbert, O., Kilbinger, M., et al. 2009, A&A, 500, 981
- Dehghan & Johnston-Hollitt (2014) Dehghan, S. & Johnston-Hollitt, M. 2014, AJ, 147, 52
- Dickinson et al. (2003) Dickinson, M., Giavalisco, M., & GOODS Team. 2003, in The Mass of Galaxies at Low and High Redshift, ed. R. Bender & A. Renzini, 324
- Dressler (1980) Dressler, A. 1980, ApJ, 236, 351
- Driver et al. (2011) Driver, S. P., Hill, D. T., Kelvin, L. S., et al. 2011, MNRAS, 413, 971
- Driver et al. (2009) Driver, S. P., Norberg, P., Baldry, I. K., et al. 2009, Astronomy and Geophysics, 50, 12
- Durret et al. (2011) Durret, F., Adami, C., Cappi, A., et al. 2011, A&A, 535, A65
- Erben et al. (2013) Erben, T., Hildebrandt, H., Miller, L., et al. 2013, MNRAS, 433, 2545
- Gehrels (1986) Gehrels, N. 1986, ApJ, 303, 336
- Giles et al. (2015) Giles, P. A., Maughan, B. J., Pacaud, F., et al. 2015, ArXiv e-prints
- Grogin et al. (2011) Grogin, N. A., Kocevski, D. D., Faber, S. M., et al. 2011, ApJS, 197, 35
- Helfand et al. (2015) Helfand, D. J., White, R. L., & Becker, R. H. 2015, ApJ, 801, 26
- Heymans et al. (2012) Heymans, C., Van Waerbeke, L., Miller, L., et al. 2012, MNRAS, 427, 146
- Hildebrandt et al. (2012) Hildebrandt, H., Erben, T., Kuijken, K., et al. 2012, MNRAS, 421, 2355
- Hinshaw et al. (2013) Hinshaw, G., Larson, D., Komatsu, E., et al. 2013, ApJS, 208, 19
- Ilbert et al. (2006) Ilbert, O., Arnouts, S., McCracken, H. J., et al. 2006, A&A, 457, 841
- Jelić et al. (2012) Jelić, V., Smolčić, V., Finoguenov, A., et al. 2012, MNRAS, 423, 2753
- Johnston-Hollitt et al. (2008) Johnston-Hollitt, M., Sato, M., Gill, J. A., Fleenor, M. C., & Brick, A.-M. 2008, MNRAS, 390, 289
- Kimball & Ivezić (2008) Kimball, A. E. & Ivezić, Ž. 2008, AJ, 136, 684
- Koekemoer et al. (2011) Koekemoer, A. M., Faber, S. M., Ferguson, H. C., et al. 2011, ApJS, 197, 36
- Koulouridis et al. (2015) Koulouridis, E., Poggianti, B., Altieri, B., et al. 2015, ArXiv e-prints
- Lieu et al. (2015) Lieu, M., Smith, G. P., Giles, P. A., et al. 2015, ArXiv e-prints
- Miller (2005) Miller, N. A. 2005, AJ, 130, 2541
- Mooley et al. (2015) Mooley, K. P., Hallinan, G., Frail, D. A., et al. 2015, in American Astronomical Society Meeting Abstracts, Vol. 225, American Astronomical Society Meeting Abstracts, 113.05
- Novak et al. (2015) Novak, M., Smolčić, V., Civano, F., et al. 2015, MNRAS, 447, 1282
- Oklopčić et al. (2011) Oklopčić, A., Smolčić, V., Giodini, S., et al. 2011, Mem. Soc. Astron. Italiana, 82, 161
- Pacaud et al. (2015) Pacaud, F., Clerc, N., Giles, P. A., et al. 2015, ArXiv e-prints
- Pierre et al. (2015) Pierre, M., Pacaud, F., Adami, C., et al. 2015, ArXiv e-prints
- Pompei et al. (2015) Pompei, E., Adami, C., Eckert, D., et al. 2015, ArXiv e-prints
- Ramella et al. (2001) Ramella, M., Boschin, W., Fadda, D., & Nonino, M. 2001, A&A, 368, 776
- Rau & Cornwell (2011) Rau, U. & Cornwell, T. J. 2011, A&A, 532, A71
- Scoville et al. (2007) Scoville, N., Aussel, H., Brusa, M., et al. 2007, ApJS, 172, 1
- Smolčić et al. (2007) Smolčić, V., Schinnerer, E., Finoguenov, A., et al. 2007, ApJS, 172, 295
- Smolčić et al. (2008) Smolčić, V., Schinnerer, E., Scodeggio, M., et al. 2008, ApJS, 177, 14
- Smolčić et al. (2010) Smolčić, V., Zamorani, G., Schinnerer, E., et al. 2010, ApJ, 708, 909
- Strateva et al. (2001) Strateva, I., Ivezić, Ž., Knapp, G. R., et al. 2001, AJ, 122, 1861
- Vajgel et al. (2014) Vajgel, B., Jones, C., Lopes, P. A. A., et al. 2014, ApJ, 794, 88
- van de Weygaert & Icke (1989) van de Weygaert, R. & Icke, V. 1989, A&A, 213, 1
- Velander (2012) Velander, M. B. M. 2012, PhD thesis, Leiden Observatory, Leiden University, PO Box 9513, 2300 RA, Leiden, the Netherlands
- Venturi et al. (1997) Venturi, T., Bardelli, S., Morganti, R., & Hunstead, R. W. 1997, MNRAS, 285, 898
- Venturi et al. (2000) Venturi, T., Bardelli, S., Morganti, R., & Hunstead, R. W. 2000, MNRAS, 314, 594
- Venturi et al. (2002) Venturi, T., Bardelli, S., Zagaria, M., Prandoni, I., & Morganti, R. 2002, A&A, 385, 39
- Venturi et al. (2001) Venturi, T., Bardelli, S., Zambelli, G., Morganti, R., & Hunstead, R. W. 2001, MNRAS, 324, 1131