Extreme Scaling of Supercomputing with Stranded Power: Costs and Capabilities
Abstract
Power consumption (supply, heat, cost) and associated carbon emissions (environmental impact) are increasingly critical challenges in scaling supercomputing to Exascale and beyond. We proposes to exploit stranded power, renewable energy that has no value to the power grid, for scaling supercomputers, Zero-Carbon Cloud (ZCCloud), and showing that stranded power can be employed effectively to expand computing [1].
We build on those results with a new analysis of stranded power, characterizing temporal, geographic, and interval properties. We simulate production supercomputing workloads and model datacenter total-cost-of-ownership (TCO), assessing the costs and capabilities of stranded-power based supercomputing. Results show that the ZCCloud approach is cost-effective today in regions with high cost power.
The ZCCloud approach reduces TCO by 21-45%, and improves cost-effectiveness up to 34%. We study many scenarios. With higher power price, cheaper computing hardware and higher system power density, benefits rise to 55%, 97% and 116% respectively. Finally, we study future extreme-scale systems, showing that beyond terascale, projected power requirements in excess of 100MW make ZCCloud up to 45% lower cost, for a fixed budget, increase peak PFLOPS achievable by 80%.
I Introduction
With the end of Dennard scaling [2, 3], power is an increasingly important concern for supercomputing centers. Today’s 10-petaflop systems draw more than 10 MW [4, 5], and near-exascale machines announced by the US DOE will exceed 15MW [6, 7], with Exascale systems now expected to exceed 25MW, despite earlier lower projections [3]. Numerous centers already operate under power “caps” due to local utility contracts or concerns about carbon footprint [8]. In other recent cases, centers have had forced power reductions due to regional and national emergencies [9]. Thus, there is broad agreement that power, including both its direct cost, as well as implied costs in cooling, facilities, and the associated environmental impact [10, 11, 12] are a major challenge for extreme-scaling of supercomputers.
Recent research explores new approaches to scaling supercomputing and datacenters [13, 14]. Our previous work proposes to power datacenters exclusively based on stranded power – uneconomic or wasted power generated from variable renewable generators such as wind, called ZCCloud [15, 16, 1]. The ZCCloud approach exploits power that in “grid markets” is not worth transmission and use. Such “stranded power” (SP) occurs in contemporary power grids due to renewable power generation variation and geographic dispersal. Such power is easily identified in market-based dispatch systems – it has a negative price – the grid would literally pay the producer to not generate the power.
Stranded power is a remarkably large, untapped resource. For example, in 2014 the MISO power grid curtailed 2.2 terawatt-hours (TWh) of power and 5.5 TWh at negative price for a total of 7.7 TWh of stranded power from wind resources alone [17, 18, 1]. We analyzed 70 million transactions from a 28-month period for the Midcontinent Independent System Operator (MISO) power market, one of the largest power grids in the United States, serving 42 million people and clearing $37B of power annually. The detailed characterization showed that stranded power has sufficient availability (up to 80% duty factor) and quantity (100’s of MW) to support large-scale computing, and demonstrated that stranded power can support a production supercomputing workload with good productivity.
We build on those results, combining new cost analysis (TCO) with prior productivity results to create a comparison of cost-effectiveness. First, we present models for stranded power that characterize its temporal, geographic, and interval properties. Next, we combine those insights with a TCO model from [19] and study varied supercomputer scaling scenarios, varying size and approach. ZCCloud computing resources are co-located with renewable generation and deployed incrementally in single or groups of containers. This approach eliminates building costs, enables free-cooling to lower cooling costs, and easy scaling. Co-location eliminates power transmission. Specifically, we compare the productivity and cost of each system type under a variety of power cost, compute hardware cost, and system power density scenarios. Overall, these studies provide a perspective on the geographies and scenarios where ZCCloud is attractive. Finally we examine extreme scaling at Exascale, and beyond. Specific contributions include:
-
1.
Compare supercomputer scaling expansion based on traditional and ZCCloud model (stranded green power as the only supply) showing these volatile resources can match the throughput of conventional approaches.
-
2.
Show that ZCCloud-based scaling produces nearly 50% lower capital cost and 34% greater cost-effectiveness (throughput/$) in a basic scaleup comparison
-
3.
Varying power price, we show that ZCCloud is already attractive in regions with high-cost power today, achieving 55% better cost-performance.
-
4.
Exploring competing future hardware pricing trends: End of Moore (commoditization) and Difficult Scaling (per-chip cost with scaling), we show ZCCloud’s advantage increases with cheaper hardware, up to 97% more cost-effective at 0.25x cost.
-
5.
Exploring system power density (end of Dennard), show ZCCloud has 116% better cost-effectiveness if power densities increase 5-fold (projected within ten years)
-
6.
Exploring Exascale and beyond, we show that growing power and physical infrastructure costs enable ZCCloud to both reduce capital cost by 45% and increase peak PFLOPS by 80% under a fixed budget.
The paper organization is as follows: Section II introduces the background on renewables, power markets, and datacenter costs. Section III summarizes the ZCCloud approach and describes the origin of stranded power. We assess the capabilities of ZCCloud in Section IV, study cost in Section V, and cost-performance in Section VI. We explore extreme scaling in Section VII and related work in Section VIII. Section IX summarizes and proposes directions for future work.
II Background
In this section, we first introduce the growth of renewable power and operation of energy markets. Then we summarize key elements in optimizing datacenter costs.
Renewable Power Fossil fuels are the largest source of carbon dioxide emissions, and are widely believed to be driving climate change [12]. Such concerns drive the rapid development of renewable energy generation. Growth of solar and wind is the most rapid, comprising 5.2% of US electricity generation in 2014 [20] with wind supplying 80% of that. In many states renewable power levels of more than 10% have already been achieved. For example, California is at 20% renewable portfolio standard (RPS) in 2010 [21]. More ambitious RPS goals have been adopted: 50% by 2030 in California [22], 25-31% by 2025 in Minnesota, and 50% by 2030 in New York. President Obama released the “Clean Power Plan” in August 2015 that establishes the national standards to limit carbon pollution from power plants. In 2015, the U.S. Department of Energy Wind Program announced a 35% RPS, 404GW goal for wind by 2050 [23].
Power Grid and Energy Market Modern ISO’s dispatch generation and price power generation in real time. For example, the Mid-continent ISO (MISO) market [24] uses 5-minute intervals: generators offer power to the grid, and it prices their offered power with locational marginal price (LMP), which varies by site and depends on transmission structure and supply-demand balance. An important goal for power purchase is “merit order”, where lower prices have higher priority. Scheduling power is difficult because generation and demand must be matched instantaneously and in general power is not stored. Any sudden change in demand or supply must be addressed. So, to ensure stability or when there is overgeneration or transmission congestion, the result is stranded power. Information and Communication Technologies (ICT) are the fastest growing use of power [25].
Datacenter Cost and Efficiency Today’s peta-scale supercomputers are comprised of thousands of servers, requiring 10’s of megawatts of electricity, and thousands of sqft. To accommodate, datacenters provide physical space, cooling, and power. Building and operating datacenters is expensive, reaching 10 to 100 million dollars per year [26, 6, 7]. With the goal of maximizing processing, managing costs requires a focus on cost efficiency [27]. Dominant elements of cost are compute servers and datacenter facilities, comprising more than 75% of total cost of ownership (TCO) [27]. Other cost factors include power, system administration, power transmission, and data networking. [28, 29, 19]
III Supercomputing with Stranded Power
III-A ZCCloud Approach
To address growing power, physical space, and cooling requirements, supercomputer centers regularly build or expand power infrastructure, machine rooms, and cooling [1] at costs of millions of dollars. We study Zero-Carbon Cloud (ZCCloud), a new approach that exploits stranded power that is not accepted by the grid. ZCCloud deploys computing resources in decentralized containers on wind generation site, exploiting stranded power to escape these limits and scale supercomputers to higher levels of capability and performance,

Power grids must balance match generation and load in real-time However, intrinsic variability of renewable generation (wind, solar, etc.) creates major challenges. To ensure reliable power power, there is often oversupply and transmission congestion that prevents generated power from reaching loads.
Stranded power is excess generation that cannot be admitted to the power grid (curtailment) or is accepted at negative prices (uneconomic power). ZCCloud connects computing resources directly to generators, avoiding congestion, and providing direct access to stranded power. This approach also minimizes infrastructure for power transmission and distribution, eliminates building costs, and enables free-cooling, and easy scaling. ZCCloud resources are only active when stranded power is available, so they do not compete with normal grid loads. Figure 1 shows a ZCCloud deployment on a wind farm. ZCCloud’s modular approach enables simple scaleup by deploying more containers. Because modern commercial wind farms are 300 MW or larger, significant scale computing resources can be deployed on a single site, simplifying networking and administration.
ZCCloud uses stranded power as its only power source, and thus only operates when stranded power is available and shut down when there is no stranded power. Short-term energy storage (e.g. batteries) and SSD’s are used to enable checkpointing and workload migration within a short period before ZCCloud downtime. We do not deploy sufficient energy storage that guarantees always-on service, because energy storage today is extremely expensive (more details will be discussed later). Since ZCCloud resources are intermittent, we deploy them as a complementary extension, rather than a replacement of supercomputers such as ALCF’s Mira system (see Figure 2). ZCCloud resources are paired with traditional datacenter supercomputing system such as Mira, using a high-speed network to share a single filesystem, workload and scheduler. During ZCCloud uptime, jobs submitted to this mixed system are assigned to either traditional resources or ZCCloud resources. When ZCCloud is off, jobs go only to the datacenter supercomputing resources.

III-B Stranded Power
Power grid scheduling attempts to match production to demand, but the variability of power generation resulted from a growing cadre of renewable sources (wind, solar) is a big challenge to effectively utilize and maintain grid stability [17, 30]. When overproduction occurs due to ramp or transmission congestion limits, modern power markets will price the excess power with low or negative locational marginal price (LMP). In response, generators will avoid putting power into the grid – even discarding it – to minimize loss. Such reductions are called “curtailment”, “spillage”, or “dispatch down”. We define Stranded Power (SP) as all offered generation with no economic value, thus including both spillage and delivered power with zero or negative LMP.
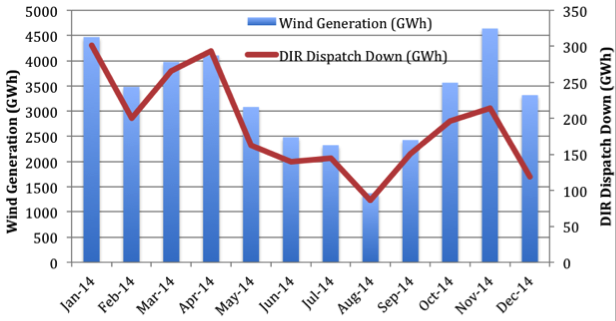
Nationally, wind generation is 7x solar, so we focus on wind power. Figure 3 shows the monthly wind generation and dispatch down of Mid-continent Independent System Operator (MISO). In 2014, the total dispatch down was 2.2 terawatt-hours, and 183 MW in average, 7% of wind generation. Comparable waste exists in other regions of the US [21], and many European countries such as Denmark, Germany, Ireland, and Italy [31]. Waste is projected to increase with higher renewable portfolio standard (RPS) [30, 22].
We quantitatively characterize stranded power by analyzing MISO’s real-time offers [24] ( LMP and generation data in 5-minute increments from 1/1/2013 to 4/14/2015). The MISO market manages power for 1,259 generations site, 200 of which are wind sites, across more than 10 states in the US. Wind power is the largest source of renewable power in MISO and accounts for 10% of production.
We focus on two properties of stranded power: quantity and temporal distribution. Quantity is reported in megawatts or megawatt-hours, and temporal distribution as duty factor – the fraction of time when stranded power is available. Two families of stranded power models are used:
-
1.
Instantaneous Stranded Power (LMP{C}): LMPC
for a 5-minute interval. -
2.
NetPrice Stranded Power (NetPrice{C}): NetPriceC
for a period.
| (1) |
We pick the sites with highest duty factors for each SP model, and characterize their quantities and duty factors of stranded power.
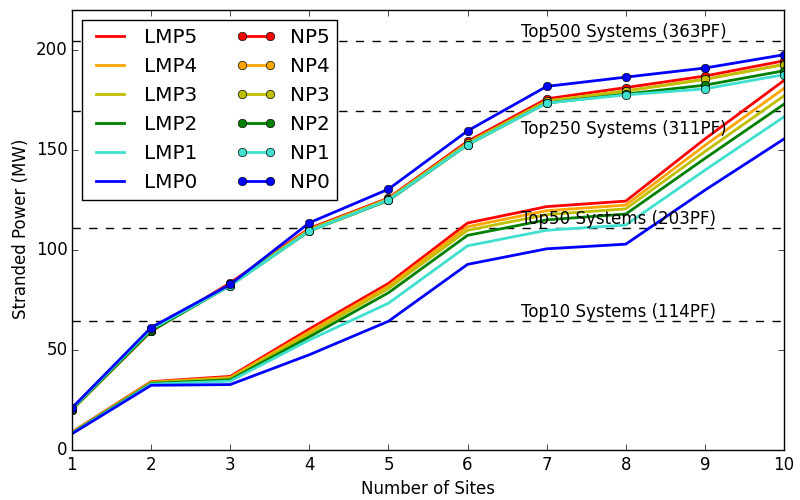
Quantity Our studies show the quantity of stranded power can be large. Figure 4 plots stranded wind power under different definitions with various numbers of sites. It compares the stranded power available (MW) to the total power consumption of Top500 supercomputing systems [32]. With the LMP model, two sites can support the Top 2 systems and five sites are enough for the Top 10 systems. For NetPrice (NP), stranded power from a single site can support the top supercomputer (20MW); only two sites are needed for the top 10 systems. Of course, there is more stranded power in other regions beyond MISO.
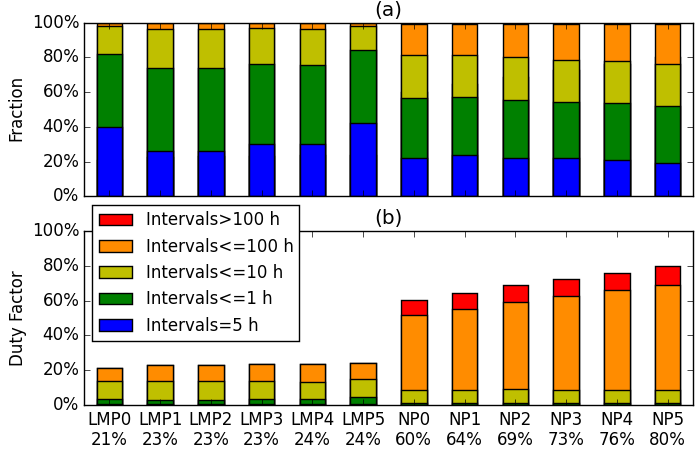
Temporal Distribution We characterize the time periods when stranded power is available, calling them SP intervals. Figure 5 shows the distribution of SP intervals for different SP models. For LMP, 70% of SP intervals are shorter than 1 hour, and overall duty factors are less than 30%. For NetPrice the situation is much better with half of the SP intervals 1 hour. These longer intervals provide an overall duty factor between 60% and 80%. The longer intervals and greater duty factor arise from NetPrice’s masking of brief fluctuations in LMP.
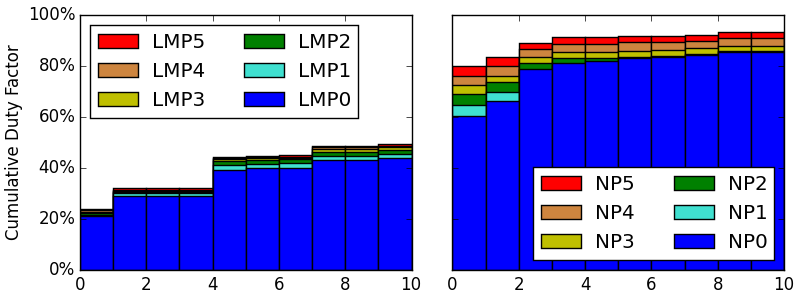
Combined Temporal Distribution Is it possible to further improve duty factor by combining multiple sites? We calculate the cumulative duty factors across sites. (see Figure 6). For LMP, more generation sites increases cumulative duty factor slowly, reaching 30% for 2 sites, and 50% for 7 sites. NetPrice yields much higher duty factors of more than 80% for only three sites. However, since there are periods with zero stranded power in the grid, it appears impossible to achieve a 100% duty factor even with a large number of sites.
Is 100% Duty Factor Achievable with Storage? Likewise, employing sufficient energy storage to achieve 100% duty factor is uneconomic. MISO studies show periods without stranded power can be as long as 300 hours, requiring more than $400M energy storage for 4MW, approximately 4x the computing hardware cost [33]. Coverage for 24-hour period is more than $40M, nearly 1/2 the computing hardware cost.
In conclusion, stranded power from one or a few wind generation sites is sufficient to power large supercomputers. Such power can be available for up to 80% of the time. The results are encouraging for stranded power-based computing.
IV Capabilities of Intermittent Resources
To assess the performance benefit of adding intermittent computing resources to traditional datacenter, we simulate HPC workloads first with a daily periodic model, and then with a more complex set of uptime intervals derived from a single wind generation site’s stranded power – derived from real MISO power grid statistics. We vary system configurations, and compare system throughput.
IV-A Methodology
System Model We use ALCF’s Mira system [26] as a model for traditional datacenters resources, a 10 PFlop IBM BG/Q system with 49,152 nodes, 786,432 cores, and 768 TB memory. Intermittent resources (ZCCloud) are connected to datacenter (Ctr) as an extension, denoted “Ctr+Z”. We compare Ctr+Z with datacenter-only system (Ctr). Moreover, we consider ZCCloud extension at varied scale: 1x, 2x, and 4x of Mira resources, denoted Ctr+1Z, Ctr+2Z, and Ctr+4Z. For fair comparison, we also scale datacenter resources to 2x, 3x, and 5x of Mira, denoted 2Ctr, 3Ctr, and 5Ctr, and use 1Ctr as baseline. Note that Ctr+{n}Z is of the same size as {n+1}Ctr.
Job Scheduling and Workload We simulate ALCF job trace [26] using Mira’s job scheduler, Cobalt v0.99 integrated with a simulator, Qsim [34]. Workload properties are summarized in Table I. Workloads are scaled to match utilization on Mira, adding jobs with the same distributions of attributes (job size is not increased). On Ctr+Z configuration, the scheduler assigns jobs equally to datacenter and ZCCloud resources when ZCCloud is available, and only to the datacenter when ZCCloud is shutdown. Because the NetPrice models produce stranded-power dominated by intervals of 10 hours or more (longer than most runs), our simulations give the the job scheduler information on the length of ZCCloud intervals, scheduling only jobs that can complete before ZCCloud shutdown.
| Parameters | Values |
|---|---|
| # Jobs | 78,795 |
| Time Period | 12/31/2013—12/30/2014 |
| Runtime (hrs) | 0.004—82, Avg 1.7, StDev 3.0 |
| # Nodes | 1—49,152, Avg 1,975, StDev 4,100 |
| Rsc Utilization | 84% of Mira (100% availability) |
| App Domains | Physics, Chemistry, Material Science, CompScience, Biology, Engineering |
Intermittent Resource Models Two resource models: (1) Periodic intermittent resources: power is available in a fixed daily cycle, (e.g. 8:00 to 20:00 each day), and (2) Stranded-Power-based (SP-based) resources: single-site stranded power history from MISO [24] as described in Section III-B. To normalize between them, we use duty factor, the fraction of time resources are available. For example, a periodic model with uptime 8:00-20:00 has 50% duty factor, and an SP-based model using LMP0 has 21% duty factor.
Metrics Throughput (number of jobs per day) quantifies system capability.
IV-B Periodic Intermittent Resources
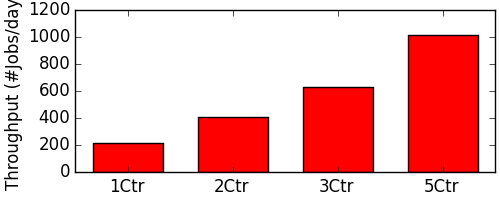
We first explore the scaling of traditional datacenter resources (see Figure 7). The system throughput of Ctr scales linearly with resources, reaching throughput of 200 jobs/day (1Ctr), and 1000 jobs/day with 5x resources (5Ctr).
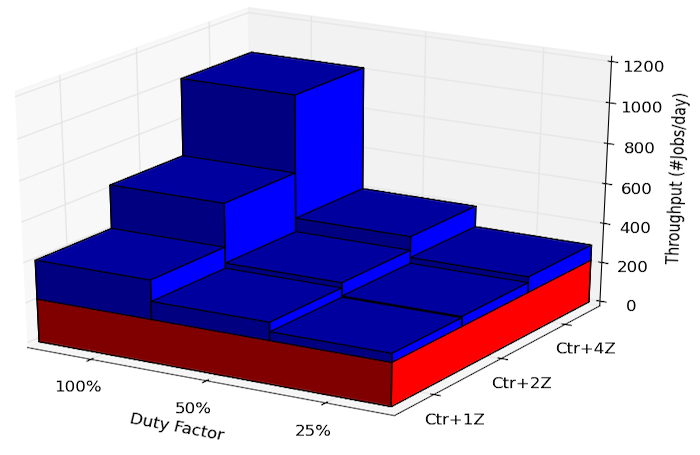
Next, we evaluate the benefits of periodic intermittent resources, varying duty factor and system size (Figure 8). System throughput of Ctr+{n}Z is greater than that of 1Ctr in all cases, but less than {n+1}Ctr because of its frequent downtime. As expected, at a duty factor of 100%, in which ZCCloud resources are always available, the capability of Ctr+{n}Z matches {n+1}Ctr.
For periodic resources, increasing duty factor improves throughput more significantly than adding intermittent resources. For example, while {Ctr+1Z, 50% duty factor} and {Ctr+2Z, 25% duty factor} both provide 1.5x of 1Ctr node hours, the former achieves 15% higher throughput than the latter.
IV-C Stranded Power-Based Resources
We consider four cases of SP-based resources, using different SP models including LMP0, LMP5, NetPrice0, and NetPrice5. As we have described in Section III-B, the corresponding duty factors are 21%, 24%, 60%, and 80% respectively.
Figure 9 shows the throughput of SP-based resources for different SP models and scales. Again, Ctr+Z achieves better throughput than 1Ctr even for the worst case (LMP0, Ctr+1Z). The much higher duty factor of NetPrice models (60%) creates big advantage over LMP models. For example, at the scale of Ctr+1Z, NetPrice5 provides 1.8x of 1Ctr node hours while LMP5 only provides 1.24x. Throughput scales linearly with larger size and higher duty factor. This is because most jobs are relatively small compared to the system scale and ZCCloud uptime. For example, while job runtime is 1.7 hours in average and no longer than 82 hours, NetPrice5-based resources can provide uptime much longer than 100 hours. However, even with very high duty factor, Ctr+{n}Z is still less capable than {n+1}Ctr with the same amount of computing resources.
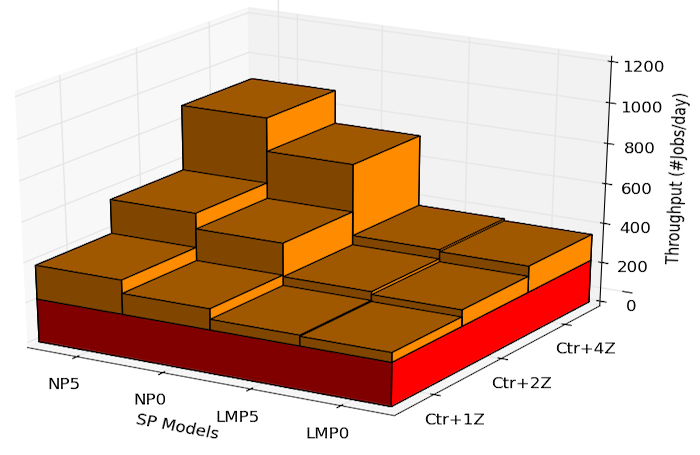
Overall, adding intermittent computing resources to a datacenter improves throughput, and the benefit is determined by duty factor and scale, so intermittent resources of a given scale provide less capability than traditional datacenter resources.
V Cost of Intermittent Resources
We have shown supercomputing capability can be scaled up using intermittent resources. ZCCloud uses stranded power and containers, lowering capital costs. We describe a total-cost-of-ownership (TCO) model for both datacenter and ZCCloud resources, applying it to quantify costs for different scaleup approaches.
V-A A Model for Total Cost of Ownership (TCO)
We define a simple TCO model, starting from excellent academic and industrial models [19, 29, 28, 27], simplifying by only including features that contribute more than 1% to TCO. For detailed discussion see Appendix A.
Our model includes several elements of cost: (1) computing hardware (e.g. servers, racks, networking), (2) datacenter (DC) physical facilities, e.g. building, raised floor, power distribution, etc., (3) electrical power,and (4) networking, the cost of fiber to an Internet backbone. Thus,
| (2) |
Where these costs are parameterized as annual operating cost per unit of system, and is the number of units. We use Mira as the unit of supercomputing system, which is 4MW, 10PFlops with a nominal cost of $100M. For example, if , such as 2Ctr, the system is 8MW in total. is a scale factor, used to model larger systems (in MW).
ZCCloud’s TCO differs from traditional datacenters in three ways: (5) additional energy and SSD storage to enable checkpointing, (6) reduced DCF cost, by using containers and colocating at generation sites and avoiding power distribution costs. This reduces physical facility costs significantly. (7) additional hardware for free cooling, and (8) ZCCloud uses stranded power, which is power that has no economic value in the power grid. We assume that this power can be used at zero cost, as this is often a better deal than the negative prices that wind generators suffer. Thus, the adjusted ZCCloud is follows:
| (3) |
| (4) |
where is the cost of container per unit, and denotes the free cooling hardware cost, amortized.
| Parameters | Values | Source |
|---|---|---|
| $21M/unit | Mira [26] | |
| $21M/unit | We assume = based on the case study in [27] | |
| $2.1M/unit | Annual electricity bill with US power price, $60/MWh [35] | |
| $0.8M | From [19] | |
| $0.3M/unit | Intel SSD [36] | |
| $0.1M/unit | Tesla PowerWall [33] | |
| $2M/unit | Vendor quote in [15] | |
| $0.3M/unit | Free cooling HW [19] | |
| 4MW/$100M | Mira [26] is the Unit, (1x) |


V-B Exploring TCO for ZCCloud Systems
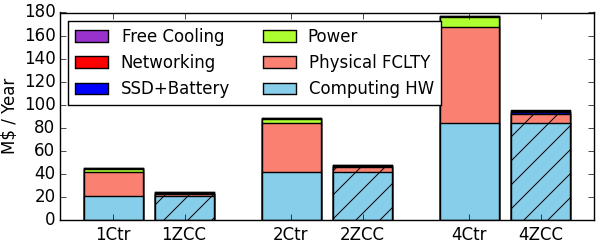
We calculate the costs of Ctr and ZCCloud systems for a range of different sizes and under different TCO assumptions (see Table III). In Figure 10, we illustrate our TCO model for the baseline costs (power price=$60/MWh, computing price=1x). Savings in physical infrastructure by avoiding power distribution and physical buildings, reduce ZCCloud resources capital costs by nearly half.111Note that networking, SSD, energy storage, and free cooling costs are relatively small compared to other three major components. Power cost is eliminated, so ZCCloud TCO is dominated by compute HW.
TCO vs System Size and Power Price We illustrate the TCO model, scaling system size from 1-5x, and power price from $30 to $360 / MWh ( ranging from $1.1M/unit to $12.6M/unit), matching the current wide range of power prices across the globe. We compare scaling traditional datacenters to ZCCloud, showing resulting TCO’s in Figure 11. Within each group, the higher power prices increase power cost of each system. But power cost is not dominant. The TCO of the Ctr+Z systems is less than corresponding Ctr systems because of their lower physical facility costs. At lowest power price, ($30/MWh), Ctr+1Z is 21% cheaper than 2Ctr, and at $360/MWh, Ctr+4Z is 45% cheaper than 5Ctr.
| Parameters | Values |
|---|---|
| n = 1, 2, 4 for {n+1}Ctr and Ctr+{n}Z | |
| 5.2, 10.5, 21, 26.2, 31.4 M$/unit (for compute price = 0.25x, 0.5x, 1x, 1.25x, and 1.5x) | |
| 1.1, 2.1, 4.2, 8.4, 12.6 M$/unit (for power price = 30, 60, 120, 240, 360 $/MWh) | |
| 1x, 2x, 3x, 4x, and 5x |

TCO vs System Size and Compute HW Price We explore the TCO model, varying the compute hardware cost (see Figure 12) from 0.25x to 1.5x, a range that encompasses commoditization (Intel processors at ARM prices) or slight increase due to expensive technology scaling. Scenarios with cheaper hardware increase the advantages of ZCCloud because compute hardware depreciation dominates ZCCloud costs. With computing hardware prices 0.25x of current level, Ctr+1Z is 34% cheaper than 2Ctr, and Ctr+4Z is 57% cheaper than 5Ctr. At high computing prices, ZCCloud benefits are reduced. For example, with 1.5x computing price, the cost of Ctr+1Z is 18% lower than 2Ctr, and Ctr+4Z is 30% lower than 5Ctr.
TCO vs System Size and System Power Density Exascale studies project that future supercomputers purchased for a given $$ budget will increase in power consumption to the end of Dennard Scaling. Their compute power increases at a higher rate. We consider the effect of this shifting balance on TCO (see Figure 13), seeing that physical facilities and power cost grow significantly, amplifying the benefits of ZCCloud. With 1x density, Ctr+4Z is 37% cheaper than 5Ctr, and it is 60% cheaper than 5Ctr for 5x density.
While the addition of ZCCloud resources reduces the total cost, the frequent downtime of ZCCloud also lowers the system capability. Therefore, to systematically assess the benefit of adding ZCCloud to datacenter, we further study the cost-effectiveness of scaling with ZCCloud resources.
VI Exploring Cost-Performance for ZCCloud
In this section, we explore the cost-performance of periodic resources and SP-based resources, and then explore regional difference in power price, different hardware prices as well as growing system power density. To evaluate cost-performance, we combine our resource productivity experiments with the TCO cost models. Throughout, we use the metric Throughput / Million $, which is work per unit operating cost.
We first consider a baseline scenario, using a typical power price for the United States, $60/MWh (), and Mira’s compute hardware price (). First we consider a simple periodic intermittent resource, and then stranded-power-based systems with more complex intermittency.
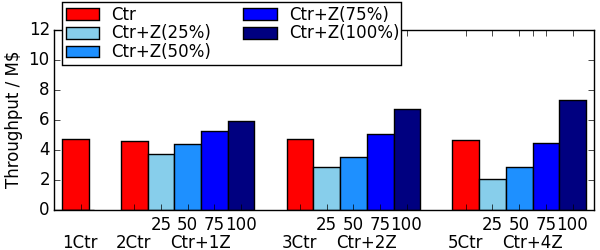
Periodic Intermittent Resources We first explore periodic resources, varying duty factor from 25% to 100%. The results show that as duty factor increases, cost-performance improves (see Figure 14). At 50% or less, the ZCCloud systems achieve worse cost-performance than the traditional datacenter systems, because periodic intermittent resources cannot hold long-running jobs, shifting the heavy load onto traditional resources and making them overloaded. These effects are magnified on the larger systems which have a larger proportion of ZCCloud resources. As duty factor increases further, the ZCCloud systems becomes competitive with traditional datacenter systems.
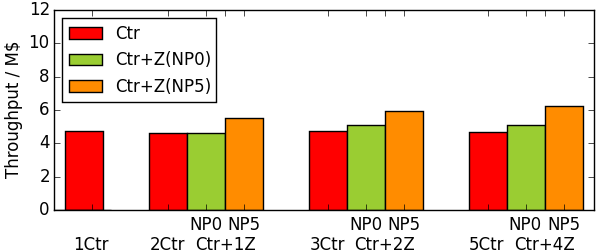
Stranded-Power-Based Resources For SP-based resources, we only consider NetPrice (NP) models as the duty factors achieved by LMP are too low to be competitive. Using NP0 and NP5 models, duty factors 50% can be achieved, producing competitive and even superior cost-performance (see Figure 15). Overall, while NP0 systems match Ctr resources, the NP5 systems outperform, with Ctr+1Z 20% more cost-effective than 2Ctr. Ctr+4Z is 34% superior to 5Ctr.
In conclusion, for our baseline (power price=$60/MWh, and computing price=1x), scaling with SP-based intermittent resources is more cost-effective than traditional resources. Intermittent resources using NetPrice models are useful and beneficial to HPC.


VI-A The Impact of Power Price
The price of power varies widely from country to country, and even the region within a country [38]. For example, at the high end, the average retail price for power in Germany in 2011 was $0.35/kwh = $350/MWh and in Denmark, the greenest country in Europe, $0.41/kwh = $410/MWh. On the other side of the globe, Japanese power costs $0.25/kwh = $250/MWh, but the largest asian nations China and India have much lower $0.08/kwh = $80/MWh prices. The United States falls in the middle $0.12/kwh = $120/MWh. For completeness, we consider a range down to the wholesale prices in the US, which are $30/MWh for the Midcontinent ISO (MISO).
Beginning at the left of Figure 16, in all cases as the power price increases, system throughput/M$ decreases. The Ctr+Z systems match the 2Ctr performance with NP0 at low power prices, and outperforms slightly at a power price typical for Japan, Germany or Denmark. With NP5, the advantage is more than 29%. Adding more ZCCloud resources increases benefit. With a larger fraction of intermittent resources, the ZCCloud advantage grows, and at 4x ZCCloud resources, the throughput/M$ of Ctr+4Z(NP5) is 55% higher than 5Ctr. There is a slight decline as power price increases, but since ZCCloud resources in Ctr+Z exploit zero-cost stranded power, the decay is much slower, and advantage increases.
So higher power prices make NetPrice-based ZCCloud resources more cost-effective than traditional datacenter resources. NP0-based resources are comparable, and long stranded power intervals produced by NP5-based resources enable them to outperform traditional resources. In high price power countries, ZCCloud systems have a major cost-performance advantage, about 55%. In more moderate-price regions the benefit can be 10-30%, growing with larger systems.
VI-B The Impact of Compute Hardware Price
Next we consider how changing compute hardware costs affect ZCCloud benefits. At the End of Moore’s Law [39, 2], the cost of hardware may change significantly. If feature scaling slows or ends – commoditizing processors – one could imagine a 4x reduction (Intel processors at ARM prices). On the other hand, if slow progress continues, with heroic multi-patterning lithography, prices could creep upward, perhaps 1.5x [40]. So, we consider a range of prices.
Varying hardware price produces a consistent trend across all system sizes and types; with cost increases, throughput/M$ decreases (see Figure 17). The 1.0x scenarios (Baseline) match data in prior graphs, so we consider first decreasing hardware prices. In such scenarios, the advantage of ZCCloud grows dramatically, Ctr+1Z(NP5) achieves 42% superior throughput/M$ than 2Ctr at 0.25x hardware cost. For larger systems the advantage grows, reaching 97% for Ctr+4Z(NP5) versus 5Ctr. On the other hand, if hardware cost increases, ZCCloud’s benefits suffer from a lower duty factor, and poor utilization of expensive hardware. At 1.5x hardware price, Ctr+Z systems are comparable with Ctr resources. In conclusion, Ctr+Z benefits more from falling hardware prices than Ctr.
VI-C The Impact of Growing System Power Density
The growth of supercomputer power is a well-documented trend [32, 3] with the power for a state-of-the-art supercomputing system at a given price ($150M for the US DOE CORAL systems [7, 6]) is increasing by 3x per five-year generation. Note that each generation has a much greater computation rate (nearly 20x), We explore the impact of this increasing power density MW/$, and scale up the workload by assuming each job is scaled up in proportion to the computation rate increase, maintaining constant job throughput.
With increasing power density, all systems see a steady decrease in throughput/M$ (see Figure 18). This trend is pronounced for all system scales and all configurations. A decrease in job throughput may still be an increase in computational throughput, as the jobs are scaling up. However the ZCCloud systems decline less precipitously, so the relative difference grows, and the growth of power density makes ZCCloud more attractive. While throughput/M$ of Ctr+1Z(NP0) is almost the same as that of 2Ctr for 1x density, its 25% better than 2Ctr for 5x density. Ctr+1Z(NP5) is 20% more cost-effective than 2Ctr for 1x density, and 50% better than 2Ctr for 5x density. Scaling to more intermittent resources further improves cost-effectiveness. For example, for 1x density, Ctr+4Z(NP5) achieves 34% higher throughput/M$ than 5Ctr; and for 5x density, the throughput/M$ of Ctr+4Z(NP5) is remarkably 116% higher than 5Ctr.
With higher system power density, all system configurations see declining cost-effectiveness, the use of stranded power with NP5 ZCCloud advantages that grow with power density and scale, reaching as much as 116% better.
VII ZCCloud at Extreme Scale
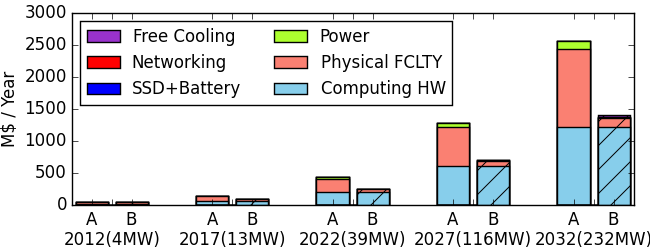
There are major questions how to scale to exascale and beyond, as the growth of power and required physical infrastructure are daunting. Here we consider two approaches: (1) traditional datacenters (Scenario A) and, (2) ZCCloud - adding stranded power systems to complement a 4MW base system.
Figure 19 applies our TCO model to extreme scaling, and using a constant cost per unit for IT hardware, datacenter, and electrical power. The results follow those in Section V.
To create a baseline, we document performance and power for leading DOE systems: 2012 [26] and 2017 [6], and project based on geometric growth for 2022, 2027, and 2032 in Table IV. The numbers are daunting, despite building in 7x energy/op improvement every 5 years, and conservative compared to Horst Simon’s empirical scaling model [41].
| Year | 2012 | 2017 | 2022 | 2027 | 2032 |
|---|---|---|---|---|---|
| Peak PF | 10 [26] | 200 [6] | 4K | 80K | ? |
| MW | 4 [26] | 13 [6] | 39 | 116 | 232 |
| Horst Simon Model [41] | |||||
| Peak GF/kW | 2.2K | 4.2K | 6.2K | 8.2K | 10.2K |
| MW | 2 | 48 | 645 | 9.8K | ? |
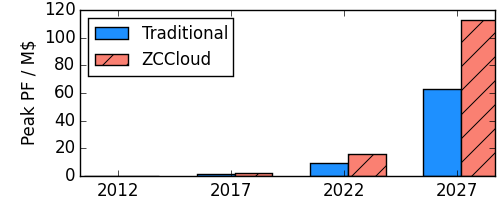
Considering differences in TCO growth, we can compare cost-effectiveness in achieving “high peak performance”, peak petaflops/million-dollars TCO (see Figure 20). By shedding power cost and significant power distribution/cooling and other physical infrastructure, the ZCCloud approach have significant advantages for enabling capability computing. Specifically, TCO for the 39MW, 116MW and 232MW traditional systems are $430M, $1,300M, and $2,550M/year respectively. ZCCloud approach mitigates both power and datacenter elements of TCO growth, reducing TCO by 41% at 39MW and more than 45% at 232MW. These estimates overstate likely hardware costs (constant HW cost/MW), but any reductions shift TCO balance to power and datacenter costs and thus further increase the advantage of the ZCCloud approach.
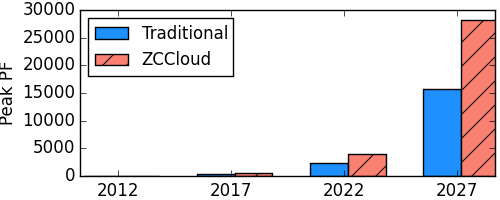
Supercomputer systems are often limited to a fixed budget, so we consider growing TCO, and compute the maximum size system that can be built and operated given a TCO of $250M/year (Figure 21). Here the cost efficiency for peak performance of ZCCloud enables 80% greater peak PFLOPS.
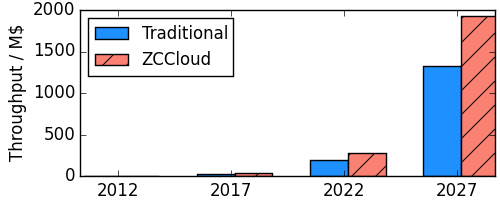
Finally, we consider cost-effectiveness on a throughput basis. We we combine the productivity of ZCCloud hardware at duty factors feasible on stranded power (80%) with the TCO scaling to compute throughput in jobs/million-dollars of TCO (Figure 22), showing that ZCCloud approaches can are 45% more cost-effective.
VIII Discussion and Related Work
Numerous researchers have studied integrating renewables into datacenters and maximizing green power usage [42, 43, 44]. More ambitious efforts even “follow the renewables” [19] distributing computing resources geographically to increase green power usage. ZCCloud differs from these efforts, using no grid power (brown or otherwise), exploiting only un-economic stranded power at the point of generation, a dispatchable load [45, 15] that may even benefit grid stability.
Improving data-center energy-efficiency is an area of intensive research. For example, under-provisioning reduces grid power supply to the average compute power demand instead of peak [46]. Dynamic power management selects power source based on the load [47], and energy-aware job schedulers migrate jobs and shift peak load to achieve higher efficiency [44]. These approaches achieve higher power efficiency at some trade in system performance and quality of service, such as lowering CPU frequency and deferring jobs. In contrast, ZCCloud is designed as an extension to supercomputing systems to scale up throughput and performance.
Distributed systems researchers have long sought to exploit intermittent computing resources, notably Peer-to-peer [48], desktop grid [49, 50], and Condor [51], where computing resources are generally single machines, loosely-coupled, and volatile. Cloud providers have also operated revokable computing services. Amazon’s spot instances [52] enable cloud uses to bid on EC2 instances with a lower cost, and revoke resource when its price is higher than the user’s bid price. Google Compute Engine (GCE) provides analogous capability in a preemptible VM instance [53]. A number of research studies explore how to make these volatile resources more useful for online services requiring continuous availability [54, 55, 56]. We believe these efforts may have the potential to create high-value cloud services based on volatile ZCCloud resources.
Researchers have proposed migrating workloads around the world to reduce electricity cost at Akamai [57], and “follow-the-sun” techniques to increase the fraction of renewable energy use. Later techniques combine optimization for renewable use while meeting response time requirements [19]. All of these techniques suffer from TCO’s dominated by the capital costs for compute hardware and physical infrastructure, and thus migratory techniques that produce low hardware resource utilization are generally not cost-effective. Our work on ZCCloud assesses achievable duty factors and overall costs, showing the ZCCloud can be more cost-effective than a single traditional supercomputing center facility.
IX Summary and Future Work
We explore cost-effectiveness of a novel approach to scaling supercomputing. ZCCloud uses stranded power, and locates computing hardware at selected renewable generation sites to reduce physical building and power distribution costs. MISO energy market statistics show that sufficient stranded power is available support large-scale computing resources with duty factors as high as 80%. Simulations of production HPC workload show that intermittent resources can effectively increase system capabilities.
Our study of ZCCloud cost-effectiveness shows that stranded-power based computing resources can save up to 45% of capital costs at a given scale and improve cost-effectiveness by more than 100%. Study of future extreme scale systems reveal significant advantages due to reduced power and physical infrastructure, ZCCloud extension can reduce capital costs significantly.
Beyond simulation, one might build a ZCCloud prototype to prove out the costs and effectiveness on real workloads. Our first 108-core prototype is driven by historical MISO stranded power data, and is executing Open Science Grid (OSG) [58] workloads. Our second planned prototype will be deployed in the next three months, and includes 78 nodes (2,500 cores), and we will explore OSG workloads and batch workloads from a local supercomputing center. Beyond that, we will build a physical container prototype, and deploy it at a carefully selected wind farm with ample stranded power. Another interesting direction is to explore support for computing services beyond batch parallel computing.
Appendix A TCO Model Details
The amortized costs in Table II are calculated using the following formulas:
| (5) |
| (6) |
Where is the capital expense of the component, is the cost of capital, 3%, and is the amortization period (in years). Table V includes full detail.
| Component | Price | Size | Amortization |
|---|---|---|---|
| Compute | $24M/MW | 4MW | 5 years |
| Network | $13k/mile | 500 miles | 10 years |
| SSD | $0.67/GB | 2PB | 5 years |
| Battery | $350/kWh | 1MWh | 5 years |
| Container | $5M/MW | 4MW | 12 years |
| Free Cooling | $700k/MW | 4MW | 10 years |
We present all elements from [28] in Table VI; our cost model omit those with contributions generally less that 1% including water, connection and land.
| Elements | Description | Contribution |
|---|---|---|
| Components included in our simple model | ||
| Servers | Computing hardware costs | 44.9% - 56.9% |
| Building | Machine room, cooling and power infrastructures | 23.6% - 34.5% |
| Power | Electricity costs | 9.2% - 17.8% |
| Networking | Internal networking costs | 0.7% - 1.1% |
| Components omitted in the simple model | ||
| Connection | Connection to power grid and Internet backbone | 0.1% - 4.7% |
| Water | Water used for cooling | 0.1% - 1.2% |
| Land | Cost of real-estate | 0.7% - 2.4% |
References
- [1] F. Yang and A. A. Chien, “ZCCloud: Exploring Wasted Green Power for High-Performance Computing,” in IPDPS’16, 2016.
- [2] S. Borkar and A. A. Chien, “The future of microprocessors,” Commun. ACM, vol. 54, May 2011.
- [3] J. Shalf et al., “Exascale computing technology challenges,” in VECPAR 2010, 2011, pp. 1–25.
- [4] “TIANHE-2,” http://www.top500.org/system/177999, June 2015.
- [5] “Blue Waters: Awesome Power, Awesome Efficiency,” http://www.datacenterknowledge.com/archives/2010/06/24/blue-waters-awesome-power-awesome-efficiency/, June 2010, 15 MW power.
- [6] “Aurora,” http://aurora.alcf.anl.gov/, 2015.
- [7] “Summit,” https://www.olcf.ornl.gov/summit/, 2015.
- [8] N. Bates et al., “The electrical grid and supercomputing center: An investigative analysis of emerging opportunities and challenges,” in 3rd D-A-CH Conference on Energy Informatics. Springer, 2014.
- [9] O. Kimura et al., “Saving Electricity in a Hurry: A Japanese Experience after the Great East Japan Earthquake in 2011,” ACEEE Summer Study on Energy Efficiency in Industry, 2013.
- [10] “Blue waters,” https://en.wikipedia.org/wiki/Blue_Waters, June 2010.
- [11] “Computational and Theory Research Facility,” https://www.nersc.gov/assets/Uploads/CRT-for-NUG.pdf, February 2015.
- [12] A. Gore et al., An Inconvenient Truth. Paramount, 2007.
- [13] D. Terdiman, “Is Google building a hulking floating data center in SF Bay?” CNET, 2013, http://www.cnet.com/news/is-google-building-a-hulking-floating-data-center-in-sf-bay/.
- [14] J. Markoff, “Microsoft Plumbs Ocean’s Depths to Test Underwater Data Center,” The New York Times, 2016.
- [15] A. A. Chien et al., “The zero-carbon cloud: High-value, dispatchable demand for renewable power generators,” The Electricity Journal, pp. 110–118, 2015.
- [16] A. Chien et al., “Zero-carbon cloud: A volatile resource for high-performance computing,” in SHPC’15. IEEE, 2015.
- [17] Bird, et. al., “Integrating Variable Renewable Energy: Challenges and Solutions,” NREL, Tech. Rep., 2013.
- [18] L. Bird et al., “Wind and Solar Energy Curtailment: Experience and Practices in the United States,” NREL, Tech. Rep., March 2014.
- [19] J. L. Berral et al., “Building green cloud services at low cost,” in ICDCS’14. IEEE, 2014, pp. 449–460.
- [20] “Renewable Energy13.4% of US Electricity Generation in 2014,” http://cleantechnica.com/2015/03/10/renewable-energy-13-4-of-us-electricity-generation-in-2014-exclusive/.
- [21] “California Public Utilities Commission (CPUC),” http://www.cpuc.ca.gov/PUC/energy/Renewables.
- [22] C. Megerian et al., “Gov. Brown signs climate change bill to spur renewable energy, efficiency standards,” Los Angeles Times, 9 2015.
- [23] D. W. Program, “Wind vision: A new era for wind power in the united states,” DOE National Renewable Energy Laboratory, http://energy.gov/eere/wind/wind-vision, Tech. Rep., May 2015.
- [24] “MISO,” https://www.misoenergy.org/.
- [25] Greenpeace, “Clicking clean: A guide to building a green internet, 2015 edition,” 2015, http://www.greenpeace.org/usa/wp-content/uploads/legacy/Global/usa/planet3/PDFs/2015ClickingClean.pdf.
- [26] “Mira-ALCF,” https://www.alcf.anl.gov/mira.
- [27] U. Hoelzle and L. Barroso, The datacenter as a computer. Morgan and Claypool, 2009.
- [28] Í. Goiri et al., “Intelligent placement of datacenters for internet services,” in ICDCS’11. IEEE, 2011, pp. 131–142.
- [29] X. Wang et al., “Grid-aware placement of datacenters and wind farms,” in IGSC’15. IEEE, 2015.
- [30] E3, “Investigating a higher renewables portfolio standard in california: Executive summary,” Report from Energy and Economics, Inc., Tech. Rep., January 2014.
- [31] Lew, et. al., “Wind and Solar Curtailment,” in Workshop on Large-Scale Integration of Wind Power Into Power Systems, 10 2013.
- [32] “Top500 supercomputers,” 2015, http://www.top500.org/.
- [33] “TeslaPowerwall,” https://en.wikipedia.org/wiki/Tesla_Powerwall, 2016.
- [34] “Cobalt,” https://www.alcf.anl.gov/cobalt-scheduler.
- [35] “EIA electricity price,” http://www.eia.gov/electricity/, 2015.
- [36] “Intel Enterprise SSD,” http://www.intel.com/content/www/us/en/solid-state-drives/solid-state-drives-ssd.html, 2016.
- [37] “Argonne Leadership Computing Facility,” http://www.alcf.anl.gov/.
- [38] “Average electricity prices around the world,” https://www.ovoenergy.com/guides/energy-guides/average-electricity-prices-kwh.html.
- [39] “No Moore?” The Economist, November 2013, world Print Edition.
- [40] “Intel’s sway drives up server-chip prices,” Wall Street Journal, 2014.
- [41] “Horst Simon on the HPC Slowdown,” http://www.hpcwire.com/2015/02/13/horst-simon-hpc-slowdown/, 2015.
- [42] Í. Goiri et al., “Parasol and greenswitch: Managing datacenters powered by renewable energy,” in ACM SIGARCH Computer Architecture News. ACM, 2013, pp. 51–64.
- [43] C. Li et al., “iswitch: coordinating and optimizing renewable energy powered server clusters,” in ISCA’12. IEEE, 2012.
- [44] M. E. Haque et al., “Greenpar: Scheduling parallel high performance applications in green datacenters,” 2015.
- [45] omitted for blind review, “Data centers as dispatchable loads to harness stranded power,” omitted for blind review, Tech. Rep., January 2016, submitted for publication.
- [46] X. Zhou et al., “Underprovisioning the grid power infrastructure for green datacenters,” in ICS’15. ACM, 2015, pp. 229–240.
- [47] L. Liu et al., “HEB: deploying and managing hybrid energy buffers for improving datacenter efficiency and economy,” in ISCA’15, 2015.
- [48] A. Oram, Ed., Peer-to-Peer: Harnessing the Power of Disruptive Technologies. O’Reilly, 2001.
- [49] A. Chien et al., “Entropia: architecture and performance of an enterprise desktop grid system,” JPDC, pp. 597–610, 2003.
- [50] D. Anderson et al., “SETI@home: an experiment in public-resource computing,” Communications of the ACM, pp. 56–61, 2002.
- [51] “HTCondor,” http://research.cs.wisc.edu/htcondor/.
- [52] “Spot instance,” http://docs.aws.amazon.com/AWSEC2/latest/UserGuide/using-spot-instances.html.
- [53] “Google compute engine: Creating a preemptible vm instance,” https://cloud.google.com/compute/docs/instances/preemptible.
- [54] X. He et al., “Cutting the cost of hosting online services using cloud spot markets,” HPDC’15, 2015.
- [55] W. Guo et al., “Bidding for highly available services with low price in spot instance market,” HPDC’15, 2015.
- [56] T. Trader, “Cycle computing orchestrates cancer research on google cloud,” Tech. Rep., 2015, http://www.hpcwire.com/2015/09/10/cycle-computing-orchestrates-cancer-research-on-google-cloud/.
- [57] A. Qureshi et al., “Cutting the Electric Bill for Internet-scale Systems,” in SIGCOMM’09. ACM, 2009, pp. 123–134.
- [58] “Open Science Grid,” http://www.opensciencegrid.org/, 2016.