figure \cftpagenumbersofftable
Survey strategy optimization for the Atacama Cosmology Telescope
Abstract
In recent years there have been significant improvements in the sensitivity and the angular resolution of the instruments dedicated to the observation of the Cosmic Microwave Background (CMB). ACTPol is the first polarization receiver for the Atacama Cosmology Telescope (ACT) and is observing the CMB sky with arcmin resolution over 2000 sq. deg. Its upgrade, Advanced ACTPol (AdvACT), will observe the CMB in five frequency bands and over a larger area of the sky. We describe the optimization and implementation of the ACTPol and AdvACT surveys. The selection of the observed fields is driven mainly by the science goals, that is, small angular scale CMB measurements, B-mode measurements and cross-correlation studies. For the ACTPol survey we have observed patches of the southern galactic sky with low galactic foreground emissions which were also chosen to maximize the overlap with several galaxy surveys to allow unique cross-correlation studies. A wider field in the northern galactic cap ensured significant additional overlap with the BOSS spectroscopic survey. The exact shapes and footprints of the fields were optimized to achieve uniform coverage and to obtain cross-linked maps by observing the fields with different scan directions. We have maximized the efficiency of the survey by implementing a close to 24 hour observing strategy, switching between daytime and nighttime observing plans and minimizing the telescope idle time. We describe the challenges represented by the survey optimization for the significantly wider area observed by AdvACT, which will observe roughly half of the low-foreground sky. The survey strategies described here may prove useful for planning future ground-based CMB surveys, such as the Simons Observatory and CMB Stage IV surveys.
1 Introduction
The Cosmic Microwave Background (CMB) remains one of the most valuable sources of cosmological information. Temperature anisotropy measurements have reached the cosmic variance limit at angular scales with the Planck satellite[1]. Polarization measurements can provide important additional information able to break degeneracies between cosmological parameters and constrain extensions of the CDM model, such as the tensor-to-scalar ratio and the neutrino mass sum . Several ground based experiments, such as the Atacama Cosmology Telescope Polarimeter (ACTPol) [2], POLARBEAR [3], SPTpol [4], BICEP2 [5], Keck-array [6] and CLASS [7], are measuring the E-mode and B-mode polarization signals [8, 9, 10, 11].
In this paper we focus on the survey strategy implemented by ACTPol between 2013 and 2015 and the upgraded instrument AdvACT [12], which started its first observation campaign in 2016. AdvACT will observe approximately half of the sky in five frequency bands, from 28 GHz to 230 GHz, with the high angular resolution of 1.4 arcmin at 150 GHz already achieved by ACTPol. The expected map noise in temperature and polarization will be significantly reduced with respect to the ACTPol survey thanks to the nearly doubled number of detectors. AdvACT plans to use half-wave plates (HWP) that modulate the polarized signal at several Hz to improve polarization measurements at the largest angular scales.
One of the unique advantages of the ACTPol and AdvACT surveys is the large overlap with optical surveys like BOSS[13], HSC[14], DES[15], DESI[16] and LSST[17]. This overlap allows for powerful cross-correlation studies and new probes of dark energy and the neutrino mass sum.
The observation plans for ACTPol and AdvACT are designed to maximize the scientific potential of the surveys. The choice of the observed fields and of the relative priority for different fields (i.e. which field is observed when more than one field is visible at the same time) takes into account several constraints and scientific objectives that often compete with each other. Observing regions that maximize overlap with optical surveys is an important goal for cross-correlation studies. Galactic dust emission is a significant limitation especially for measurements of large scale B-mode polarization, which thus favor observations of low foreground regions. Scanning the fields while rising and setting at different elevations (cross-linking) reduces systematic effects in the map-making process[18]. For the daytime measurements, sun avoidance introduces an additional constraint that must be accounted for, or significant data loss can result from data acquired with the sun in the sidelobes. Moon avoidance is less concerning. We have not yet accounted for it in the ACTPol strategy nor in the 2016 AdvACT strategy but we plan to include it in future observing plans. We take these constraints into account and maximize the efficiency of the observing plan by minimizing the idle time of the telescope and switching between different observing plans for daytime and nighttime.
2 ACTPol survey
The first season of observations with the ACTPol receiver (season 1) was conducted in 2013. ACTPol observed four deep patches centered near declination (Dec) and at right ascensions (RA) (deep1), (deep2), (deep5) and (deep6) with areas of , , and sq. deg. An additional field located on the galactic plane at (RA, Dec) = (,) was observed as a lower priority daytime field for the last part of the season. These fields were selected based on their overlap with other surveys. The exact location of these fields in the sky were optimized so that only one patch would be visible at any given time. Some details about this strategy were presented with temperature and polarization power spectra from the first season of observations in Naess et al. 2014[11]. Here we focus on the survey strategies for the 2014 and 2015 observations with ACTPol.
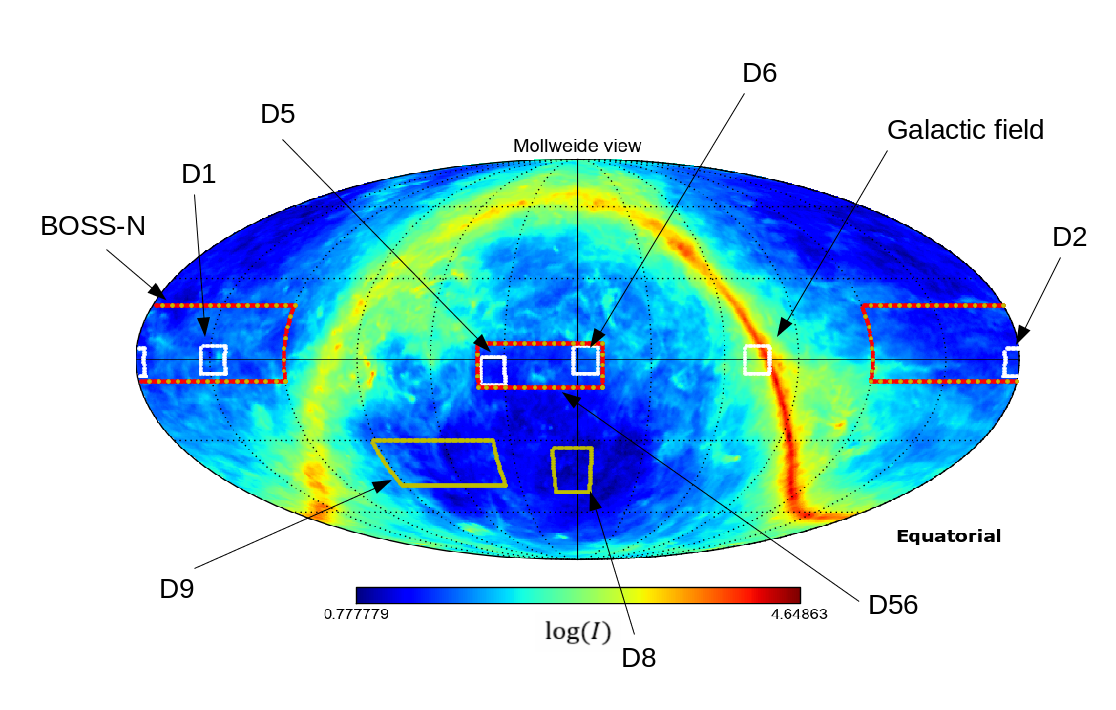 |
Figure 1 shows the fields observed in the three ACTPol seasons from 2013 to 2015. In the 2014 season (season 2) ACTPol observed two regions centered at (RA, Dec) and (RA,Dec) , called respectively deep56 and BOSS-N. The field deep56 covers sq. deg. and encloses the deep5 and deep6 fields observed during season 1. This field is the deepest patch observed during season 2 and it was selected to obtain overlap with several galaxy surveys, including the BOSS southern galactic field, HSC and DES while at the same time increasing the sensitivity in the deep5 and deep6 fields already observed during season 1. The second field (BOSS-N) covers about sq. deg. and it was selected to achieve overlap with the BOSS survey northern galactic field while also providing overlap with KIDs [20] and HSC.
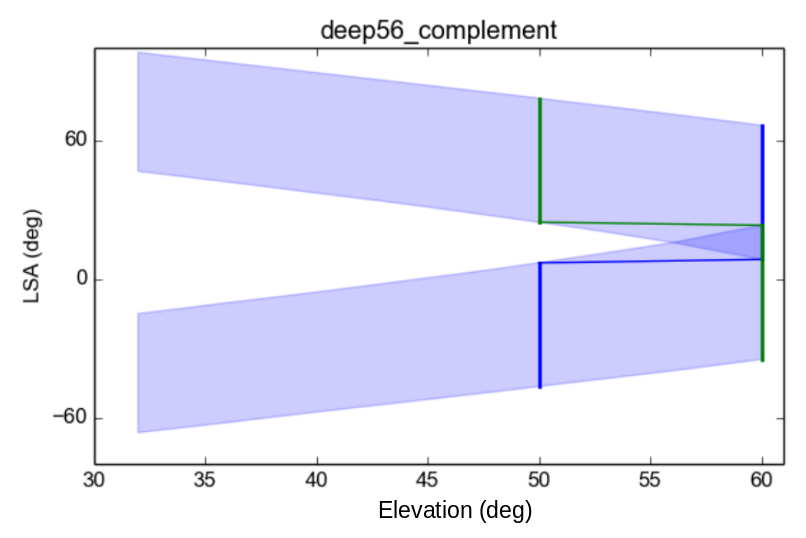
The ACTPol survey strategy consists of horizontal scans at different elevations. Each field is observed by scanning back-and-forth in azimuth. The total elevation range of ACT is to . Observations at higher elevations are generally preferred to reduce the amount of atmosphere observed by the telescope and to avoid emissions from the ground. We observed deep56 at elevations of and both while rising and setting for each elevation. Figure 2 shows how the survey strategy for deep56 is optimized, by looking for a trajectory through the local sidereal angle (LSA)-elevation space that minimizes the temporal gap between a rising and a setting observation of the field. A similar optimization is implemented for the other fields. This configuration provides cross-linked maps of the field. Table 1 summarizes the observing parameters for deep56 and BOSS-N for seasons 2 and 3 with their respective elevations, central azimuths and azimuth ranges. The summary of the areas observed in the 2014 and 2015 seasons of ACTPol is presented in Table 2. The BOSS-N field is the widest field observed by ACTPol and it extends to the highest declinations. Given these characteristics achieving good cross-linking requires using lower elevations. Both rising and setting observations of BOSS-N were made at and elevation.
 |
| Year | Field | elevation (∘) | azE (∘) | azW(∘) | throw (∘) |
|---|---|---|---|---|---|
| 2014-08-22 | BOSS-N-A | 33 | 54 | 305 | 10 |
| BOSS-N-B | 38 | 68 | 292 | 9 | |
| deep56-A | 50 | 57 | 302 | 7 | |
| deep56-A | 60 | 37 | 322 | 13 | |
| deep56-B | 50 | 70 | 289 | 6 | |
| deep56-B | 60 | 59 | 301 | 9 | |
| 2014-10-08 | BOSS-N-A | 33 | 54 | 305 | 10 |
| BOSS-N-B | 38 | 68 | 292 | 9 | |
| deep56 | 50 | 63 | 297 | 13 | |
| deep56 | 60 | 46 | 314 | 22 | |
| 2015 | BOSS-N | 38 | 56 | 303 | 20 |
| BOSS-N | 35 | 59 | 300 | 19 | |
| deep56 | 50 | 62 | 297 | 13 | |
| deep56 | 60 | 45 | 314 | 21 | |
| deep8 | 35 | 126 | - | 10 | |
| deep8 | 49 | 128 | - | 14 | |
| deep9 | 35 | 237 | - | 11 | |
| deep9 | 60 | 229 | - | 20 |
For the first part of season 2 we split deep56 into two strips with parallel declination (deep56-A and deep56-B), overlapping in elevation and observed them in separated scans. One advantage of this approach is that since the azimuth scan amplitude was reduced the scans across the same field were faster. However, this declination splitting introduced more uneven coverage at the edge between the two strips, corresponding to the telescope turning around. For the rest of season 2 we observed deep56 as a single field using wider azimuth scans. BOSS-N was also split into two strips (BOSS-N-A, BOSS-N-B) with parallel declinations to reduce the azimuth throw overlapping for about 1∘ at Dec = .
The choice of the elevations was constrained by the sizes and location of the fields and it was optimized so that the observing configurations (rising and setting at the chosen elevations) interlocked in time. Figure 3 shows the fraction of days spent observing the various fields at a given local sidereal angle (LSA), emphasizes the complementarity of the chosen field and that in season 3 the gaps in the observing plan were minimized by merging a nighttime and a daytime strategy.
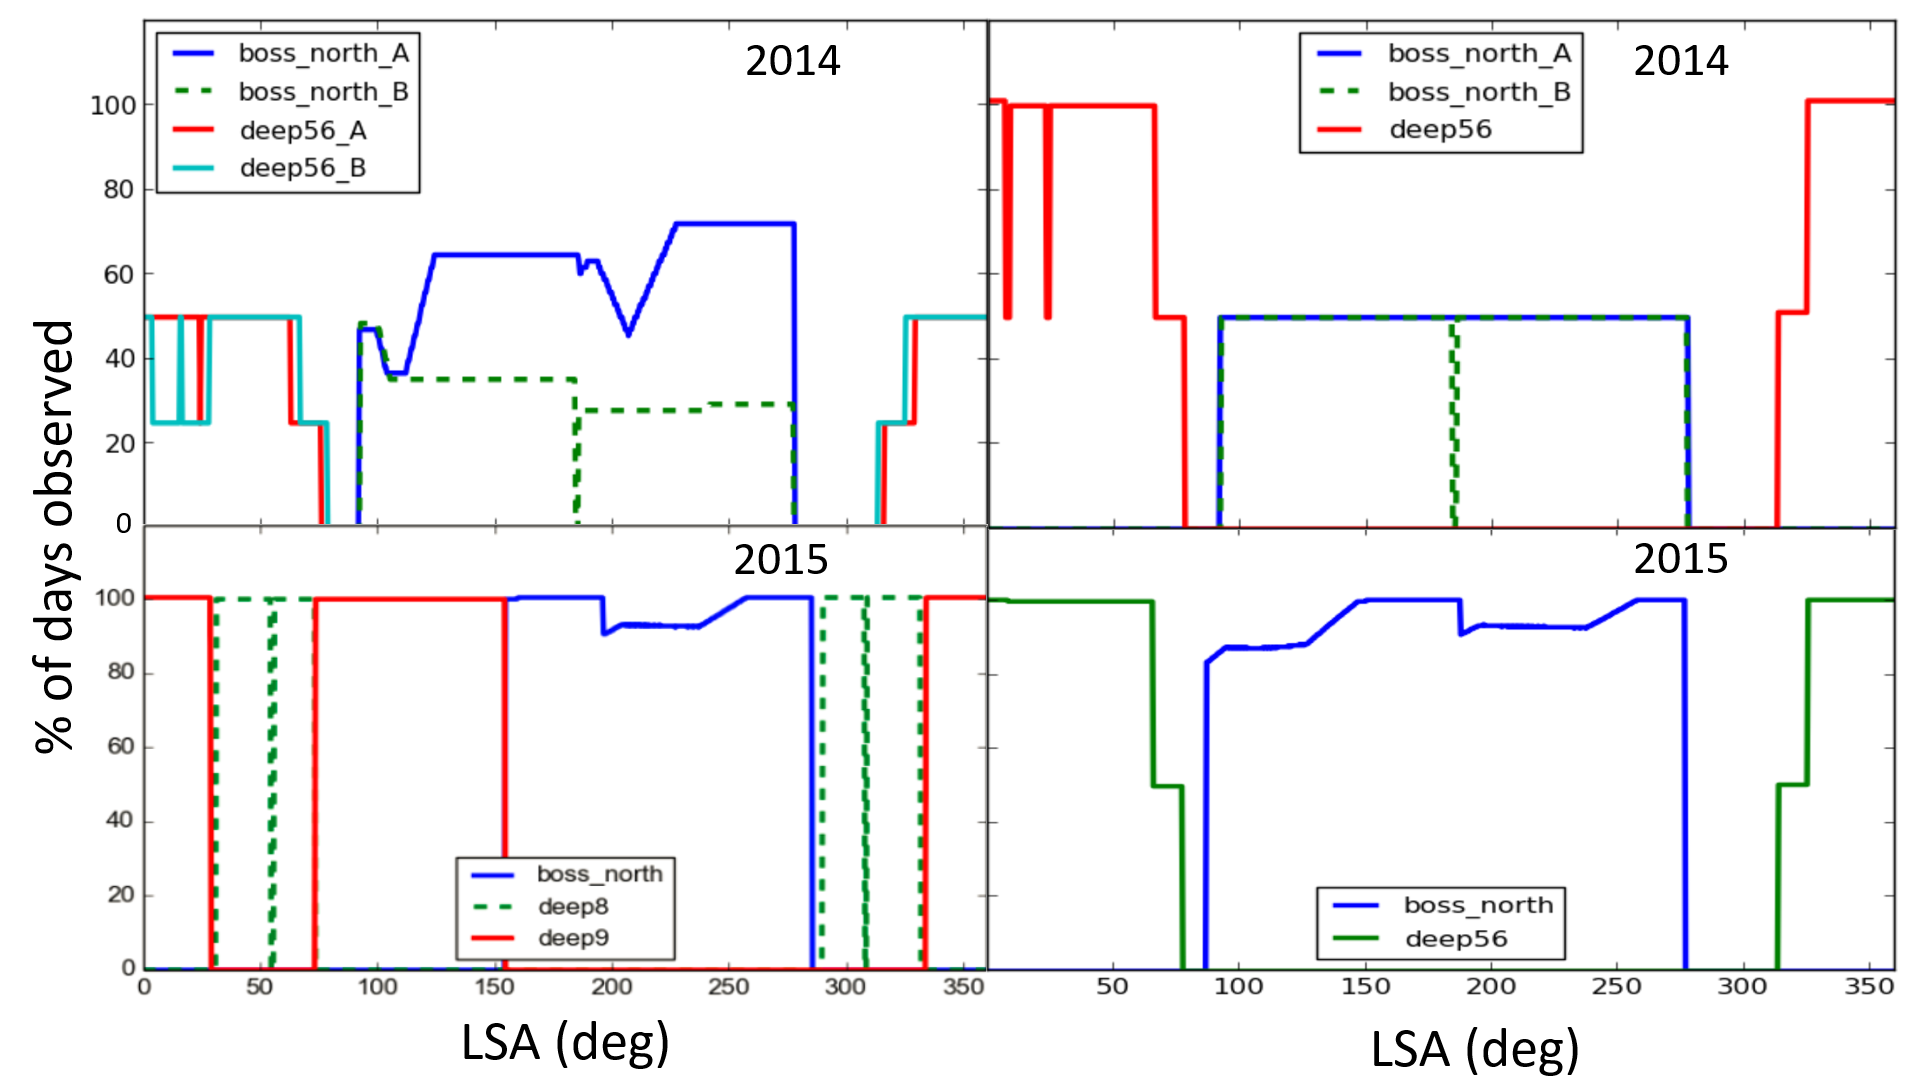
For the first few weeks of season 3, which began in April 2015, we used the same observing plan of season 2 but removed the declination splitting in BOSS-N. For the second part (from May 11 to December 31) we introduced two additional fields, deep8 and deep9, at (RA, Dec) = and with areas sq. deg. and sq. deg.. These patches were selected to overlap with the lowest galactic foreground areas of the sky and the main goal will be to use them to reconstruct the low multipole part of the B-modes power spectra that is more affected by galactic foregrounds. The observing parameters for deep8 and deep9 are also shown in Table 1. To maximize the efficiency and achieve good coverage for deep56, BOSS-N, deep8 and deep9 we produced two independent survey plans, one prioritizing observations of deep8 and deep9 and one observing deep56 and BOSS-N as higher priority fields. We then merged the two plans into a single schedule, using the first (deep8 and deep9) as the daytime plan the second (deep56 and BOSS-N) as the nighttime plan, where we define daytime as 12:00-22:00 local time. The reason for this splitting is the distortion of the beam shape observed during the day caused by thermal distortions of the telescope structure. The largest angular scales are less affected by the details of the beam shape, while the small angular scales, important for lensing reconstruction and cluster science, require good control of the beam. This is the motivation for prioritizing regions with good optical data for cross-correlations, deep56 and BOSS-N, at night.
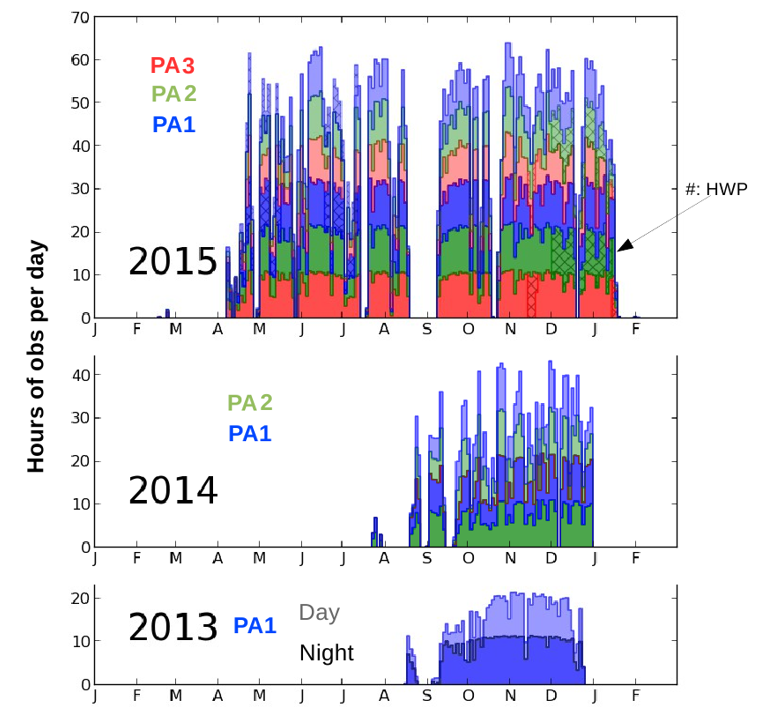
Figure 4 shows a summary of the hours observed per day during each month of ACTPol seasons 1 to 3. We report the amount of observing time per detector array both for nighttime and daytime observations.
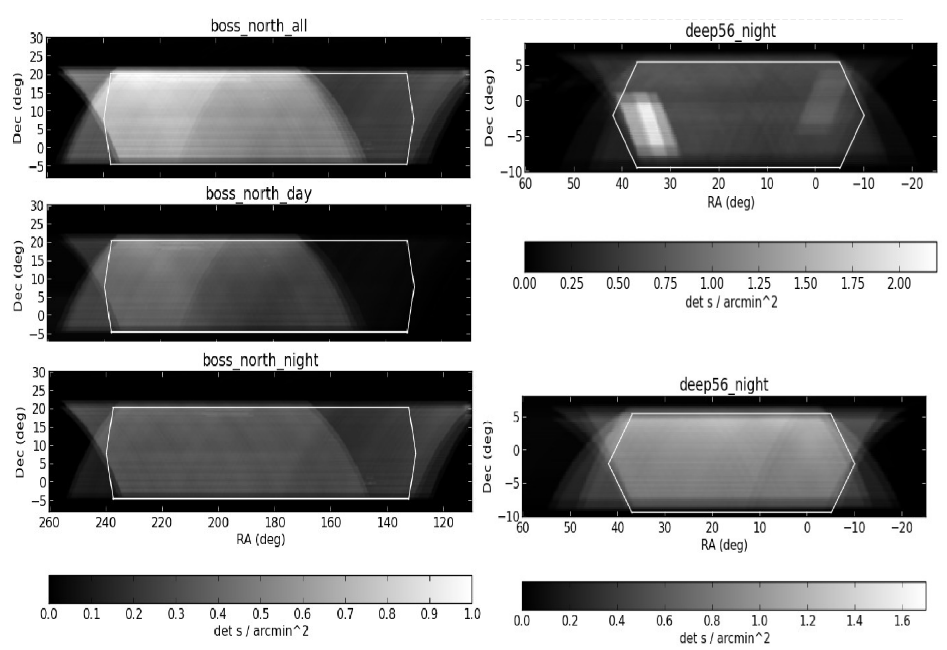
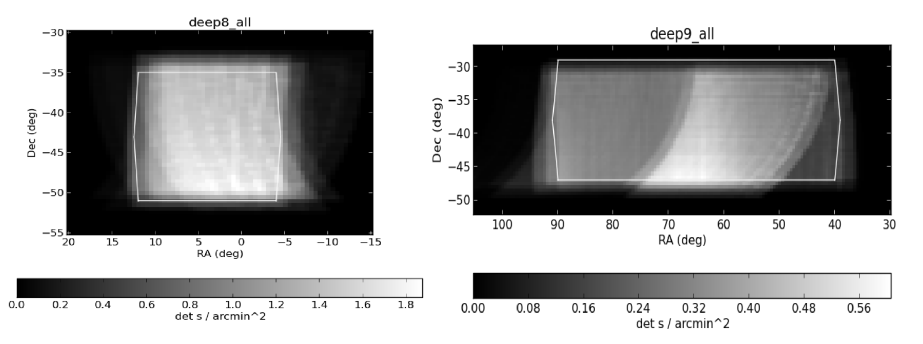
In the last season ACTPol tested the polarization modulation, obtaining several hours of observations with the HWP installed in front of the optics tube. Figure 5 shows the coverage obtained in season 2 and 3 for deep56 and season 3 for BOSS-N and Figure 6 shows the season 3 coverage for deep8 and deep9.
 |
 |
 |
| deep56 | BOSS-N | deep8 | deep9 | |
|---|---|---|---|---|
| Season 2 (2014) | 700 sq. deg. | 2000 sq. deg. | - | - |
| Season 3 (2015) | 700 sq. deg. | 2000 sq. deg. | 190 sq. deg. | 700 sq. deg. |
3 AdvACT survey 2016
The AdvACT survey will significantly extend the area observed by ACTPol over the next five years, observing an area close to half the sky. The wider fields observed by AdvACT pose several challenges.
Achieving uniform coverage for all the fields requires a finer optimization of the elevations and azimuth ranges and a more complicated succession of rising and setting observations for different fields on different days. The scans will be wider in azimuth but at the same time they need to be fast enough so that while the telescope returns to the original position the field has not moved substantially across the sky. We are continuing to study the optimal azimuth throw for calibration and to maintain uniform coverage of the fields.
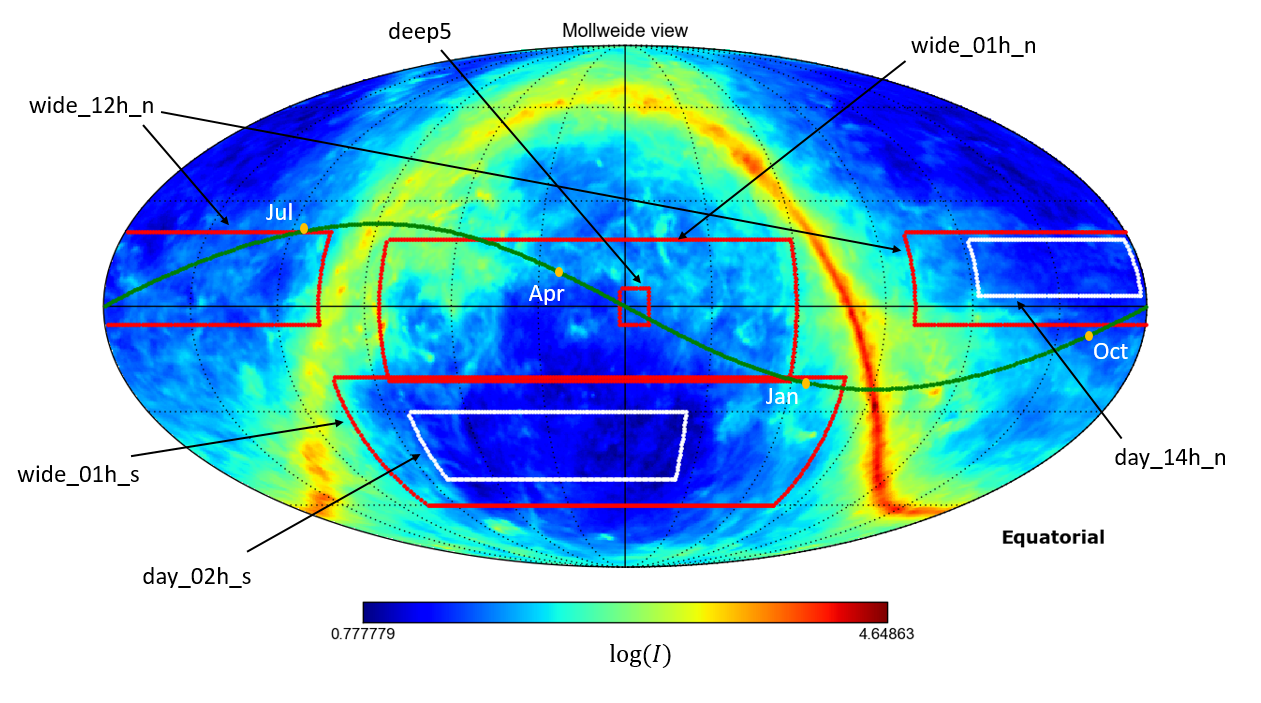
Similarly to ACTPol season 3 we split the observing plan into a nighttime and a daytime strategy. We dedicate the nighttime to observations of the widest field. Figure 7 shows the nighttime and daytime fields. During nighttime we observe three wide fields, two centered at RA and declinations Dec and (wide_01h_n and wide_01h_s) with areas sq. deg. and sq. deg. and one at (RA, Dec) = (12∘, 8∘) (wide_12h_n) covering sq. deg.. The areas to be observed by AdvACT in 2016 are summarized in Table 4. These fields are observed at three different elevations, , and , both while rising and while setting. The fields wide_01h_n and wide_01h_s cannot be observed at the same time, while wide_12h_n can be observed in combination with one of the others. To achieve observations at multiple altitudes for all the wide fields and avoid potential systematic effects associated with any single altitude choice, we then produce twelve independent observing strategies, four for each elevation and alternating rising and setting every night according to the scheme shown in Table 3.
| Elevations | |||
|---|---|---|---|
| Field combination (two fields per night) | |||
| wide_01h_n rising, wide_12h_n rising | 1 | 5 | 9 |
| wide_01h_s rising, wide_12h_n rising | 2 | 6 | 10 |
| wide_01h_n setting, wide_12h_n setting | 3 | 7 | 11 |
| wide_01h_s setting, wide_12h_n setting | 4 | 8 | 12 |
 |
| wide_01h_n | wide_01h_s | wide_12h_n | day_02h_s | day_14h_n | |
| Season 1 (2016) | 5700 sq. deg. | 5000 sq. deg. | 3400 sq. deg. | 1700 sq. deg. | 870 sq. deg. |
We use these twelve strategies to produce uniform and cross-linked coverage for the wide fields by alternating between them, one per night for each twelve night period. To reduce the idle time and the gaps in the observing plan we also observe as a lower priority field, when no other field is available at the desired elevations. The choice of the elevations for is constrained by its low priority. We observe at five elevations: , , , , and .
For daytime observations we select two smaller fields located in low foreground regions. We plan to use these daytime fields for measurements of the CMB B-mode polarization. The motivation for using daytime data in these clean fields is that the large angular scales needed for B-modes measurements are less affected by the diurnal distortion of the beam shape. Moreover AdvACT will take advantage of rotating half-wave plates that will modulate the polarization signal to improve the reconstruction of large angular scale modes. Using multiple daytime fields will allow AdvACT to check the consistency of any measured B-mode signal across different regions of the sky, offering an additional check for galactic foreground contaminations. One of these day-time patches (day_02h_s) encloses the deep8 and deep9 fields already observed during season 3 with ACTPol. It is centered on (RA, Dec) = and covers an area of about sq. deg. Since this field is in the cleanest part of the sky and it has already been partially observed we give to it the highest priority during daytime observations. In Figure 7 it can be seen that this field is far from the Sun for the entire year. The second field (day_14h_n) is centered on (RA, Dec) = and covers about sq.deg. Both daytime fields are observed at elevations of and .
This scheme is beneficial for multiple reasons. As indicated above, we will be able to conduct polarization analysis in different relatively low foreground parts of the sky to check the consistency of the signal across the sky. The northern field overlaps with the ACTPol BOSS-N field and the wide_12h_n where we will also have nighttime data. This overlap will allow comparisons between daytime and nighttime data to confirm that daytime beam distortions are handled adequately in the analysis. Finally, these two daytime fields are never directly crossed by the Sun, which will only marginally affect the edges of day_14h_n in the last part of the season and only through sidelobes.
Both the daytime and nighttime strategies are optimized to minimize the idle time of the telescope to less than of the entire available time. This residual idle time is due to short gaps lasting a few minutes which arise between observations of different fields.
 |
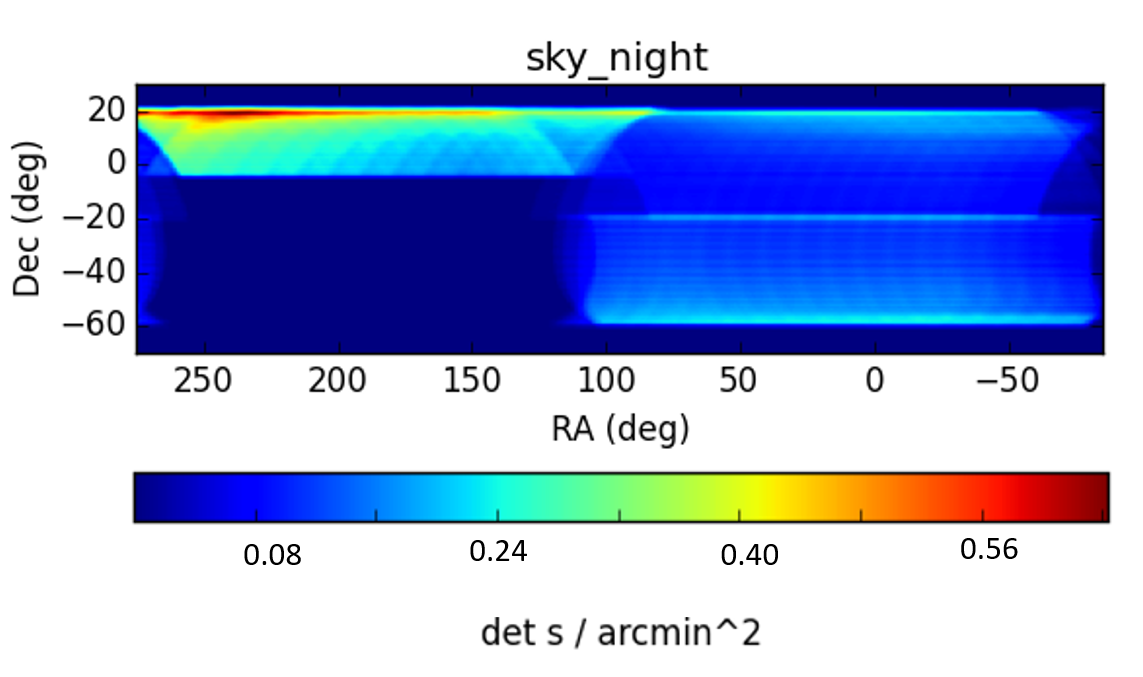 |
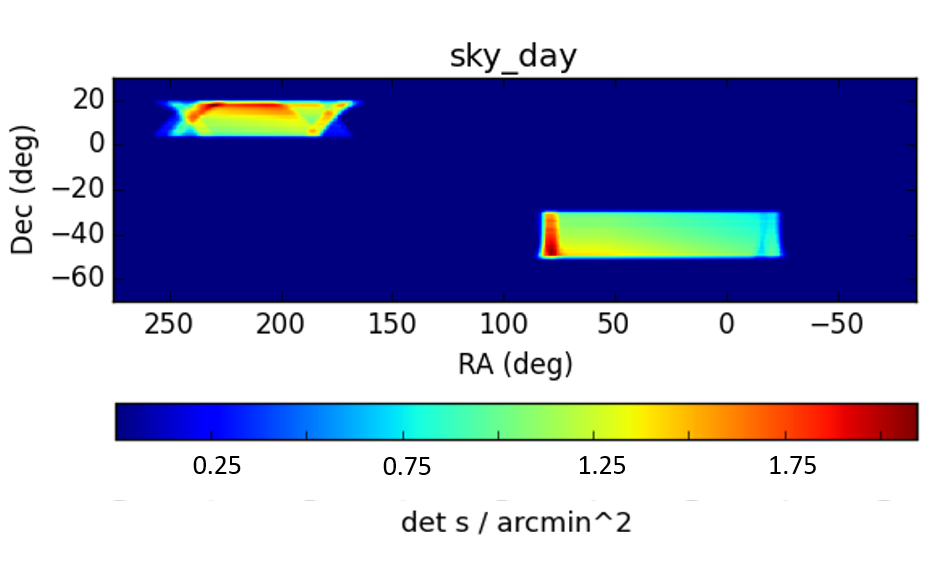
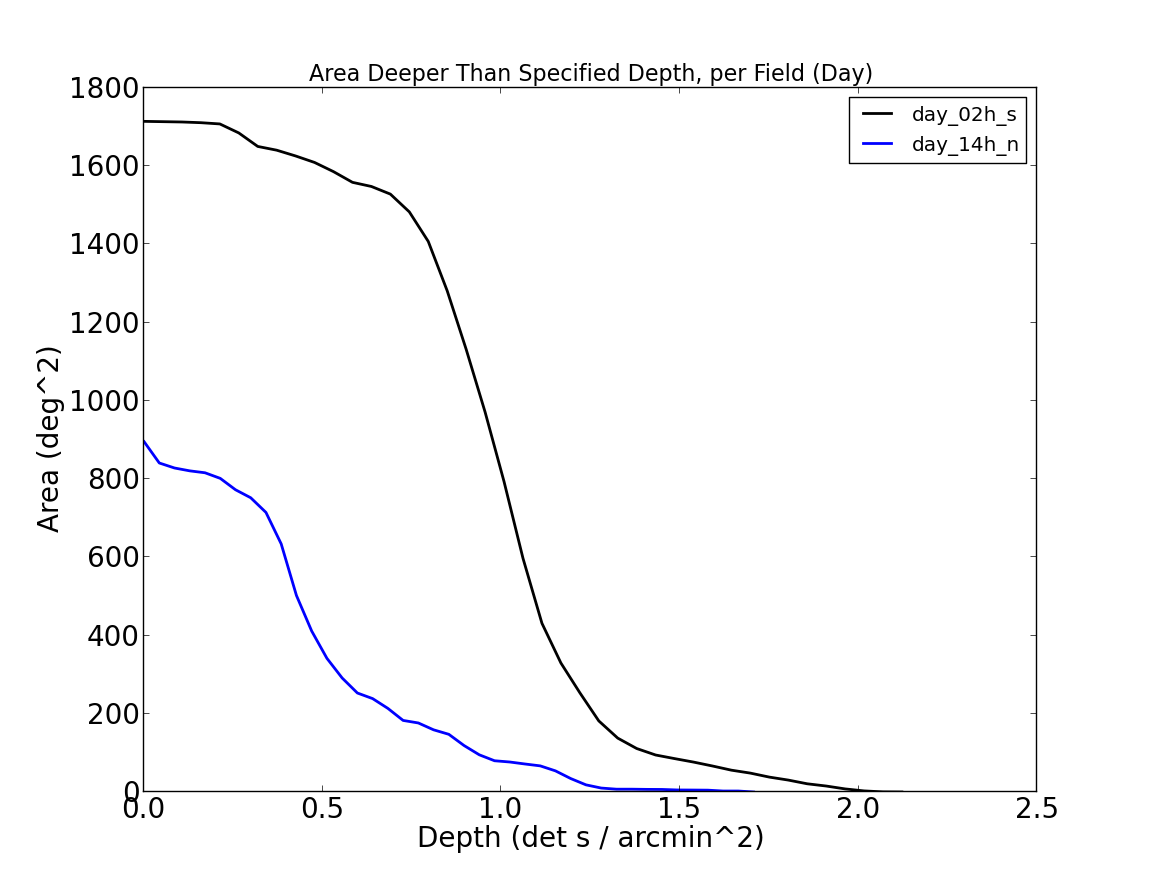
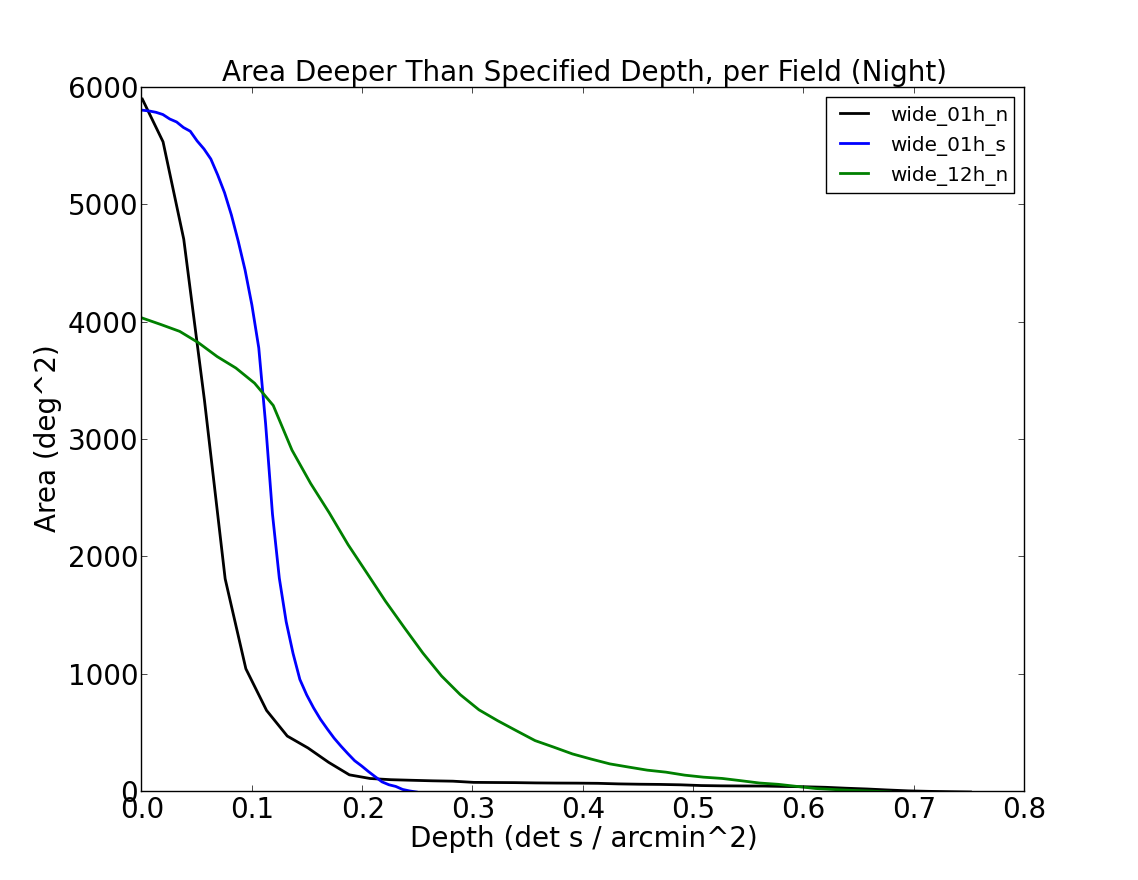
In Figure 8 we show the projected depth maps for the daytime and nighttime AdvACT fields, assuming continuous observations between April and December 2016. In Figure 9 we show the area deeper than a given depth for the wide night fields and the day fields and that wide_01h_s will be on average deeper than wide_01h_n and the same for day_02h_s compared with day_14h_n.
The first season of observations with AdvACT is 2016. The AdvACT survey will observe the CMB sky for at least three years, achieving new levels of angular resolution, sensitivity and frequency coverage, and will overlap with optical surveys, enabling powerful probes of the origin and evolution of the universe.
The optimization of the survey strategy for ACTPol and AdvACT described in this paper can help plan future ground-based CMB surveys, such as for the upcoming Simons Observatory [21], also located in the Atacama Desert, and in the longer term, for CMB Stage IV.
|
Acknowledgments
This work was supported by the U.S. National Science Foundation through awards 0408698 and 1440226. The NIST authors would like to acknowledge the support of the NIST Quantum Initiative. The development of multichroic detectors and lenses was supported by NASA grants NNX13AE56G and NNX14AB58G. The work of KPC, KTC, EG, BJK, CM, BLS, JTW, and SMS was supported by NASA Space Technology Research Fellowship awards. MDN acknowledges support from NSF award AST-1454881. DNS acknowledges support from NSF award AST-1311756.
References
- [1] PlanckCollaboration, “Planck 2015 results. XIII. Cosmological parameters,” (2015).
- [2] M. D. Niemack, P. A. R. Ade, J. Aguirre, et al., “ACTPol: a polarization-sensitive receiver for the Atacama Cosmology Telescope,” in Millimeter, Submillimeter, and Far-Infrared Detectors and Instrumentation for Astronomy V, Proc. SPIE 7741, 77411S (2010).
- [3] The Polarbear Collaboration, J. Errard, P. A. R. Ade, et al., “The new generation CMB B-mode polarization experiment: POLARBEAR,” ArXiv e-prints (2010).
- [4] J. E. Austermann, K. A. Aird, J. A. Beall, et al., “SPTpol: an instrument for CMB polarization measurements with the South Pole Telescope,” in Millimeter, Submillimeter, and Far-Infrared Detectors and Instrumentation for Astronomy VI, Proc. SPIE 8452, 84521E (2012).
- [5] P. A. R. Ade et al., “BICEP2 II: Experiment and Three-Year Data Set,” Astrophys. J. 792(1), 62 (2014).
- [6] Z. Staniszewski, R. W. Aikin, M. Amiri, et al., “The Keck Array: A Multi Camera CMB Polarimeter at the South Pole,” Journal of Low Temperature Physics 167, 827–833 (2012).
- [7] T. Essinger-Hileman, A. Ali, M. Amiri, et al., “CLASS: the cosmology large angular scale surveyor,” in Millimeter, Submillimeter, and Far-Infrared Detectors and Instrumentation for Astronomy VII, Proc. SPIE 9153, 91531I (2014).
- [8] D. Hanson et al., “Detection of B-mode Polarization in the Cosmic Microwave Background with Data from the South Pole Telescope,” Phys. Rev. Lett. 111(14), 141301 (2013).
- [9] P. A. R. Ade et al., “Detection of -Mode Polarization at Degree Angular Scales by BICEP2,” Phys. Rev. Lett. 112(24), 241101 (2014).
- [10] The Polarbear Collaboration: P. A. R. Ade, Y. Akiba, A. E. Anthony, et al., “A Measurement of the Cosmic Microwave Background B-mode Polarization Power Spectrum at Sub-degree Scales with POLARBEAR,” ApJ 794, 171 (2014).
- [11] S. Naess, M. Hasselfield, J. McMahon, M. D. Niemack, et al., “The Atacama Cosmology Telescope: CMB polarization at 200 <l <9000,” JCAP 10, 007 (2014).
- [12] S. W. Henderson et al., “Advanced ACTPol Cryogenic Detector Arrays and Readout,” (2015).
- [13] K. S. Dawson, D. J. Schlegel, C. P. Ahn, et al., “The Baryon Oscillation Spectroscopic Survey of SDSS-III,” 145, 10 (2013).
- [14] Miyazaki et al., “Hypersuprime: project overview,” Proc. SPIE 6269 (2006).
- [15] Flaugher B.L. et al., “Status of the Dark Energy Survey Camera (DECam) project,” Proc. SPIE 8446 (2012).
- [16] M. Levi et al., “The DESI Experiment, a whitepaper for Snowmass 2013,” (2013).
- [17] Z. Ivezic, J. A. Tyson, R. Allsman, et al., “LSST: from Science Drivers to Reference Design and Anticipated Data Products,” (2008).
- [18] D. Sutton, B. R. Johnson, M. L. Brown, et al., “Map-making in small field modulated CMB polarisation experiments: approximating the maximum-likelihood method,” Mon. Not. Roy. Astron. Soc. 393, 894 (2009).
- [19] http://irsa.ipac.caltech.edu/data/Planck/release_2/all-sky-maps/previews/COM_CompMap_dust-commander_0255_R2.00/ .
- [20] J. T. A. de Jong, G. A. Verdoes Kleijn, D. R. Boxhoorn, et al., “The first and second data releases of the Kilo-Degree Survey,” AAP 582, A62 (2015).
- [21] http://simonsobservatory.org/ .