The warm absorber in the radio-loud quasar 4C +74.26
Outflows of photoionized gas are commonly detected in the X-ray spectra of Seyfert 1 galaxies. However, the evidence for this phenomenon in broad line radio galaxies, which are analogous to Seyfert 1 galaxies in the radio-loud regime, has so far been scarce. Here, we present the analysis of the X-ray absorption in the radio-loud quasar 4C +74.26. With the aim of characterizing the kinetic and the ionization conditions of the absorbing material, we fitted jointly the XMM-Newton Reflection Grating Spectrometer (RGS) and the Chandra High Energy Transmission Grating Spectrometer (HETGS) spectra, which were taken 4 months apart. The intrinsic continuum flux did not vary significantly during this time lapse. The spectrum shows the absorption signatures (e.g., Fe-UTA, O vii, and Ne vii–Ne x) of a photoionized gas outflow ( cm-2, , km s-1) located at the redshift of source. We estimate that the gas is located outside the broad line region but within the boundaries of the putative torus. This ionized absorber is consistent with the X-ray counterpart of a polar scattering outflow reported in the optical band for this source. The kinetic luminosity carried by the outflow is insufficient to produce a significant feedback is this quasar. Finally, we show that the heavy soft X-ray absorption that was noticed in the past for this source arises mostly in the Galactic ISM.
Key Words.:
galaxies: individual 4C +74.26 - quasars: absorption lines - quasars: general - X-rays: galaxies1 Introduction
In the last fifteen years,
thanks to the advent of high-resolution X-ray spectrometers,
such as
the XMM-Newton Reflection Grating
Spectrometer (RGS) or
the Chandra Low and High
Energy Transmission Grating
Spectrometers (LETGS and HETGS),
our knowledge of
the circumnuclear gaseous
environment of active galactic
nuclei (AGN)
has advanced significantly.
It is now established that
roughly half
of all local Seyfert galaxies
host a photoionized warm
absorber (WA) that produces
features detectable in
the X-ray and in the UV
band (Crenshaw et al. 2003).
These absorption lines
are usually blueshifted
with respect of the systemic
velocity, which indicates
a global outflow of the
absorbing gas.
Spectroscopical observations
allow the
physical conditions
(kinematics and ionization)
of the gas to be characterized with high accuracy
(see Costantini 2010, for a review).
In photoionization equilibrium,
the ionization parameter
(where is the
ionizing luminosity between 1 and 1000
Ryd, is the gas density, and
is the distance from the ionizing source)
parameterizes the state
of the gas. In the X-ray
band, there are many transitions, for example
from ionized
C, N, O, Ne, and Fe,
which allow
an accurate solution
for to be determined.
From spectroscopical observables,
useful constraints can be put
on the gas location
(Blustin et al. 2005);
these constraints quantify
how much momentum is transferred
by the outflow
to the surrounding medium
(e.g., Crenshaw & Kraemer 2012).
The studies of WA in
Seyfert galaxies
show that these outflows
span roughly four
orders of magnitude in ionization
()
and reach velocities
of a few thousand km s-1(McKernan et al. 2007).
They are often located
as far as the putative
torus (Blustin et al. 2005).
Some outliers
may be located closer to the
nucleus, at the distance
of the accretion disk
or farther out in the galaxy
at kpc distance from
the center (Di Gesu et al. 2013).
In most of the cases,
the kinetic power of the
WA is found to be negligible
with respect to the AGN radiative
power (e.g., Ebrero et al. 2016).
Thus, WA are not expected
to play a significant role
in a possible negative
AGN feedback (Scannapieco & Oh 2004; Somerville et al. 2008; Hopkins et al. 2008; Hopkins & Elvis 2010; King & Pounds 2015).
A different class
of photoionized winds
are the ultrafast
outflows (UFO). These
may be present in 35% of Seyfert galaxies (Tombesi et al. 2010)
and
differ from classical
WA because of the higher outflow
velocity (v0.1 c, where c is the speed
of light) and of the higher ionization
(, Tombesi et al. 2011).
Hence, because of the higher
energy and higher blueshift
of their transitions
(e.g.,
Fe xxv–Fe xxvi),
UFO are detectable
only in lower resolution
CCD spectra.
These powerful winds
are believed to be a nuclear
phenomenon originating
from the accretion disk
(Tombesi et al. 2012; Nardini et al. 2015).
The detection of
photoionized features
in broad line radio galaxies
(BLRG),
which are analogous
to Seyfert 1 galaxies in the radio-loud regime, was expected
to be difficult because
of the presence of a
relativistic jet.
The Doppler-boosted,
non-thermal radiation
of a jet located close
to the line of sight
could actually mask the absorption features.
So far, the statistics
of known WA in BLRG relies
on a handful of cases,
of which only three
are WA detections in
a high-resolution
X-ray dataset.
Hints of
photoionized absorption
were noticed,
for instance,
in the ROSAT-PSPC spectrum
of 3C 351
(Fiore et al. 1993)
and 3C 212 (Mathur 1994).
Interestingly, these
two sources also display
WA features
in the UV
(Mathur et al. 1994; Yuan et al. 2002).
More recently, Molina et al. (2015)
have reported the detection
of O vii
and
of Fe xx absorption
edges in the EPIC-pn spectrum
of IGR J14488-4008,
a giant radio-loud
galaxy discovered
by INTEGRAL.
The first case
of a WA in a BLRG
studied with a grating
spectrum
was a long
Chandra-HETGS spectrum
of 3C 382 (Reeves et al. 2009).
The detection of this WA,
whose location is consistent
with the distance
of the narrow
line region (NLR),
was promptly
confirmed by a subsequent
RGS observation
(Torresi et al. 2010).
A second case is
the remarkable
photoionized outflow in
3C 445.
In the Chandra-HETGS spectrum
of this source Reeves et al. (2010)
detected a low-ionization
outflow moving at
a sub-relativistic velocity.
A deep Suzaku spectrum
also shows indications
of blueshifted absorption
from highly ionized iron
(Braito et al. 2011).
Both these spectra
are consistent
with a scenario where
our line of sight intercepts
an equatorial disk wind
located at sub-pc
scale.
The low-ionization
absorber may consist
of sparse clumps
embedded in a
highly ionized wind
(Reeves et al. 2010).
In addition to these two cases,
Torresi et al. (2012)
report a WA detection
in the RGS spectrum
of 3C 390.3.
Signatures
of more highly ionized
UFO have also been
detected
in the CCD spectra
of a handful of radio-loud
sources (Tombesi et al. 2014),
with a statistical
incidence comparable,
within the uncertainties,
to what is found for radio-quiet
Seyferts.
In this paper we
present the analysis of the
X-ray grating spectrum –
obtained with the RGS
and the Chandra -HETGS –
of the BLRG
4C +74.26.
This source is located at
a redshift of 0.104
(Riley et al. 1989).
In the optical, it
shows broad permitted
lines with a
a FWHM of 10 000 km s-1 for the Hβ
line (Winter et al. 2010).
Using this line width
a SMBH mass of
is inferred.
Because of
its 1 Mpc
projected linear size
(Riley et al. 1989),
this source is the
largest known
radio source associated
with a quasar. Its
radio morphology
is typical for a
Fanaroff-Riley
type II source
(FRII),
although
the 178 MHz
radio luminosity
is borderline
with the
type I class
(FRI).
Observations
with the Very Large Array (VLA)
have revealed a one-sided
jet which is at least
4 kpc long (Riley & Warner 1990).
The flux
limit for a counter-jet,
which could be set with a subsequent
Very Long Baseline Interferometry
(VLBI) observation (Pearson et al. 1992),
implies that the source axis
lies at from
our line of sight.
Evidence
of a high-velocity outflow
in 4C +74.26 was found
in the optical spectropolarimetric
analysis performed in Robinson et al. (1999).
These authors noticed that the broad
H line appears redshifted in polarized light,
which can be explained if the scattering medium
producing the polarization is part
of a polar outflow.
Since 1993,
4C +74.26 has been targeted
by many X-ray observatories,
including
ROSAT,
ASCA,
Beppo-SAX
XMM-Newton,
and Suzaku.
In the XMM-Newton (Ballantyne & Fabian 2005)
and in the Suzaku
(Larsson et al. 2008)
spectrum a
broadened Fe K emission line
has been clearly detected
at 6.4 keV.
Recently,
in the Suzaku
(Gofford et al. 2013)
and the XMM-Newton spectrum
(Tombesi et al. 2014)
additional absorption
features
in the Fe-K band
have been noticed.
These could be
due to a highly ionized
UFO, with a measured
outflow velocity
on the order of
.
By studying the correlations
between the Suzaku light curves
in different bands, Noda et al. (2013)
were able to extract
the stable soft-excess component (Singh et al. 1985)
that may dominate
the continuum emission at
soft energies (i.e., below 2.0 keV).
According to these
authors, the most likely origin for the
soft-excess in this source
is thermal Comptonization
of the disk photons in a warm plasma
(see, e.g., Noda et al. 2011; Done et al. 2012; Jin et al. 2012; Petrucci et al. 2013; Di Gesu et al. 2014; Giustini et al. 2015; Boissay et al. 2016).
It was found, however, that
the soft-excess underlies a
heavy soft X-ray absorption.
For instance,
absorption from a substantial
column density of gas
in excess at the Galactic column density
was seen earlier on
in the ROSAT-PSPC (Brinkmann et al. 1998),
ASCA (Brinkmann et al. 1998; Sambruna et al. 1999; Reeves & Turner 2000),
and Beppo-SAX (Hasenkopf et al. 2002) spectra.
In a more recent XMM-Newton observation,
Ballantyne (2005) detected
a column of cold absorption
greater than the Galactic value,
with an intrinsic column
of cm-2.
Moreover,
the broadband XMM-Newton spectrum shows evidence
of a weak WA
intrinsic to the source.
The WA is highlighted
by features identified
as the O vii and
O viii absorption edges
(Ballantyne & Fabian 2005).
Motivated by these
indications of a complex
absorption in this source,
here we use the archival XMM-Newton Reflection Grating Spectrometer
(RGS) and Chandra High Energy Trasmission Grating Spectrometer
(HETGS) spectra of 4C +74.26
to characterize for the first time
the kinematics and the ionization
condition of the X-ray absorbing
material.
In
Sect. 2 we
describe our data
reduction
procedure.
Then in
Sect. 3
we build the
spectral energy distribution
(SED), and
in Sect. 4
we perform the spectral analysis.
Finally, in Sect. 5
we discuss our results,
and in Sect. 6
we state the conclusions.
The C-statistic (Cash 1979)
is used throughout the paper,
and errors are quoted at the 68
confidence level
(). In all the
spectral models presented,
we use the total Galactic
hydrogen column density
from Willingale et al. (2013,
cm-2).
In our luminosity calculations
we use a cosmological redshift of z=0.104
and a flat cosmology with the following
parameters:
=70 km s-1 Mpc-1,
=0.3, and
=0.7.
| Date | Instrument | Observation ID | Net exposure a𝑎aa𝑎aResulting exposure time after correction for background flares. | Fb𝑏bb𝑏bObserved flux in the quoted bands. | Fb𝑏bb𝑏bObserved flux in the quoted bands. |
|---|---|---|---|---|---|
| (ks) | ( erg s-1 cm-2) | ||||
| 2003 Oct 6 | HETGS | 4000 | 37 | 0.7 | 2.8 |
| 2003 Oct 8 | HETGS | 5195 | 31 | 0.8 | 2.9 |
| 2004 Feb 6 | RGS | 0200910201 | 34 | 0.9 | 3.0 |
2 Observations and data preparation
The radio-loud galaxy
4C +74.26 was observed with Chandra and XMM-Newton in October 2003 and February 2004, respectively.
Thus, the time separation between
these X-ray observations is only 4 months.
In Table 1 we summarize the basic
information of each
observation.
Chandra observed 4C +74.26 for 70 ks in total
using the HETGS in combination
with the ACIS detector.
The total exposure time was
split into two observations
that were taken two days apart.
For both Obs-ID 4000 and 5195
we retrieved the Medium (MEG)
and High Energy Grating (HEG) spectra
and their respective response matrices
from the
tgcat222http://tgcat.mit.edu/ archive.
We further treated these spectral products
with the CIAO tools
(version 4.6).
For each observation and for both HEG and MEG,
we combined the first positive and negative
spectral order using
the CIAO script add_spectral_orders.
Hence, we fitted
jointly HEG and MEG
(allowing a free intercalibration factor)
with a simple phenomenological
power law to check for variability between the
two observations. The fitted slopes
(,
)
and normalizations
(,
)
were very consistent with each other
(see below for a physically motivated fit).
Therefore,
we were able to sum the spectra of individual
observations into a single spectrum
to improve the signal-to-noise ratio.
We did this using the CIAO script
add_grating_spectra.
We reduced the raw XMM-Newton Observation Data Files (ODF),
available
at the ESA archive333http://xmm.esac.esa.int/xsa/,
using the Science Analysis Software
(SAS, version 13) and the
HEASARC FTOOLS.
We created calibrated
EPIC-pn event files
selecting only the
unflagged single events.
To check the time stability
of the background we used
the light curve in
the hard 10–12 keV
band, which is background
dominated. A high level of
background light due to soft proton
contamination is evident
towards the end
of the observation.
Thus, we cleaned the
event file using a time filter,
following the same procedure
explained in Di Gesu et al. (2013).
For RGS-1 and RGS-2
we created calibrated
event files and background
light curves taking
the background from CCD 9.
The RGS background
light curve was quiescent.
Next, for all
the instruments, we extracted
the source and background spectra
and we created the spectral
response matrices.
Finally, we extracted the source
count rate in all the available
OM filters,
namely
( Å),
( Å)
and ( Å).
Using the interactive SAS tool
omsource,
we computed the source count
in a circular region centered
on the source coordinates and
with a radius of 6 pixels.
For the background
we used another circular
region of 12 pixels, free
from other sources
and instrumental
contamination.
We converted the count rates to fluxes using
the standard conversion factors provided
in the SAS watchout web page444http://xmm.vilspa.esa.es/sas/7.1.0/watchout/Evergreen_tips_and_tricks/uvflux_old.shtml.
Hence,
assuming =3.1,
we corrected all
the fluxes for
the Galactic reddening
( =0.39, Schlafly & Finkbeiner 2011).
For the correction,
we used the IDL routine
ccm_unred,
which dereddens a user-defined
vector of fluxes using
the Galactic
extinction curve
of Cardelli et al. (1989).
3 Spectral energy distribution
As the preliminary step of our analysis
we constructed the
spectral energy distribution (SED) of the
source.
This is needed
for the photoionization modeling of the
absorbers.
The OM fluxes
together with the EPIC-pn spectrum
constrain the SED
from optical/UV up to X-ray energies.
We fitted the EPIC-pn data with
a phenomenological model including
a black-body
() at soft energies,
a power law () at hard energies,
and a broad Fe K line (FWHM=0.5 keV).
All these components are absorbed
by the Galactic column density of
=2.31 cm-2 (see the discussion below).
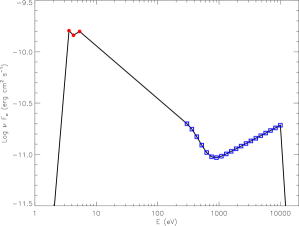
We adopted
the unabsorbed phenomenological continuum
of this fit as the X-ray SED.
Combining this
X-ray continuum
(Fig. 1, open squares)
with the OM fluxes corrected for the Galactic
extinction (Fig. 1, filled circles)
we obtained the SED shown in
Fig 1.
We cut off the SED at low
and high energy, respectively
at 0.01 Ryd and 100 keV.
4 Spectral analysis
4.1 Galactic absorption
The X-ray spectrum of 4C +74.26
showed a heavy soft X-ray absorption
in excess at the Galactic column
measured by 21 cm surveys
(e.g., cm-2, Kalberla et al. 2005)
in all the historical records
(Sect. 1).
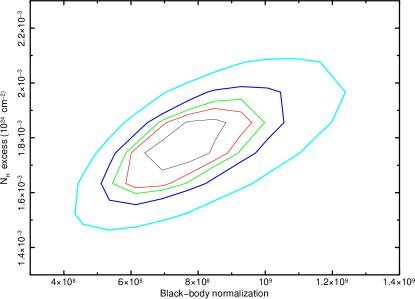
We illustrate this by using
our phenomenological fit of the
EPIC-pn spectrum (Sect. 3).
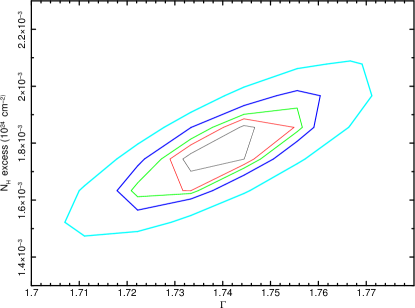
In Fig. 3, we show
the confidence contour (i.e., curves
of constant C) of
the excess as a function
of the modified blackbody normalization (left panel)
and of power-law slope (right panel) .
An excess of of at least
cm-2is observed in both figures
at a confidence level
of 99.99%.
Part of this excess of absorption
can be due to the gas in our
Galaxy rather than to some absorber
intrinsic to the source.
The total foreground
X-ray absorption may be,
in some cases, significantly larger
than the value inferred using
the value provided
by 21 cm surveys (Kalberla et al. 2005; Dickey & Lockman 1990).
The difference
may be ascribed to the presence
of hydrogen in molecular
form (H2) in the
Galactic ISM (Arabadjis & Bregman 1999), which is indeed elusive
to 21 cm measurements.
We used the calibration
of Willingale et al. (2013)
555http://www.swift.ac.uk/analysis/nhtot/index.php
to infer the equivalent
hydrogen column
density of the the molecular
hydrogen ()
along the line of sight
of 4C +74.26.
We found cm-2.
Thus, the total Galactic hydrogen
column density absorbing
the X-ray spectrum is
cm-2, consistent with the
total column density inferred
from the broadband X-ray
spectrum (Ballantyne 2005).
Applying the standard Galactic
/ ratio
(, Predehl & Schmitt 1995),
this hydrogen column density is also consistent
with the Galactic reddening
of =0.39
(Schlafly & Finkbeiner 2011). We
use this Galactic column
density value
in all the spectral analyses performed
here. The remainder of the excess absorption
is due to the photoionized gas of the outflow (see Sect. 4.8).
In fact, as our model shows,
there is no need for additional neutral gas
when this outflow is taken into account.
4.2 Preliminary spectral residuals
We performed the spectral
analysis of the RGS and the HEG
datasets using
SPEX, version 3.0
(Kaastra et al. 1996).
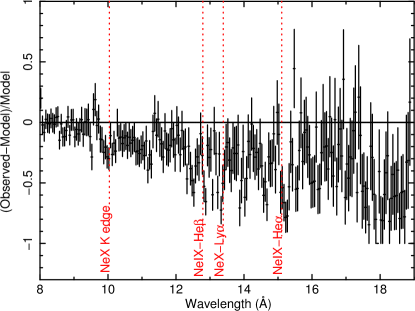
We began by fitting
the RGS spectrum with a simple power-law continuum
absorbed by the Galactic hydrogen column density
and we inspected the relative residuals
(Fig. 2, right panel).
The most prominent
features in the RGS
residuals
is a broad absorption trough
visible at Å.
We note that
the Fe-L edges from
the neutral absorber in our Galaxy
cannot be responsible for this feature,
as they would be expected
at 17.1 Å.
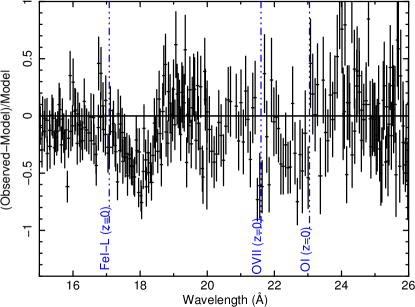
Moving redward,
a narrow feature is clearly visible
located at
the wavelength expected
for the O vii
absorption line
( Å)
at redshift zero.
Between
23 Å and 24 Å,
where redshifted
O vii transitions
are expected,
the residuals are systematically
positive. This structure
is a candidate broad emission
line.
Absorption from other transitions
of ionized oxygen
are also expected
in this crowded spectral region
(e.g., Detmers et al. 2011).
We repeated this exercise
for the HETGS spectrum.
Guided by the knowledge
of the RGS spectrum,
we were able to recognize
in the MEG the
same absorption trough
at 18 Å.
In the MEG this falls towards
the end of the sensitive
band, where the effective area
starts degrading.
Blueward of this,
between 10 and 15 Å,
the HETGS residuals show
some candidate absorption lines
from the main Ne ix–Ne x
transitions, indicating
that some photoionized absorption
may affect this spectrum.
4.3 Setup of the joint RGS/HETGS fit.
The qualitative analysis of
the RGS and MEG
spectra shows hints of a complex
ionized absorption in this source.
In order to accurately disentangle
the multiple absorption components
of this spectrum,
we fit jointly
the RGS and the HETGS datasets.
The negligible variation
in observed flux during the
4 months separating
these two observations
(Table 1)
is indeed an indication
that the source and the absorbers
were in the same conditions
when these two spectra were taken.
With a joint fit we take
advantage of the high
HETGS spectral resolution at short
wavelengths, where most of the
features from higher ionization
species are expected,
and of the high sensitivity of the RGS at
long wavelengths, where
the absorption features
of e.g., ionized iron
and oxygen reside.
In the fit,
we used the RGS between
7 and 30 Å and
the MEG between
2 and 19
Å. The quality
of the HEG spectrum
is worse than the MEG, thus
we use HEG only in the
Fe K region between
1.5 and 5 Å.
For the joint fit,
we created two spectral
sectors in SPEX,
one for the RGS
(RGS 1 and RGS 2)
and one for the HETGS
(HEG and MEG).
In this way,
each instrument
is fitted independently,
but the model parameters
can be coupled.
In the following,
we fit
jointly the HETGS and the RGS
tying the absorption
components together
but allowing
the continua
to vary.
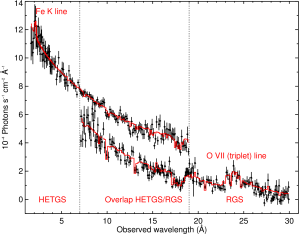
In Fig. 4
we show the final
best fit model in
the total energy
range covered.
4.4 Continuum
We set a simple continuum model comprising a power law and a phenomenological modified blackbody mimicking a soft-excess (Singh et al. 1985) component. For the latter we used the MBB model in SPEX, which includes the effect of Compton scattering (Kaastra & Barr 1989). In the fit we always kept the modified blackbody temperature of the HETGS model coupled to the RGS value because in our fit the band where the soft-excess component is supposed to dominate is mostly covered by the RGS. For the power-law component, we set the initial value of the slope to that determined by the EPIC-pn fit. As the best fit was reached, the value of settled at , while we found eV. The final best fit values for the continua are given in Table 2, first and second panel. A small difference in the normalizations of the continuum components is sufficient to account for the change of flux between the HETGS and the RGS observations.
| Model component | Parameter | RGS value | HETGS value | Units |
|---|---|---|---|---|
| Power law | a𝑎aa𝑎aPower-law slope. | |||
| b𝑏bb𝑏bModel component luminosity, in the quoted band. | erg s-1 | |||
| Blackbody | c𝑐cc𝑐cBlackbody temperature. | 170 | eV | |
| b𝑏bb𝑏bModel component luminosity, in the quoted band. | erg s-1 | |||
| Fe K line | w d𝑑dd𝑑dWavelength of the line centroid. | 1.92 | Å | |
| FWHMe𝑒ee𝑒eFull width at half maximum of the line. | 0.16 | Å | ||
| b𝑏bb𝑏bModel component luminosity, in the quoted band. | 7 | erg s-1 | ||
| O vii (triplet) line | w d𝑑dd𝑑dWavelength of the line centroid. | 21.7 | Å | |
| FWHMe𝑒ee𝑒eFull width at half maximum of the line. | 1.0 | Å | ||
| b𝑏bb𝑏bModel component luminosity, in the quoted band. | 9 | erg s-1 | ||
| Warm Galactic absorber | f𝑓ff𝑓fAbsorber column density. | 1.2 | cm-2 | |
| g𝑔gg𝑔gAbsorber temperature. | 0.20 | keV | ||
| Intrinsic warm absorber | f𝑓ff𝑓fAbsorber column density. | cm-2 | ||
| hℎhhℎhAbsorber ionization parameter. | erg cm s-1 | |||
| i𝑖ii𝑖iAbsorber outflow velocity. | 3600 | km s-1 |
| Wavelength a𝑎aa𝑎aNominal laboratory wavelength of the line. | z b𝑏bb𝑏bRedshift applied. | c𝑐cc𝑐cBlueshift applied. | d𝑑dd𝑑dImprovement of the C-statistics with respect to a model including only the continuum, the emission lines, and the Galactic neutral absorber. | Identification | |
|---|---|---|---|---|---|
| Å | km s-1 | Ion | Transition | ||
| 21.602 | 0.104 | -9 | O vii | ||
| 21.602 | 0 | 0 | -14 | O vii | |
| 13.447 | 0.104 | -96 | Ne ix | ||
| 13.447 | 0 | 0 | -47 | Ne ix | |
| 12.132 | 0.104 | -52 | Ne x | (Ly) | |
| 9.378 ∗*∗*Lines fitted simultaneously with the same blueshift. | 0.104 | -85 | Mg ix | ||
| 9.281∗*∗*Lines fitted simultaneously with the same blueshift. | 0.104 | Mg x | |||
| 9.169 ∗*∗*Lines fitted simultaneously with the same blueshift. | 0.104 | Mg xi | |||
4.5 Emission lines
The presence of a broad Fe K emission line in 4C +74.26 is well
established (Ballantyne & Fabian 2005; Larsson et al. 2008).
The line is also clearly visible
in the HETGS data (Fig. 4).
We fitted it with a phenomenological
Gaussian emission line with free centroid,
width, and normalization.
The values we obtained
(Table 2, third panel)
are consistent both with what
is reported in the literature (Ballantyne 2005)
and with our phenomenological
fit of the EPIC-pn (Sect. 3).
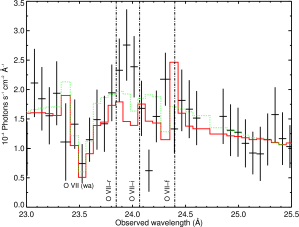
In Fig. 5,
we show the
spectrum in the 23–25.5 Å range
where we already noticed an
excess in the residuals (Sect. 4.2)
reminiscent of a broad emission line.
At first, we tested whether these
residuals could be accounted for
with a narrow-profiled O vii
triplet. We added to the fit three
delta-profiled emission lines
(DELT model in SPEX) for the
resonance (=21.6 Å),
intercombination (=21.8 Å),
and forbidden line (=21.1 Å).
We left the normalization
of the forbidden line free to vary
and we assumed a ratio 1:3 for the
other lines, as expected
if photoionization occurs
in a low-density plasma
approximation (Porquet & Dubau 2000). This
fit (Fig. 5)
does not reproduce
the data well and leaves
large residuals between 23
and 24 Å.
Thus, we added to the fit
a Gaussian profiled
emission line.
We left the line centroid free to vary
among the nominal wavelengths of the
O vii triplet and we
used the width of the broad
line given
in Winter et al. (2010) to set
the fitting range
for the width of
a blended triplet
(FWHM=[0.36–1.23]Å).
A broad O vii line
having FWHM=
better accounts for the excess in the
residuals in the 23–25.5 Å region.
For the final
fit, the statistical improvement
produced by the addition of
the O vii broad line
is for
three additional degrees
of freedom. An F-test gives
a probability of a chance
improvement of .
In this fit the normalization
of the narrow components
goes to zero,
indicating that the data quality
does not allow them to be deblended
from the broad component.
The modeling of the broad
emission line is critical
for a correct evaluation
of the absorption
(e.g., Costantini et al. 2007; Di Gesu et al. 2013)
because many transitions from
ionized oxygen may in principle
be detected within the line
profile.
We outline in Table 2,
third and fourth panel,
the final best fit values
for the line parameters.
4.6 Line-by-line fitting of the absorption features
Before proceeding with a global modeling
of the absorbing components, we first attempted
to identify the absorption features of the
spectrum on a line-by-line basis
(e.g., Ebrero et al. 2013).
We note, however, that not all
the WA features can be identified
with this method because
of blending with neighboring transitions
(e.g., the Fe-UTA)
or with other components (e.g., Galactic).
Moreover, only a global modeling
is able to account for the additional continuum
curvature produced, for example, by an ionized
absorber.
We visually identified in the spectrum
the most prominent features, and
for each of these
we added to the model a Gaussian
profiled absorption line multiplied
by a blueshift model.
The line centroid was set to the wavelength
of the nearest known transition, while the line FWHM
was set to the default value of 0.1 Å. Thus,
in this exercise, the free parameters
were the line normalization and the
blueshift.
In Table 3 we list our line
identifications. In the RGS band
we detected an O vii resonance line
at redshift zero and at the redshift of
4C +74.26. The addition of
an O viii-Ly line ( Å) line
at the redshift of the source
resulted instead in a negligible
improvement of the fit (=-3).
In the HETGS band, we detected
absorption from Ne ix at redshift 0
and from Ne ix, Ne x,
Mg ix, Mg x, and Mg xi
in the source rest-frame. The magnesium
lines are blended, so we fitted them
simultaneously with the same
blueshift. All
the lines detected in
the HETGS band show a
similar blueshift, suggesting
that they may be part
of the same outflowing system.
4.7 Absorption at redshift zero
We modeled the Galactic cold
absorption using a collisionally
ionized plasma model in SPEX
(HOT), setting a temperature
of 0.5 eV for the neutral gas
case. This component produces
O i and Fe i
absorption at 23.5 Å and
17.4 Å, respectively.
As pointed out in Sect.
4.2 narrow absorption lines
from O vii and Ne ix
at redshift zero are detected respectively
in the RGS and in the HETGS spectrum.
These could originate in the warm
plasma of the Galactic corona,
which is collisionally ionized
(e.g., Yao & Wang 2005; Pinto et al. 2012).
To model it, we added another
HOT component to the fit.
We left both and
the gas column density
free to vary. We kept instead
the broadening velocity frozen
to the default value of 100 km s-1.
The final best fit values
that we found for all these
free parameters are listed
in Table 2,
fifth panel.
4.8 Intrinsic photoionized absorption
We modeled the intrinsic
photoionized absorption
using the XABS model
in SPEX which computes the transmission
of a slab of material
where all the ionic column densities are linked
to each other
through the photoionization balance
prescribed by the SED
(Fig. 1).
We computed the SED
with the SPEX auxiliary tool XABSINPUT
and the photoionization code Cloudy (Ferland et al. 2013),
version 13.01.
For the XABS component,
we allowed the column density, the
ionization parameter, and
the outflow velocity of the gas to
vary, while we kept the broadening
velocity frozen to the default value
of 100 km s-1.
We found that an intrinsic photoionized
absorber with
cm-2 and
best fits
the candidate absorption features
of the spectrum. The systematic blueshift
of the lines corresponds
to an outflow velocity of
km s-1.
We list in Table 2, sixth panel,
the best fit parameters for the WA.
After achieving the best fit,
we decoupled the column density
and the ionization parameter
of the RGS model from the HETGS values
to check for a possible
time variability of the WA
in the 4 months
separating the HETGS from
the RGS observation.
We found that during this time interval
the WA parameters are consistent
not to have varied.
We note that a
one-zone WA is sufficient
to best fit the ionized
absorption features of
the spectrum. Indeed,
the fit erases any additional
ionized absorbing
components, either
photoionized or collissionally
ionized.
The final C-statistics for
a model including two
Galactic absorbers and
an intrinsic WA
is C/Expected C=1065/931.
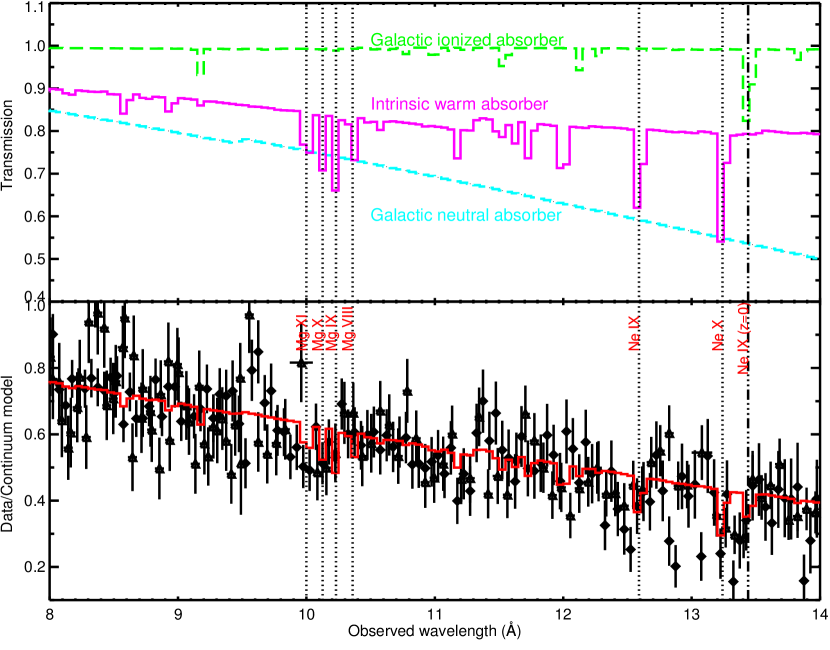
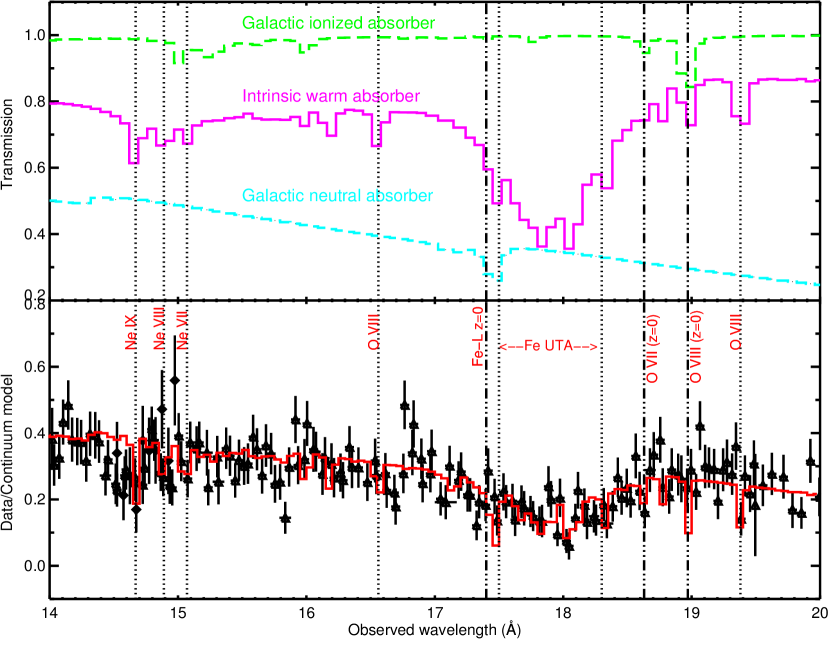
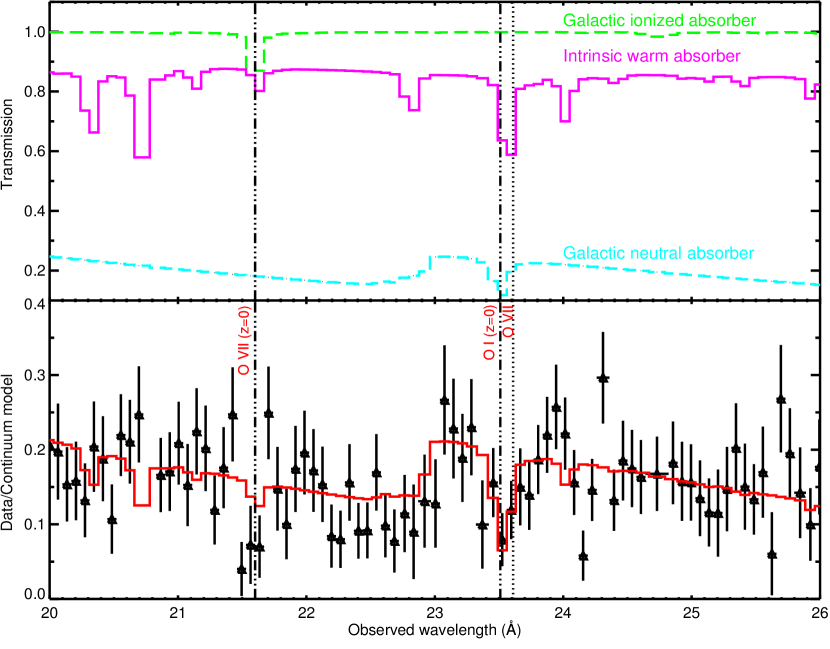
In Fig. 6,
we show the transmission of all
the absorbing components
of the model, together
with the ratio between
the data and the continuum
model, which highlights
the absorption features.
In the RGS band the most
evident WA feature
is the broad absorption
trough visible at 18 Å.
This
is mostly produced by
the unresolved transitions array (UTA)
from the ionized iron
(e.g., Fe x–Fe xx)
contained in the photoionized
gas. In addition,
a O vii absorption line
is prominent at 23.5 Å.
This feature is blended with
the O i line from
the neutral absorber in
the Galaxy. In the HETGS band,
the absorption lines are weak.
The most apparent features
are from highly ionized
species, such as
Ne vii–Ne x
and Mg viii–Mg xi.
5 Discussion
We have presented
a joint analysis of the RGS
and HETGS spectra
of the heavily X-ray
absorbed radio-loud quasar
4C +74.26.
Thanks to the high spectral
resolution of these grating spectra,
we were able to reveal a rich
spectrum of absorption
features originating from
both Galactic
and intrinsic material.
In our analysis
we used the total Galactic
column density given
in Willingale et al. (2013),
which includes the contribution
of molecular hydrogen.
This is roughly twice
the value provided
by 21 cm surveys.
The enhanced Galactic
absorption explains
the heavy suppression
of the soft X-ray
flux that was noticed
in the past for this
source (Brinkmann et al. 1998; Sambruna et al. 1999; Reeves & Turner 2000; Hasenkopf et al. 2002; Ballantyne & Fabian 2005).
The intrinsic
absorption comprises
a highly ionized WA
which produces
a deep Fe-UTA trough in the RGS
and the weak absorption
features that are visible in the
HETGS spectrum. We found that
an outflow velocity of km s-1 is required for a best fit of the absorption
features visible in the two spectra.
This finding is
evidence for WA absorption
in radio-loud objects, which so far
has been scarce.
Indeed, in addition to
3C 382, 3C 445 and 3C 390.3,
4C +74.26 is the fourth radio-loud source
where a photoionized outflow
has been clearly characterized
in a high-resolution
dataset.
The column density, ionization
parameter, and outflow
velocity that we measured for
the WA in 4C +74.26 are
within the
range observed in Seyfert 1
galaxies (McKernan et al. 2007)
and are also in line with the values
found in 3C 382 and
3C 390.3, the other
two radio-loud galaxies
hosting a classical
WA. The case of 3C 445
is an outlier, as this source
hosts a high-velocity,
high-column UFO-like wind
(see the review of Torresi et al. 2012).
In the following sections
we use the results of our
spectral analysis and the
information from the literature
to infer a possible geometrical
model for the outflow is this AGN.
To this purpose,
in Sect. 5.1
we estimate the possible location
and the energetics of
the warm absorber.
In Table 4,
upper panel, we outline
some basic physical
properties of the source that
serve for an order of magnitude
comparison.
We took the black hole
mass
and the source inclination
from the literature
as already explained
in Sect. 1.
From a numerical integration
of the SED of Fig. 1
we computed the ionizing luminosity
between 1 and 1000 Ry
and the bolometric luminosity
over the whole optical and
X-ray band. We note that
the bolometric luminosity is
probably underestimated
because the radio emission at
low energies and the gamma ray emission
at high energies are not included
in our SED.
Hence, using these data
we estimated the Eddington
luminosity
and the mass accretion rate ,
for which we assumed an accretion efficiency
.
For the jet power
we used the radio flux
at 1.4 GHz (Condon et al. 1998)
and the scaling relationship
of Cavagnolo et al. (2010).
The radius of the
broad line region
scales with the optical luminosity
at 5100 Å (Wandel 2002).
The luminosity value is given in
Winter et al. (2010).
Finally,
the radius of the putative torus ,
which is nominally set by the dust sublimation radius,
scales with
(Krolik & Kriss 2001).
5.1 Location and energetics of the ionized outflow
In Table 4,
lower panel, we outline
some physical properties
of the ionized
outflow that we estimated
using our measured parameters,
namely
cm-2,
, and
km s-1.
We follow here the argumentation
of Blustin et al. (2005), which
assumes that the outflow
is a partially filled
spherical shell of gas with
a volume filling factor .
An analytical expression for the volume
filling factor is derived
in Blustin et al. (2005) from
the prescription that the kinetic
momentum of the outflow
must be on the order of the momentum
of the absorbed radiation plus the momentum
of the scattered radiation.
For the ionized outflow in 4C +74.26 we found that the
ionized gas fills only
of the
spherical volume, which suggests that
it may consist of sparse clumps.
We set a range of possible distances
for the absorber from the conditions
that the velocity of the outflow
must exceed the escape velocity from the
AGN and that the outflowing shell must not
be thicker than its distance
from the center ().
Analytically,
where G is the gravitational constant.
For our parameters,
both these expressions return
a value of 2 pc (Table 4).
This constrains
the ionized outflow of 4C +74.26 to be located
outside the BLR
( pc),
but within the boundary
of the putative torus
( pc).
A patchy ionized outflow located
outside the BLR is a natural
candidate for being
the scattering outflow that is
required in the Robinson et al. (1999)
analysis of the polarized
optical spectrum of this
source. Their model prescribes
that the observed redshift
of the polarized H
line is due to a high-velocity
motion of the scattering material
which polarizes the BLR light.
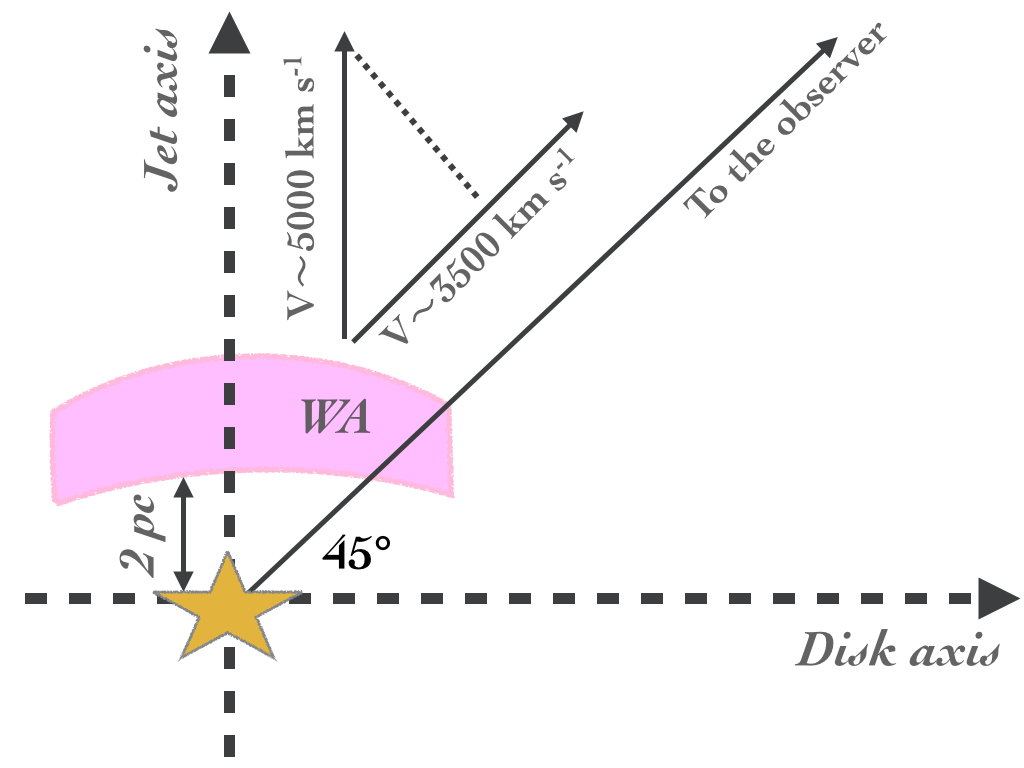
In this framework, the
outflow velocity inferred
for the scatterer
depends on the inclination
of the scattering cone
with respect to the jet axis.
For the case of a scattering outflow
coaligned with the radio jet, they
quote a velocity of 5000 km s-1.
Interestingly, if we consider
the same source inclination
used in the Robinson et al. (1999)
model ()
and we assume that the WA
found in our analysis
is outflowing along
the polar axis of the source,
we obtain a deprojected
velocity of 5000 km s-1 (Fig. 7).
This matches the
Robinson et al. (1999) prediction.
This correspondence hints
at the possibility that
the WA detected here
and the outflowing polar scatterer
discovered in Robinson et al. (1999) are one
and the same.
Given the velocity,
the mass outflow rate is given by
where is the proton mass
and is the solid
angle of the outflow, which
we set to 2.1 sr,
as in Torresi et al. (2012).
This is derived assuming that
at least 50%
of radio-loud objects host
an outflow, like in a Seyferts galaxy,
and using the information
that 33%
of the radio galaxies belonging to
the 3CR sample are type 1 AGN
(Buttiglione et al. 2009). Hence, using the mass
outflow rate, the kinetic
luminosity of the outflow is
readily computed as
.
The value we obtained
for the kinetic luminosity is
at least four
orders of magnitude lower
than the bolometric luminosity.
Theoretical AGN feedback models
(e.g., Di Matteo et al. 2005; Hopkins & Elvis 2010) typically require
kinetic luminosities
comparable with the
bolometric luminosity
for an outflow
to be able to halt
the star formation in
a typical galactic bulge.
Thus, this outflow is
unable to deliver
a significant feedback
in this AGN.
Moreover,
as found for the
other radio-loud galaxies
hosting a WA,
the kinetic luminosity
of the outflow is
negligible compared
to the jet power (
).
Thus, the case of
4C +74.26 confirms that
the jet is a more likely
driver of AGN feedback
in radio-loud galaxies
(Torresi et al. 2012).
| Source properties | Ref |
|---|---|
| Winter et al. (2010) | |
| Pearson et al. (1992) | |
| erg s-1 | Sect. 5 |
| Sect. 5 | |
| yr-1 | Sect. 5 |
| erg s-1 | Sect. 5 |
| erg s-1 | Sect. 5 |
| Sect. 5 | |
| pc | Sect. 5 |
| pc | Sect. 5 |
| Ionized outflow properties | Ref |
| 1.6 pc | Sect. 5.1 |
| Sect. 5.1 | |
| yr-1 | Sect. 5.1 |
| Sect. 5.1 |
6 Summary
We performed a joint analysis
of the RGS and HETGS spectra
of the radio-loud quasar 4C +74.26.
The spectrum is
affected by a heavy X-ray
absorption arising
from both Galactic
and intrinsic material.
Most of the
absorption in the soft X-ray band
is due to the Galactic
ISM. We point out
that when also considering
the contribution of molecular hydrogen,
the total Galactic is
roughly twice the
standard value provided
by 21 cm surveys.
A photoionized outflow
( cm-2,
,
km s-1)
located at the source rest-frame
produces a sharp Fe-UTA trough in the RGS
and the weak absorption
features visible in the HETGS.
The kinetic luminosity
carried by the outflowing
gas () is negligible for
the AGN feedback in this
source.
We discuss a scenario where the photoionized gas is
part of a polar-scattering outflow, also detected
in the optical-polarized spectrum.
Acknowledgements.
The scientific results are based on data obtained from the Chandra and the XMM-Newton data archives. SRON is supported financially by NWO, the Netherlands Organization for Scientific Research. LDG acknowledges support from the Swiss National Science Foundation. We thank Enrico Piconcelli, Margherita Giustini, and Francesco Tombesi for useful discussions. We thank Jelle Kaastra and Missagh Mehdipour for commenting and carefully reading this manuscript.References
- Arabadjis & Bregman (1999) Arabadjis, J. S. & Bregman, J. N. 1999, ApJ, 510, 806
- Ballantyne (2005) Ballantyne, D. R. 2005, MNRAS, 362, 1183
- Ballantyne & Fabian (2005) Ballantyne, D. R. & Fabian, A. C. 2005, ApJ, 622, L97
- Blustin et al. (2005) Blustin, A. J., Page, M. J., Fuerst, S. V., Branduardi-Raymont, G., & Ashton, C. E. 2005, A&A, 431, 111
- Boissay et al. (2016) Boissay, R., Ricci, C., & Paltani, S. 2016, A&A, 588, A70
- Braito et al. (2011) Braito, V., Reeves, J. N., Sambruna, R. M., & Gofford, J. 2011, MNRAS, 414, 2739
- Brinkmann et al. (1998) Brinkmann, W., Otani, C., Wagner, S. J., & Siebert, J. 1998, A&A, 330, 67
- Buttiglione et al. (2009) Buttiglione, S., Capetti, A., Celotti, A., et al. 2009, A&A, 495, 1033
- Cardelli et al. (1989) Cardelli, J. A., Clayton, G. C., & Mathis, J. S. 1989, ApJ, 345, 245
- Cash (1979) Cash, W. 1979, ApJ, 228, 939
- Cavagnolo et al. (2010) Cavagnolo, K. W., McNamara, B. R., Nulsen, P. E. J., et al. 2010, ApJ, 720, 1066
- Condon et al. (1998) Condon, J. J., Cotton, W. D., Greisen, E. W., et al. 1998, AJ, 115, 1693
- Costantini (2010) Costantini, E. 2010, Space Sci. Rev., 157, 265
- Costantini et al. (2007) Costantini, E., Kaastra, J. S., Arav, N., et al. 2007, A&A, 461, 121
- Crenshaw & Kraemer (2012) Crenshaw, D. M. & Kraemer, S. B. 2012, ApJ, 753, 75
- Crenshaw et al. (2003) Crenshaw, D. M., Kraemer, S. B., & George, I. M. 2003, ARA&A, 41, 117
- Detmers et al. (2011) Detmers, R. G., Kaastra, J. S., Steenbrugge, K. C., et al. 2011, A&A, 534, A38
- Di Gesu et al. (2013) Di Gesu, L., Costantini, E., Arav, N., et al. 2013, A&A, 556, A94 (Paper I)
- Di Gesu et al. (2014) Di Gesu, L., Costantini, E., Piconcelli, E., et al. 2014, A&A, 563, A95
- Di Matteo et al. (2005) Di Matteo, T., Springel, V., & Hernquist, L. 2005, Nature, 433, 604
- Dickey & Lockman (1990) Dickey, J. M. & Lockman, F. J. 1990, ARA&A, 28, 215
- Done et al. (2012) Done, C., Davis, S. W., Jin, C., Blaes, O., & Ward, M. 2012, MNRAS, 420, 1848
- Ebrero et al. (2013) Ebrero, J., Kaastra, J. S., Kriss, G. A., de Vries, C. P., & Costantini, E. 2013, MNRAS, 435, 3028
- Ebrero et al. (2016) Ebrero, J., Kaastra, J. S., Kriss, G. A., et al. 2016, A&A, 587, A129
- Ferland et al. (2013) Ferland, G. J., Porter, R. L., van Hoof, P. A. M., et al. 2013, Rev. Mexicana Astron. Astrofis., 49, 137
- Fiore et al. (1993) Fiore, F., Elvis, M., Mathur, S., Wilkes, B. J., & McDowell, J. C. 1993, ApJ, 415, 129
- Giustini et al. (2015) Giustini, M., Turner, T. J., Reeves, J. N., et al. 2015, A&A, 577, A8
- Gofford et al. (2013) Gofford, J., Reeves, J. N., Tombesi, F., et al. 2013, MNRAS, 430, 60
- Hasenkopf et al. (2002) Hasenkopf, C. A., Sambruna, R. M., & Eracleous, M. 2002, ApJ, 575, 127
- Hopkins & Elvis (2010) Hopkins, P. F. & Elvis, M. 2010, MNRAS, 401, 7
- Hopkins et al. (2008) Hopkins, P. F., Hernquist, L., Cox, T. J., & Kereš, D. 2008, ApJS, 175, 356
- Jin et al. (2012) Jin, C., Ward, M., Done, C., & Gelbord, J. 2012, MNRAS, 420, 1825
- Kaastra & Barr (1989) Kaastra, J. S. & Barr, P. 1989, A&A, 226, 59
- Kaastra et al. (1996) Kaastra, J. S., Mewe, R., & Nieuwenhuijzen, H. 1996, in UV and X-ray Spectroscopy of Astrophysical and Laboratory Plasmas, ed. K. Yamashita & T. Watanabe, 411–414
- Kalberla et al. (2005) Kalberla, P. M. W., Burton, W. B., Hartmann, D., et al. 2005, A&A, 440, 775
- King & Pounds (2015) King, A. & Pounds, K. 2015, ARA&A, 53, 115
- Krolik & Kriss (2001) Krolik, J. H. & Kriss, G. A. 2001, ApJ, 561, 684
- Larsson et al. (2008) Larsson, J., Fabian, A. C., Ballantyne, D. R., & Miniutti, G. 2008, MNRAS, 388, 1037
- Mathur (1994) Mathur, S. 1994, ApJ, 431, L75
- Mathur et al. (1994) Mathur, S., Wilkes, B., Elvis, M., & Fiore, F. 1994, ApJ, 434, 493
- McKernan et al. (2007) McKernan, B., Yaqoob, T., & Reynolds, C. S. 2007, MNRAS, 379, 1359
- Molina et al. (2015) Molina, M., Venturi, T., Malizia, A., et al. 2015, MNRAS, 451, 2370
- Nardini et al. (2015) Nardini, E., Reeves, J. N., Gofford, J., et al. 2015, Science, 347, 860
- Noda et al. (2013) Noda, H., Makishima, K., Nakazawa, K., et al. 2013, PASJ, 65
- Noda et al. (2011) Noda, H., Makishima, K., Yamada, S., et al. 2011, PASJ, 63, S925
- Pearson et al. (1992) Pearson, T. J., Blundell, K. M., Riley, J. M., & Warner, P. J. 1992, MNRAS, 259, 13P
- Petrucci et al. (2013) Petrucci, P.-O., Paltani, S., Malzac, J., et al. 2013, A&A, 549, A73
- Pinto et al. (2012) Pinto, C., Kriss, G. A., Kaastra, J. S., et al. 2012, A&A, 541, A147
- Porquet & Dubau (2000) Porquet, D. & Dubau, J. 2000, A&AS, 143, 495
- Predehl & Schmitt (1995) Predehl, P. & Schmitt, J. H. M. M. 1995, A&A, 293, 889
- Reeves et al. (2010) Reeves, J. N., Gofford, J., Braito, V., & Sambruna, R. 2010, ApJ, 725, 803
- Reeves et al. (2009) Reeves, J. N., Sambruna, R. M., Braito, V., & Eracleous, M. 2009, ApJ, 702, L187
- Reeves & Turner (2000) Reeves, J. N. & Turner, M. J. L. 2000, MNRAS, 316, 234
- Riley & Warner (1990) Riley, J. M. & Warner, P. J. 1990, MNRAS, 246, 1P
- Riley et al. (1989) Riley, J. M., Warner, P. J., Rawlings, S., et al. 1989, MNRAS, 236, 13P
- Robinson et al. (1999) Robinson, A., Corbett, E. A., Axon, D. J., & Young, S. 1999, MNRAS, 305, 97
- Sambruna et al. (1999) Sambruna, R. M., Eracleous, M., & Mushotzky, R. F. 1999, ApJ, 526, 60
- Scannapieco & Oh (2004) Scannapieco, E. & Oh, S. P. 2004, ApJ, 608, 62
- Schlafly & Finkbeiner (2011) Schlafly, E. F. & Finkbeiner, D. P. 2011, ApJ, 737, 103
- Singh et al. (1985) Singh, K. P., Garmire, G. P., & Nousek, J. 1985, ApJ, 297, 633
- Somerville et al. (2008) Somerville, R. S., Hopkins, P. F., Cox, T. J., Robertson, B. E., & Hernquist, L. 2008, MNRAS, 391, 481
- Tombesi et al. (2012) Tombesi, F., Cappi, M., Reeves, J. N., & Braito, V. 2012, MNRAS, 422, 1
- Tombesi et al. (2011) Tombesi, F., Cappi, M., Reeves, J. N., et al. 2011, ApJ, 742, 44
- Tombesi et al. (2010) Tombesi, F., Cappi, M., Reeves, J. N., et al. 2010, A&A, 521, A57
- Tombesi et al. (2014) Tombesi, F., Tazaki, F., Mushotzky, R. F., et al. 2014, MNRAS, 443, 2154
- Torresi et al. (2012) Torresi, E., Grandi, P., Costantini, E., & Palumbo, G. G. C. 2012, MNRAS, 419, 321
- Torresi et al. (2010) Torresi, E., Grandi, P., Longinotti, A. L., et al. 2010, MNRAS, 401, L10
- Wandel (2002) Wandel, A. 2002, ApJ, 565, 762
- Willingale et al. (2013) Willingale, R., Starling, R. L. C., Beardmore, A. P., Tanvir, N. R., & O’Brien, P. T. 2013, MNRAS, 431, 394
- Winter et al. (2010) Winter, L. M., Lewis, K. T., Koss, M., et al. 2010, ApJ, 710, 503
- Yao & Wang (2005) Yao, Y. & Wang, Q. D. 2005, ApJ, 624, 751
- Yuan et al. (2002) Yuan, Q., Green, R. F., Brotherton, M., et al. 2002, ApJ, 575, 687