Control of spatial correlations between Rydberg excitations using rotary echo
Abstract
We manipulate correlations between Rydberg excitations in cold atom samples using a rotary-echo technique. The correlations are due to interactions between the Rydberg atoms. In the rotary-echo excitation sequence, the phase of the excitation pulse is flipped at a selected time during the pulse. We measure the resultant change in the spatial pair correlation function of the excitations via direct position-sensitive atom imaging. For zero detuning of the lasers from the interaction-free Rydberg-excitation resonance, the pair-correlation value at the most likely nearest-neighbor Rydberg-atom distance is substantially enhanced when the phase is flipped at the middle of the excitation pulse. In this case, the rotary echo eliminates most uncorrelated (un-paired) atoms, leaving an abundance of correlated atom pairs at the end of the sequence. In off-resonant cases, a complementary behavior is observed. We further characterize the effect of the rotary-echo excitation sequence on the excitation-number statistics of the atom sample.
pacs:
32.80.Ee, 34.20.Cf, 32.80.QkRecently there has been a growing interest in applications of correlated Rydberg-atom systems. The correlations arise from strong electrostatic interactions between the Rydberg atoms, which lead to an excitation blockade (Lukin et al., 2001; Urban et al., 2009; Weber et al., 2015). The correlations have been utilized to realize non-classical light sources, such as single-photon sources as well as sources of correlated photons (Dudin and Kuzmich, 2012). Blockaded Rydberg-atom samples can exhibit sub-Poissonian statistics for the Rydberg-atom number distribution (Liebisch et al., 2005; Malossi et al., 2014; Schempp et al., 2014). Higher-order correlation leads to Rydberg-atom aggregation(Amthor et al., 2010; Gärttner et al., 2013; Schempp et al., 2014; Lesanovsky and Garrahan, 2014; Urvoy et al., 2015) and crystallization of Rydberg excitations (Pohl et al., 2010; Schauß et al., 2012, 2015).
In previous studies, the correlations between Rydberg atoms have been enhanced by detuning the excitation laser to match the van der Waals energy level shift at a well-defined pair separation (Schwarzkopf et al., 2013; Thaicharoen et al., 2015). Another method to control Rydberg-atom correlations, proposed by Wüster et. al. (Wüster et al., 2010), is based on a rotary excitation echo. As found previously, in simulations (Hernández and Robicheaux, 2008) and in experiments (Raitzsch et al., 2008; Younge and Raithel, 2009), a rotary Rydberg-atom excitation echo occurs when the sign of the Rabi frequency is flipped in the middle of the excitation pulse. The rotary-echo technique can also be used in Rydberg-atom interferometry (Dunning et al., 2014; Wang et al., 2015). Of particular relevance to this paper, it was predicted in (Wüster et al., 2010) that a rotary-echo excitation pulse leads to an enhancement of the Rydberg pair correlation function at a separation near the blockade radius.
In the present work, we employ a rotary-echo sequence to excite cold 85Rb atoms into Rydberg states. We use a position-sensitive Rydberg-atom imaging and counting method (Schwarzkopf et al., 2013) to explore the effects of the echo on spatial Rydberg-atom correlations and on the excitation-number statistics. Both these observables for correlation in cold Rydberg-atom ensembles have been studied previously in the absence of a rotary echo (see (Schwarzkopf et al., 2011, 2013) and (Liebisch et al., 2005; Malossi et al., 2014; Schempp et al., 2014), respectively). Here, we demonstrate that a rotary-echo sequence can substantially enhance spatial correlations between the Rydberg excitations prepared within the atom samples. We further observe that the rotary echo strongly affects the counting number statistics of Rydberg excitations in the samples. Studying cases of different laser detunings relative to the interaction-free atomic transition, we establish that the rotary-echo-induced features strongly depend on the laser detuning. Particularly, it is seen that the rotary echo gives rise to strong spatial correlations when the excitation lasers are on-resonant, while in certain off-resonant cases the echo causes the opposite effect, namely the destruction of spatial correlations that would otherwise be present.
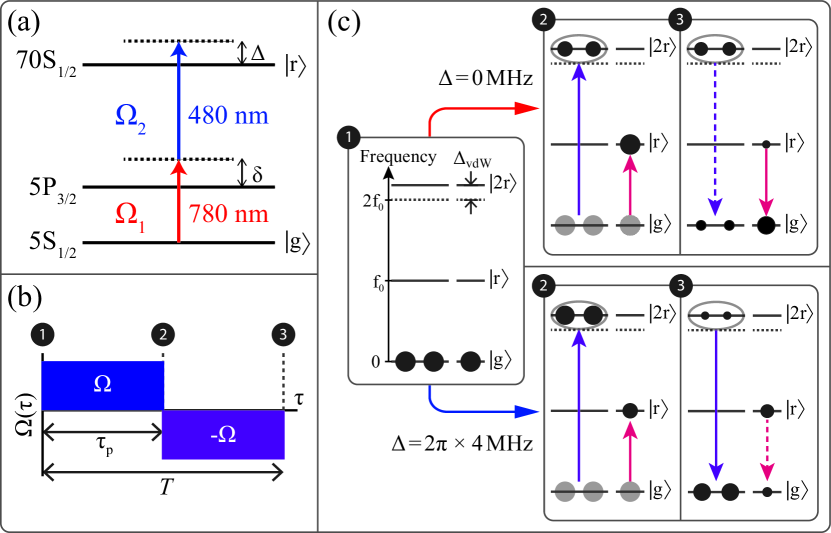
Schematics of the experiment and the timing sequence are presented in Fig. 1. Cold 85Rb atoms in the state are excited to the state via two-photon excitation using 780- and 480-nm laser pulses that overlap in time and have a duration ns. The 780-nm laser has a Gaussian beam parameter w mm and a power of 600 W. The 480-nm laser has a wm and a power of 30 mW. The detuning from the intermediate state 5P3/2 is MHz. At the beam center, the Rabi frequencies of the lower and upper transitions are MHz and MHz, respectively, leading to a two-photon (one 780 nm and one 480 nm photon) Rabi frequency for single-atom excitation at the two-photon resonance ( = 0) of MHz. In the case of substantial detuning , Rydberg atoms may instead be directly excited in pairs at a separation where the detuning matches the van der Waals interaction (see next paragraph). When MHz, as used in some of our experiments, the Rabi frequency for the simultaneous excitation of such pairs is MHz.
At MHz, atom pairs are efficiently excited at a measured pair separation m, where the excess energy associated with the laser excitation of the atoms equals the van-der-Waals energy shift, , where is the van-der-Waals dispersion coefficient (Schwarzkopf et al., 2013; Thaicharoen et al., 2015). This effect arises because the presence of Rydberg atoms in the sample facilitates the addition of new Rydberg atoms at a fairly well-defined facilitation radius that depends on laser detuning and interaction strength (Amthor et al., 2010; Gärttner et al., 2013; Schempp et al., 2014; Lesanovsky and Garrahan, 2014; Urvoy et al., 2015). In the present work, we employ this effect to prepare an abundance of Rydberg-atom pairs at a well-defined internuclear separation.
To implement a rotary echo, we shift the phase of the radio frequency (RF) signal that is applied to the acousto-optic modulator that determines the optical phase of the 480-nm laser pulse. We use a -power splitter together with a high-isolation RF switch to change the phase of the RF signal by at time after the excitation lasers are turned on, as shown in Fig. 1(b). The phase-flip time is varied from 0 to 250 ns, with a step size of 25 ns. Immediately after the excitation pulse, we field-ionize the Rydberg atoms by applying a high voltage to a tip imaging probe (TIP). The field ions are counted and their positions are measured using a position-sensitive microchannel plate and phosphor screen assembly (MCP) with a CCD camera. Each CCD image contains ion blips whose positions represent the 2-dimensional projection of the positions of the parent Rydberg atoms in the excitation region. The excitation region is determined by the position of the 480-nm beam, which is centered 470 m above the TIP. At this distance, the ion-imaging setup provides a magnification of 150 (see Ref. (Thaicharoen et al., 2015) for the magnification calibration process). For each detuning and flip time we take 10000 images and choose the 5000 images with the highest numbers of excitations to calculate pair correlation images. Angular integrals of the pair correlation images yield the radial pair correlation functions . Quantitative information on the echo effect is then extracted from the .
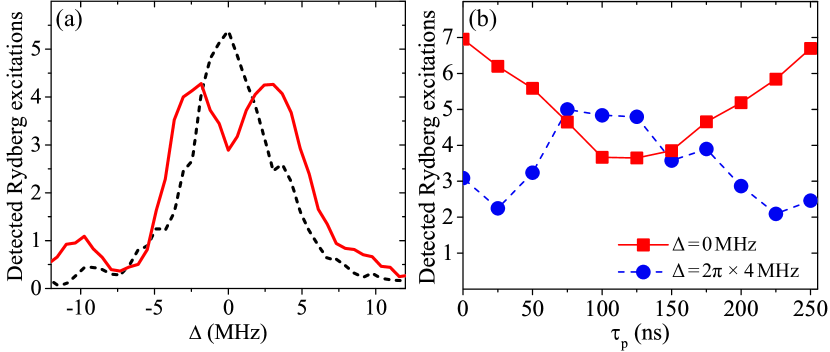
To verify that a rotary echo (Hernández and Robicheaux, 2008; Raitzsch et al., 2008; Younge and Raithel, 2009) occurs in our experiment, we measure Rydberg excitation spectra for and 125 ns, as shown in Fig. 2(a). The peak position in the echo-free spectrum () marks the on-resonant transition . The echo occurs when is close to half of the pulse duration. In this case, the spectra are broader and have a depression of detected Rydberg counts at [Fig. 2(a)]; the counts have a minimum when ns [Fig. 2(b)], as expected for a rotary echo.
In Fig. 2(a), the signal does not drop to zero at , as would be the case for a perfect echo, due to the following reasons. First, slightly off-resonantly excited atom pairs whose pair energies are shifted due to the van der Waals interactions do not undergo a perfect echo; this is the effect we essentially exploit later in this work. Second, the spectrum is convolved with the profile of the shot-to-shot laser-frequency jitters. We have simulated the excitation spectra of atom pairs in a disordered atomic sample and convolved the results with a Gaussian profile for the frequency jitter. Assuming a full-width-at-half-maximum (FWHM) of 3 to 4 MHz for the Gaussian profile, we obtain simulated spectra that are consistent with the experimentally observed ones. Of lesser importance is the residual Doppler effect, which may broaden spectral structures by several 100 kHz. We further believe that phase noise of the lasers during individual excitation sequences is not important.
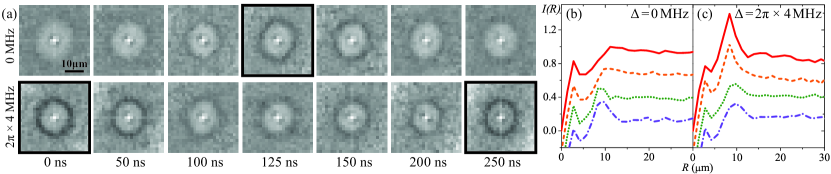
We now turn to describing the effect of the echo sequence on the spatial pair-correlation functions and the Rydberg-atom-counting statistics. The pair correlation images measured for MHz are shown in the top row of Fig. 3(a). When is increased from 0 or decreased from towards , the pair correlation image clearly develops an enhancement ring with a radius of about m. Visual inspection of the images in Fig. 3(a) shows that the enhancement ring reaches maximal contrast for ns. For the case MHz (bottom row of Fig. 3(a)), the pair correlation is maximally enhanced at a radius near 10 m when or , while it becomes washed out when approaches . A pair-correlation signal at very short distances (about 3 m) is an artifact caused by ion feedback from the TIP; field electrons impacting on the TIP release a secondary ion that impacts the MCP close to the primary (Rb+) ion (Thaicharoen et al., 2016). In our quantitative analysis below, we employ the angular integrals of the pair correlation images. We show the curves in Fig. 3(b) for the case , and in Fig. 3(c) for the case MHz.
In the explanation of the pair correlation data and the strength of the correlation enhancement, we concentrate on the case and refer to Fig. 1. The two-photon Rabi frequency ( MHz) is high enough that many excitation domains within the sample carry one Rydberg excitation (state ) after the first phase of the excitation pulse (i.e., at time ; isolated atom in Fig. 1(c)). However, due to the bandwidth of the excitation pulse, some excitation domains become populated with a Rydberg-excitation pair (state ) via a two-photon process. The doubly-excited domains have an energy level shift from the drive field due to the van der Waals interaction (atom pairs in Fig. 1(c)). The atom populations after flipping the phase and completing the excitation pulse are illustrated in Fig. 1(c), at time labels 3. For the case , domains in the state are de-excited back to the -state. However, the domains in excited state are off-resonant, leaving them with some probability in after completion of the echo sequence. In effect, after the sequence we expect to find a relative over-abundance of paired atoms, at a correlation distance slightly smaller than the blockade radius. The experimental data support this scenario. The opposite behavior is observed in the case MHz. In that case, domains in the state undergo an echo (for ) and are de-excited back to the -state. This leaves an abundance of isolated Rydberg atoms in the state after the echo sequence, with a reduced degree of correlation.
For a more quantitative analysis of the data, from the curves we obtain peak values and radii of maximal correlation enhancement, determined by the local parabolic fits to the maxima near m. We calculate , the strength of the correlation enhancement of a pair correlation function, as:
| (1) |
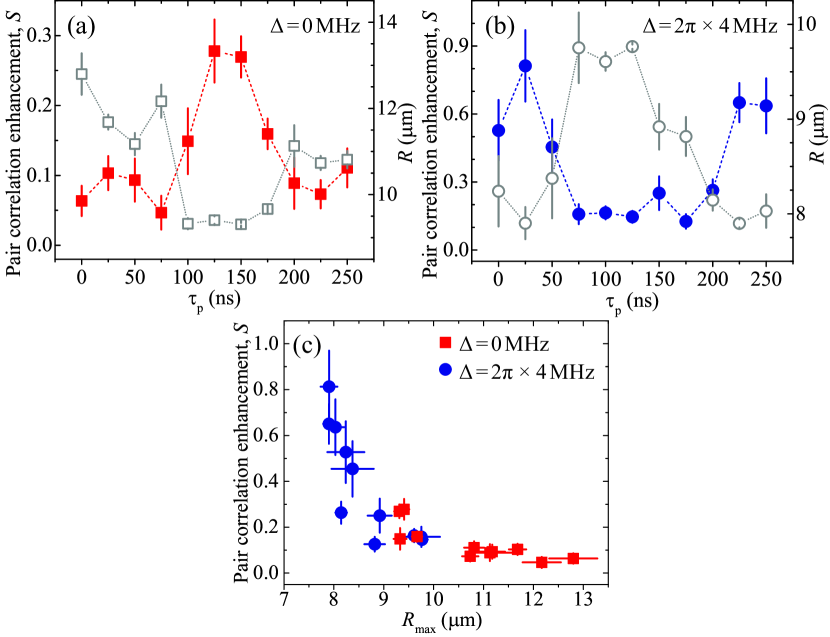
We determine the asymptotic values by taking the average of over the range 20 m m. Figure 4 shows the dependence of the pair enhancements and the radii on ; panels (a) and (b) show the cases MHz and MHz, respectively. As anticipated from Fig. 3, we see in Fig. 4(a) and Fig. 4(b) that the curves exhibit pronounced maxima at , in the case , and at and , in the case MHz. Thus, the curves for the cases and MHz exhibit opposite trends. Close inspection of the curves in Figs. 3(b-c) also shows that the FWHM of the enhancement peak decreases when the increases.
Figures 4(a) and Fig. 4(b) reveal an additional subtle trend. In both the MHz and the MHz cases, the values for are smaller for larger values of . The relationship between and is shown in Fig. 4(c). It is clearly seen that the pair correlation enhancement increases from near zero to as the radius of maximal correlation diminishes from m to m. The underlying reason for this behavior is that large correlation enhancement corresponds to strong van der Waals interaction, ; hence a large corresponds to a small , regardless of the exact excitation conditions. This physical connection is explicitly expressed in Fig. 4(c). It is noteworthy that the dependencies extracted from the and the MHz measurements agree very well in Fig. 4(c) within their overlap region m m.
We have established that the echo excitation sequence has a profound effect on spatial correlations in cold Rydberg-atom samples. We expect a complementary effect in the Rydberg excitation counting statistics, which should also carry signatures of the correlations in the system. A common measure to characterize counting-statistics is the Mandel -parameter (Liebisch et al., 2005; Ates et al., 2006; Schempp et al., 2014; Malossi et al., 2014), which is calculated from
| (2) |
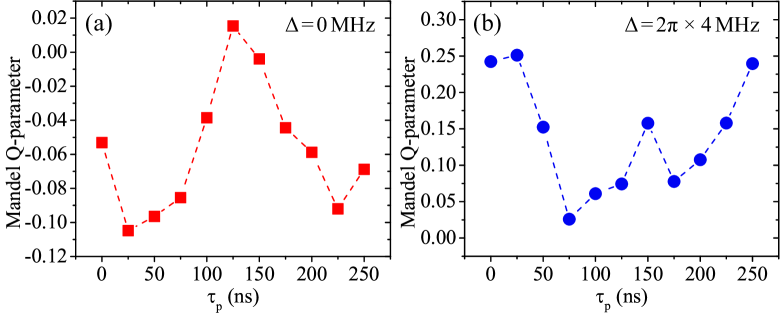
Figure 5 shows the -parameters as a function of . The plotted values do not take the detection efficiency into account; the actual -parameters in the sample are given by . The Q-parameters observed for MHz are mostly negative, ranging from -0.10 to 0.02, while the ones for MHz are positive, ranging from 0.03 to 0.25. This shows that for and and the atoms largely follow sub-Poissonian statistics (), while for MHz and and they follow super-Poissonian statistics ().
In the following we explain the trends observed in our Q-value measurements. The Q-parameters for systems containing mostly pair-excitations are expected to trend toward positive values (Wüster et al., 2010; Heeg et al., 2012), indicating super-Poissonian distributions. This effect is demonstrated in Fig. 5, in which the Q-parameters reach high values when pair excitations are dominant. This is the case for ns at MHz, and and 250 ns at MHz. These cases correspond to the images with bold borders in Fig. 3 (a).
For a qualitative explanation of why ensembles of correlated Rydberg-atom pairs lead to super-Poissonian statistics, we consider a Poissonian distribution of atom pairs (). Since every pair contains two atoms, we substitute into Eq. 2. The relation between and the Q-value for single-atom detections, , is seen to be
| (3) |
Hence, a Poissonian distribution of uncorrelated Rydberg-atom pairs () results in a super-Poissonian distribution of single-atom detections (). Considering that the detection efficiency is , we expect a measured , which is close to the value shown in Fig. 5(b) at and .
In summary we have measured the effect of the rotary echo on spatial pair correlation functions and counting statistics of Rydberg atoms for on- and off-resonant excitations. The measurements exhibit a fundamental connection between spatial correlations and counting statistics. The result also shows that it is possible to prepare correlated Rydberg atoms at a well-defined interatomic separation by using this method. This ability could be useful in atom kinetics experiments (Thaicharoen et al., 2015, 2016). We believe that the pair correlation enhancement afforded by the echo can be improved, in the future, by reducing the excitation bandwidth. Further, it would be interesting to explore the effect of the echo sequence in the case of anisotropic interaction potentials.
This work was supported by the NSF (PHY-1205559 and PHY-1506093) and the AFOSR (FA9550-10-1-0453). N.T. acknowledges support from DPST of Thailand. We thank S. Wüster for helpful discussions.
*nithi@umich.edu
†Present address: zeroK NanoTech Corporation, Gaithersburg, MD 20879, USA
References
- Lukin et al. (2001) M. D. Lukin, M. Fleischhauer, R. Cote, L. M. Duan, D. Jaksch, J. I. Cirac, and P. Zoller, Phys. Rev. Lett. 87, 037901 (2001).
- Urban et al. (2009) E. Urban, T. A. Johnson, T. Henage, L. Isenhower, D. D. Yavuz, T. G. Walker, and M. Saffman, Nat Phys 5, 110 (2009).
- Weber et al. (2015) T. M. Weber, M. Höning, T. Niederprüm, T. Manthey, O. Thomas, V. Guarrera, M. Fleischhauer, G. Barontini, and H. Ott, Nat Phys 11, 157 (2015).
- Dudin and Kuzmich (2012) Y. O. Dudin and A. Kuzmich, Science 336, 887 (2012).
- Liebisch et al. (2005) T. C. Liebisch, A. Reinhard, P. R. Berman, and G. Raithel, Phys. Rev. Lett. 95, 253002 (2005).
- Malossi et al. (2014) N. Malossi, M. Valado, S. Scotto, P. Huillery, P. Pillet, D. Ciampini, E. Arimondo, and O. Morsch, Phys. Rev. Lett. 113, 023006 (2014).
- Schempp et al. (2014) H. Schempp, G. Günter, M. Robert-de Saint-Vincent, C. S. Hofmann, D. Breyel, A. Komnik, D. W. Schönleber, M. Gärttner, J. Evers, S. Whitlock, and M. Weidemüller, Phys. Rev. Lett. 112, 013002 (2014).
- Amthor et al. (2010) T. Amthor, C. Giese, C. S. Hofmann, and M. Weidemüller, Phys. Rev. Lett. 104, 013001 (2010).
- Gärttner et al. (2013) M. Gärttner, K. P. Heeg, T. Gasenzer, and J. Evers, Phys. Rev. A 88, 043410 (2013).
- Lesanovsky and Garrahan (2014) I. Lesanovsky and J. P. Garrahan, Phys. Rev. A 90, 011603 (2014).
- Urvoy et al. (2015) A. Urvoy, F. Ripka, I. Lesanovsky, D. Booth, J. Shaffer, T. Pfau, and R. Löw, Phys. Rev. Lett. 114, 203002 (2015).
- Pohl et al. (2010) T. Pohl, E. Demler, and M. D. Lukin, Phys. Rev. Lett. 104, 043002 (2010).
- Schauß et al. (2012) P. Schauß, M. Cheneau, M. Endres, T. Fukuhara, S. Hild, A. Omran, T. Pohl, C. Gross, S. Kuhr, and I. Bloch, Nature 491, 87 (2012).
- Schauß et al. (2015) P. Schauß, J. Zeiher, T. Fukuhara, S. Hild, M. Cheneau, T. Macrì, T. Pohl, I. Bloch, and C. Gross, Science 347, 1455 (2015).
- Schwarzkopf et al. (2013) A. Schwarzkopf, D. A. Anderson, N. Thaicharoen, and G. Raithel, Phys. Rev. A 88, 061406 (2013).
- Thaicharoen et al. (2015) N. Thaicharoen, A. Schwarzkopf, and G. Raithel, Phys. Rev. A 92, 040701 (2015).
- Wüster et al. (2010) S. Wüster, J. Stanojevic, C. Ates, T. Pohl, P. Deuar, J. F. Corney, and J. M. Rost, Phys. Rev. A 81, 023406 (2010).
- Hernández and Robicheaux (2008) J. V. Hernández and F. Robicheaux, J. Phys. B: At. Mol. Opt. Phys. 41, 195301 (2008).
- Raitzsch et al. (2008) U. Raitzsch, V. Bendkowsky, R. Heidemann, B. Butscher, R. Löw, and T. Pfau, Phys. Rev. Lett. 100, 013002 (2008).
- Younge and Raithel (2009) K. C. Younge and G. Raithel, New J. Phys. 11, 043006 (2009).
- Dunning et al. (2014) A. Dunning, R. Gregory, J. Bateman, N. Cooper, M. Himsworth, J. A. Jones, and T. Freegarde, Phys. Rev. A 90, 033608 (2014).
- Wang et al. (2015) L. Wang, H. Zhang, L. Zhang, G. Raithel, J. Zhao, and S. Jia, Phys. Rev. A 92, 033619 (2015).
- Schwarzkopf et al. (2011) A. Schwarzkopf, R. E. Sapiro, and G. Raithel, Phys. Rev. Lett. 107, 103001 (2011).
- Thaicharoen et al. (2016) N. Thaicharoen, L. Gonçalves, and G. Raithel, Phys. Rev. Lett. 116, 213002 (2016).
- Ates et al. (2006) C. Ates, T. Pohl, T. Pattard, and J. M. Rost, J. Phys. B: At. Mol. Opt. Phys. 39, L233 (2006).
- Heeg et al. (2012) K. P. Heeg, M. Gärttner, and J. Evers, Phys. Rev. A 86, 063421 (2012).