Gapped Excitations in the High-Pressure Antiferromagnetic Phase of URu2Si2
Abstract
We report a neutron scattering study of the magnetic excitation spectrum in each of the three temperature and pressure driven phases of URu2Si2. We find qualitatively similar excitations throughout the (H0L) scattering plane in the hidden order and large moment phases, with no changes in the -widths of the excitations at the = (1.407,0,0) and = (1,0,0) points, within our experimental resolution. There is, however, an increase in the gap at the point from 4.2(2) meV to 5.5(3) meV, consistent with other indicators of enhanced antiferromagnetism under pressure.
pacs:
78.70.Nx, 71.27.+aThe heavy fermion material URu2Si2 exhibits a specific heat anomaly at T0 = 17.5 K indicative of a second order phase transition Palstra_85 ; Broholm_87 . Decades of research not withstanding Bonn_88 ; Buyers_94 ; Mason_95 ; Bourdarot_05 , an order parameter characterizing the putative symmetry breaking of the low temperature phase has not been identified. Neutron scattering does show antiferromagnetic order with an ordering wavevector = (1,0,0), but the small sample-averaged moment of 0.03 Broholm_87 , seems hard to reconcile with a change in entropy = 0.24 Palstra_85 through the transition. This moment may even be intrinsic Bourdarot_14 or it may arise from heterogeneous inclusions of a large moment phase Takagi_07 . Spin fluctuations with a characteristic wave vector (1 , 0, 0) ( = 0.407(6)) are observed in the paramagnetic (PM) phase, indicative of Fermi-surface nesting at the point, which for URu2Si2 occurs for (a=4.128 Å and c=9.534 Å at T=4 K) Wiebe_07 . Below , in the so-called ‘hidden order’ (HO) phase, these excitations become gapped as for a spin density wave transition and consistent with the specific heat anomaly, but without development of the attendant staggered magnetization.
Hydrostatic pressure of 0.6 GPa replaces the HO phase with a large-moment antiferromagnetic (AF) phase with an ordered magnetic moment of 0.3 Aoki_09 ; Butch_10 . Here we show the gapped excitations at the = (1.407,0,0) and = (1,0,0) points persist in the AF phase, albeit with an enhanced gap at the point in the high pressure phase. Our results are not inconsistent with previous experimental data Aoki_09 ; Hassinger_10a ; Bourdarot_10 , though they clearly show an inelastic signal at the point. Our expanded coverage of - space reveals a similarity between magnetic excitations in the two low temperature phases that was not previously appreciated.
High quality single crystals of URu2Si2 were grown by the Czochralski method in a tri-arc furnace. Three crystals with a total mass of approximately 37 g and an RRR 10 were coaligned in the (0) plane for the ambient pressure measurements. A single crystal with a mass of 1.66 g and an RRR = 15 was cut by spark erosion, aligned in the (0) plane, placed inside a 13-8Mo steel He-gas pressure vessel, and connected to a commercially available pressurizing intensifier through a heated high-pressure capillary. Following the procedure established in Ref. Butch_10 , the pressure was adjusted only at temperatures well above the helium melting curve and the capillary was heated during slow cooling of the cell to accommodate the contracting He gas, thus minimizing pressure loss and pressure inhomogeneities across the sample space. The pressure cell was cooled at constant pressure to the freezing point of helium. Through prior calibration measurements of the lattice parameters of highly oriented pyrolytic graphite crystals within the cell, the pressure reduction upon cooling following these procedures is less than 0.05 GPa. The neutron scattering measurements were performed on the Multi-Axis Crystal Spectrometer (MACS) at the NIST Center for Neutron Research, where a 20 MW reactor, a dedicated liquid H2 moderator, and a doubly-focusing PG(002) monochromator provides an incident beam flux of 3.0 108 n/cm2/s Rodriguez_08 for an initial energy = 5 meV. In the vicinity of (1,0,0), the in-plane resolution was 0.12 along , 0.043 along , and the out-of-plane resolution was 0.24 at zero energy transfer. All measurements were performed using a fixed = 5.054 meV, with an elastic energy resolution of 0.45 meV. Twenty detection channels permitted efficient mapping of inelastic scattering throughout the (0) plane. Measurements were performed at ambient pressure and = 25 K in the paramagnetic phase, at ambient pressure and = 2 K in the hidden order phase, and at a pressure of = 1.02 GPa and = 4 K in the AF phase.
Phonon scattering near (0,0,2) is visible in both the paramagnetic (Fig. 1(a)) and hidden order (Fig. 1(b)) phases. This allowed for normalization of the data so that we can provide absolute values of the scattering cross sections in each phase, which are consistent with previously published values Butch_15 . To isolate scattering from URu2Si2 from that associated with the massive pressure cell and the helium pressure medium, a background was measured for the pressure cell with the sample exchanged by an equal volume of aluminum pressurized to 1.02 GPa. Due to the reduced neutron absorption of Al relative to URu2Si2, this results in a slight over-subtraction and thus a difference signal with a small negative background value, as shown below. The scattering intensity under pressure was also subject to normalization using the (0,0,2) structural Bragg peak, which showed the transmission of the pressure cell is 18%, consistent with direct measurements. Attributing all of the scattering at (1,0,0) to magnetic scattering, the normalization yields a cross section for the (1,0,0) magnetic Bragg peak of 0.36(9) , which is in good agreement with the previously reported ordered moment in the AF phase Aoki_09 . All data were corrected for the effects of higher order contamination on the monitor count rate Rodriguez_08 .
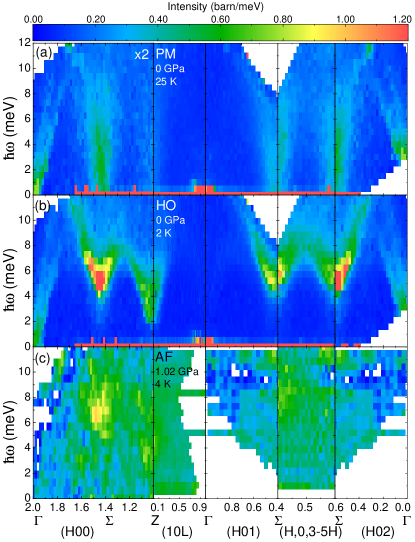
The inelastic scattering cross section along high symmetry directions in the (0) plane for the three different phases is shown in Fig. 1. The upper and middle panels show the momentum and energy transfer dependence of the magnetic scattering in the PM and HO phases, respectively, which are consistent with earlier findings Broholm_87 ; Wiebe_07 ; Wiebe_04 . There are substantial changes across the PM to HO phase transition. In the PM phase, the scattering takes the form of gapless ridges with most of the intensity at the point though a ridge is also clearly discerned at the point. In the HO phase, well-defined gaps have opened at both the and points, and the intensity at the point has increased. The lowest panel shows data in the AF phase. Due to the pressure cell the quality of these data is significantly reduced. Nonetheless, to within error in the AF phase, the overall Q- dependent scattering is qualitatively similar to that of the HO phase, though as seen in constant-Q cuts of the data, the gap at the point is considerably enhanced.
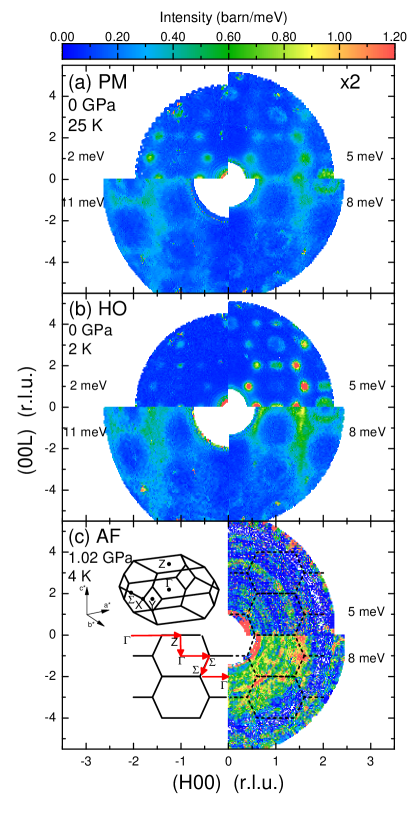
Further comparisons between the three phases is made by examining the constant energy transfer slices through the (0) zone data, shown in Fig. 2. The figure shows the average intensity in 1 meV-thick slices centered at 2 meV, 5 meV, 8 meV and 11 meV. For improved statistics, we have symmetrized the data and present a single quadrant at each energy transfer. While intensity at the point is present in all three phases, intensity at the point is mainly visible in the HO and AF phases. In the HO phase, there is considerably more spectral weight in all of the excitations compared to the PM phase. Comparing the HO and AF phase, we see in the 5 meV slice that the gap in the AF phase is larger at the points. The and modes have similar intensity at 8 meV within the AF phase compared to 5 meV in the HO phase. In the HO phase, the 8 meV data consists of smooth ridges, while well-defined reciprocal space intensity maxima are still visible at 8 meV in the AF data.
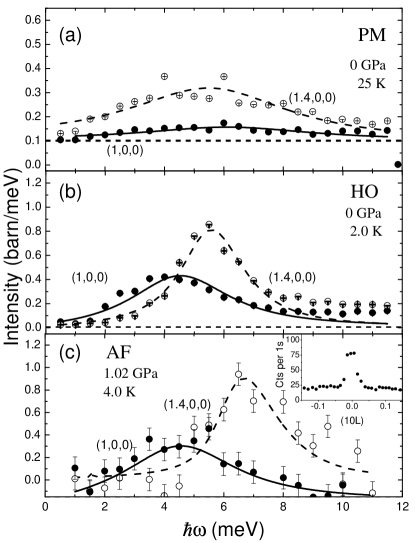
For a quantitative spectral analysis, the energy dependence of the scattering at and in the three phases is shown in Fig. 3. These cuts were extracted from the same data that is shown in Fig. 1 and Fig. 2. Following the analysis of Broholm_91 , the data in each phase was fit to the resolution-convoluted line shape associated with the following expression for the low temperature magnetic scattering cross section near the and points:
| (1) | |||||
where is the spectral Half Width at Half Maximum (HWHM) and approximates the first moment in the limit where . With an energy gap , the phenomenological dispersion relation reads:
| (2) |
Here is the projection of the deviation in wave vector transfer from the critical wave vector perpendicular and parallel, respectively, to the -direction. We take the velocity to be isotropic within the tetragonal basal plane because the present data from the (0) zone only is insensitive to potential in-plane anisotropy allowed by symmetry in the low phases. The velocities used were determined from the HO phase, using the data in Fig. 1(b), and were found to be = = = 23.7(5) meVÅ and = = 32.5(7) meVÅ. Eq. 1 was convoluted with the 4D instrumental resolution function using Reslib Zheludev_07 . In order to extract reliable measurements of the energy gaps at both -points, this fitting was performed for a variety of integration ranges in both and . The values of the gap, , and width, , versus the integration area (in Å-2) were then extrapolated to the size of the resolution ellipse given by Reslib. This allowed these parameters to be determined in a way that is only dependent on the instrumental resolution and not the integration range chosen to form the energy scan from the Q-dependent data. The results are summarized in Table 1. The error bars given for the values of and are a combination of the errors resulting from the Reslib fits as well as the extrapolation described above.
| Phase | Wavevector | |||
| (barn meV) | (meV) | (meV) | ||
| PM | 2.3(5) | 2.4(4) | ||
| PM | 2.2(6) | 1.8(2) | ||
| HO | 2.3(4) | 0.9(1) | ||
| HO | 4.2(2) | 0.7(1) | ||
| AF | 2.3(4) | 0.9(2) | ||
| AF | 5.5(3) | 0.7(1) |
In the HO phase, the excitation at the point becomes gapped, with meV. Upon entering the AF phase this gap increases to meV, while the physical half width extracted from this analysis, meV, is identical in the two phases. At the point the gap and width of the spectrum are also identical in the two phases. Note that the values for the gap and half width meV and meV are both larger than literature values Bourdarot_14 and this may be a result of the coarser -resolution of the present measurement. The main difference in the scattering in the AF phase as compared to the HO phase is the increased gap at the and the additional Bragg scattering at (1,0,0). The first moment at the and points are within error bars of the values in the HO phase, as may also be appreciated by comparing Fig. 3(b) and Fig. 3(c). The inset to Fig. 3(c) shows a transverse cut through the (1,0,0) elastic peak, the intensity of which corresponds to a moment size of 0.36(9) . This is evidence that the measurements were indeed conducted in the AF phase. Our observation of inelastic scattering at is not a surprise given the enhanced AF order. In previous, lower pressure work an inelastic peak was observed at for GPa Aoki_09 but not for GPa Bourdarot_10 . A possible explanation for all three neutron experiments under pressure is that the mode softens at the critical pressure and so falls within the elastic line in the lower pressure measurements. This would be consistent with recent high pressure Raman data Blumberg_Private .
We also note that the -widths of the inelastic magnetic scattering in the AF and HO phases are similar and both broader than in the PM phase. The limited statistical quality of the AF phase data however, leaves it open for now whether or not there are coherent modes in the AF phase as in the HO phase. Between the paramagnetic and hidden order phases, transport and thermodynamic measurements indicate significant Fermi surface reconstruction Palstra_85 ; Maple_86 . Resistivity McElfresh_87 , and quantum oscillation measurements Hassinger_10b , on the other hand, are much less affected by the HO to AF transition. Together with the similarities between the HO and AF spin correlations reported here, this suggests differences between these two phases of URu2Si2 are very subtle.
Apart from inducing or at least enhancing AF order, applied pressure shifts -point intensity to slightly higher energies. This indicates a stabilization of AF order under hydrostatic pressure. Previous work interprets gapped excitations at the point as a signature of the HO phase Villaume_08 . However, the present data shows that entering the AF phase does not weaken or destroy either set of excitations. Likewise, pressure does not suppress the HO transition, but actually increases , before the AF phase emerges Motoyama_03 . All these observations point to a significant kinship between the HO and AF phases of URu2Si2.
Acknowledgements.
The authors would like to thank M.B. Stone for help with the data analysis. Work at IQM was supported by DoE, Office of Basic Energy Sciences, Division of Materials Sciences and Engineering under award DE-FG02-08ER46544. This work utilized facilities supported in part by the National Science Foundation under Agreement No. DMR-1508249. Research at McMaster University is supported by NSERC. T.J.W. acknowledges support from the Wigner Fellowship program at Oak Ridge National Laboratory.References
- (1) T.T.M. Palstra, A.A. Menovsky, J. van den Berg, A.J. Dirkmaat, P.H. Kes, G.J. Nieuwenhuys and J.A. Mydosh. Phys. Rev. Lett. 55, 2727 (1985).
- (2) C. Broholm, J.K. Kjems, W.J.L. Buyers, P. Matthews, T.T.M. Palstra, A.A. Menovsky and J.A. Mydosh. Phys. Rev. Lett. 58, 1467 (1987).
- (3) D.A. Bonn, J.D. Garrett and T. Timusk. Phys. Rev. Lett. 61, 1305 (1988).
- (4) W.J.L. Buyers, Z. Tun, T. Peterson, T.E. Mason, J.-G. Lussier, B.D. Gaulin and A.A. Menovsky. Physica B 199&200, 95 (1994).
- (5) T.E. Mason, W.J.L. Buyers, T. Peterson, A.A. Menovsky and J.D. Garrett. J. Phys.: Condens. Matter 7, 5089 (1995).
- (6) F. Bourdarot, A. Bombardi, P. Burlet, M. Enderle, J. Flouquet, P. Lejay, N.Kernavanois, V.P. Mineev, L.Paolasini, M.E. Zhitomirsky and B. Fk. Physica B 359-361, 986 (2005).
- (7) F. Bourdarot, S. Raymond and L.-P. Regnault. Phil. Mag. 94, 3702 (2014).
- (8) S. Takagi, S. Ishihara, S. Saitoh, H.-i. Sasaki, H. Tanida, M. Yokoyama and H. Amitsuka. J. Phys. Soc. Japan. 76, 033708 (2007).
- (9) C.R. Wiebe, J.A. Janik, G.J. MacDougall, G.M. Luke, J.D. Garrett, H.D. Zhou, Y.-J. Jo, L. Balicas, Y. Qiu, J.R.D. Copley, Z. Yamani and W.J.L. Buyers. Nature Physics 3, 96 (2007).
- (10) D. Aoki, F. Bourdarot, E. Hassinger, G. Knebel, A. Miyake, S. Raymond, V. Taufour and J. Flouquet. J. Phys. Soc. Jap. 78, 053701 (2009).
- (11) N.P. Butch, J.R. Jeffries, S. Chi, J.B. Leão, J.W. Lynn and M.B. Maple. Phys. Rev. B. 82, 060408(R) (2010).
- (12) E. Hassinger, D. Aoki, F. Bourdarot, G. Knebel, V. Taufour, S. Raymond, A. Villaume and J. Flouquet. J. Phys.: Conf. Ser. 251, 012001 (2010).
- (13) F. Bourdarot, E. Hassinger, S. Raymond, D. Aoki, V. Taufour, L.-P. Regnault and J. Flouquet. J. Phys. Soc. Jap 78, 064719 (2010).
- (14) J.A. Rodriguez, D.M. Adler, P.C. Brand, C. Broholm, J.C. Cook, C. Brocker, R. Hammond, Z. Huang, P. Hundertmark, J.W. Lynn, N.C. Maliszewkyj, J. Moyer, J. Orndorff, D. Pierce, T.D. Pike, G. Scharfstein, S.A. Smee and R. Vilaseca. Meas. Sci. Technol. 19, 034023 (2008).
- (15) N.P. Butch, M.E. Manley, J.R. Jeffries, M. Janoschek, K. Huang, M.B. Maple, A.H. Said, B.M. Leu and J.W. Lynn. Phys. Rev. B. 91, 035128 (2015).
- (16) C.R. Wiebe, G.M. Luke, Z. Yamani, A.A. Menovsky and W.J.L. Buyers. Phys. Rev. B 69, 132418 (2004).
- (17) C. Broholm, H. Lin, P.T. Matthews, T.E. Mason, W.J.L. Buyers, M.F. Collins, A.A. Menovsky, J.A. Mydosh and J.K. Kjems. Phys. Rev. B 43, 12809 (1991).
- (18) A. Zheludev: ResLib 3.4 (Oak Ridge National Laboratory, (2007).
- (19) G. Blumberg. Private communication.
- (20) M.B. Maple, J.W. Chen, Y. Dalichaouch, T. Kohara, C. Rossel, M.S. Torikachvili, M.W. McElfresh and J.D. Thompson. Phys. Rev. Lett. 56, 185 (1986).
- (21) M.W. McElfresh, J.D. Thompson, J.O. Willis, M.B. Maple, T. Kohara and M.S. Torikachvili. Phys. Rev. B 35, 43 (1987).
- (22) E. Hassinger, G. Knebel, T.D. Matsuda, D. Aoki, V. Taufour and J. Flouquet. Phys. Rev. Lett. 105, 216409 (2010).
- (23) A. Villaume, F. Bourdarot, E. Hassinger, S. Raymond, V. Taufour, D. Aoki and J. Flouquet. Phys. Rev. B 78, 012504 (2008).
- (24) G. Motoyama, T. Nishioka and N.K. Sato. Phys. Rev. Lett. 90, 166402 (2003).