Hi absorption towards low luminosity radio-loud AGNs of different accretion modes and WISE colours
Abstract
Hi absorption studies of active galaxies enable us to probe their circumnuclear regions and the general interstellar medium, and study the supply of gas which may trigger the nuclear activity. In this paper, we investigate the detection rate of Hi absorption on the nature of radio galaxies based on their emission-line spectra, nature of the host galaxies based on the WISE colours and their radio structure, which may help understand the different accretion modes. We find significant difference in distributions of W2W3 colour for sources with Hi absorption detections and non-detections. We report a high detection rate of Hi absorption in the galaxies with WISE infrared colours W2W3 2, which is typical of gas-rich systems, along with a compact radio structure. The Hi detection rate for low-excitation radio galaxies (LERGs) with W2W3 2 and compact radio structure is high (70.620.4 %). In HERGs, compact radio structure in the nuclear or circumnuclear region could give rise to absorption by gas in the dusty torus in addition to gas in the interstellar medium. However, higher specific star formation rate (sSFR) for the LERGs with W2W3 2 suggests that Hi absorption may be largely due to star-forming gas in their hosts. LERGs with extended radio structure tend to have significantly lower values of W2W3 compared to those with compact structure. Extended radio sources and those with W2W3 2 have low Hi detection rates.
keywords:
galaxies: active – galaxies: general – galaxies: nuclei – infrared: galaxies – radio lines: galaxies – radio continuum: galaxies1 Introduction
Optical spectroscopic studies of radio galaxies (Hine & Longair, 1979; Laing et al., 1994; Buttiglione et al., 2010; Best & Heckman, 2012) led to the division of radio-loud AGNs (Active Galactic Nuclei) into two categories, HERGs (High Excitation Radio Galaxies) and LERGs (Low Excitation Radio Galaxies). This dichotomy is believed to be due to differences in the accretion modes of HERGs and LERGs (Buttiglione et al., 2010; Best & Heckman, 2012; Son et al., 2012). In the high-excitation or quasar mode or radiatively efficient mode of accretion, Eddington ratio is greater than 1%, while it is less than 1% in the low-excitation mode or radio mode or radiatively inefficient mode of accretion (Heckman & Best, 2014). In HERGs, accretion in the nuclear regions takes place through geometrically thin, optically thick accretion disks (Shakura & Sunyaev, 1973; Novikov & Thorne, 1973) while for LERGs, this thin disk is absent and hence the radiatively inefficient accretion mode is believed to operate (Narayan & Yi, 1994, 1995; Yuan & Narayan, 2014). HERGs or sources with higher accretion rate are galaxies with younger stellar populations, growing central black hole masses and higher rate of central star formation (Kauffmann et al., 2008; Best & Heckman, 2012). Contrary to this, LERGs or sources with lower excitation and lower accretion rate are galaxies of higher stellar masses, higher black hole masses and with redder optical colours, consisting older stellar population than HERGs (Kauffmann et al., 2008; Best & Heckman, 2012). While LERGs contain both FR I and FR II type sources (Fanaroff & Riley, 1974), HERGs are predominantly FR II (Best & Heckman, 2012; Heckman & Best, 2014). Differences are also seen in their luminosities. A majority of LERGs have a radio luminosity less than 1026 W Hz-1 at 1.4 GHz, while HERGs dominate above this luminosity (Best & Heckman, 2012).
It has been suggested that different kinds of fuelling processes may be dominant in different kinds of AGN (Martini, 2004). While interactions and major mergers are thought to be behind the fuelling of HERGs (Tadhunter et al., 2014; Chiaberge et al., 2015), for low luminosity radio-loud AGNs, which would include most of the LERGs, accretion of hot halo ISM or IGM gas or minor mergers have been suggested as possible fuelling mechanisms by a number of authors (Allen et al., 2006; Hardcastle et al., 2007; Best, 2007; Balmaverde et al., 2008; Ellison et al., 2015). However, although many theoretical models are based on the framework where HERGs are fuelled by major mergers, the observational evidence is mixed, and different processes may be operating (Heckman & Best, 2014). In the case of LERGs, major mergers are unlikely to be the triggering and fuelling mechanism (Ellison et al., 2015). Recent studies (Young et al., 2014) of early-type galaxies find presence of cold atomic/molecular gas in 40 % of galaxies in the nearby Universe, and there is also evidence that early-type galaxies with dust lanes have higher chances to host emission-line AGNs (Shabala et al., 2012). Davis et al. (2015) argue that early-type galaxies with dust lanes have acquired their dust and gas from recent external minor mergers. For sources in clusters of galaxies, accretion of hot halo gas which has cooled also provides a viable mechanism (Heckman & Best, 2014). In their infra-red study of a sample of southern 2 Jy radio galaxies, Tadhunter et al. (2014) found host galaxies to have enough cold ISM fuel needed for the central AGN, but they argue that only having enough fuel is not sufficient for triggering the AGN activity, and it also depends on the kinematics and distribution of cold gas.
Hi absorption studies towards radio-loud AGNs have been a prominent tool to study cold neutral hydrogen gas in the central regions of the host galaxies of these sources (van Gorkom et al., 1989; Morganti et al., 2001; Pihlström et al., 2003; Vermeulen et al., 2003; Gupta et al., 2006; Emonts et al., 2010; Chandola et al., 2011; Allison et al., 2012; Chandola et al., 2013; Geréb et al., 2015). Studying the Hi properties of these sources with different radio luminosities, optical and infrared properties may provide clues towards further understanding and distinguishing between the accretion modes. However, most of the Hi absorption studies have been predominantly towards higher radio luminosity sources (L1.4GHz 1026 WHz-1), due to senstivity limitations of the instruments while observing flux density limited samples, except in a few cases e.g. (Emonts et al., 2010; Chandola et al., 2011; Geréb et al., 2014, 2015), where luminosities have been lower than 1026 WHz-1. In our studies (Chandola et al., 2011), we observed the Compact Radio sources at Low Redshift (CORALZ) core sample of 18 sources, which was compiled by Snellen et al. (2004), with the sources having flux densities larger than 100 mJy at 1400 MHz and angular sizes less than 2 arcsec. With a small sample and large statistical uncertainties, Hi properties were found to be similar to those in higher luminosity sources. A recent study by Geréb et al. (2014, 2015) of a much larger sample of 101 sources has Hi absorption detected towards 32 sources.
In this paper, we explore possible dependences of Hi absorption properties of the sources on HERGs/LERGs and hence on the accretion mode, source size, and nature of the host galaxy as reflected by the infrared colours. We consider the sample observed uniformly by Geréb et al. (2015) and the classification into high-excitation and low-excitation radio galaxies done by Best & Heckman (2012) for a large sample of sources using the SDSS optical spectroscopic data (DR7; Abazajian et al. 2009) and the Faint Images of the Radio Sky at Twenty Centimeters survey (FIRST; Becker et al. 1995) and NRAO VLA Sky Survey (NVSS; Condon et al. 1998) radio data. We also used the Wide-field Infrared Survey Explorer (WISE; Wright et al. 2010) infra-red (IR) archival data to look for relation between IR and Hi gas properties of LERGs and HERGs. WISE data provide mid-infrared photometry at different wavelengths (W1: 3.4 m, W2: 4.6 m, W3: 12 m, W4: 22 m). WISE colour plots are useful to distinguish between optical AGN activity (W1W2; Shao et al. 2013) and emission from warm dust heated due to AGN or star formation (W2W3). W2W3 colour can be also used as an indicator of star formation history in a galaxy (Donoso et al., 2012), and hence helpful in distinguishing IR ‘early’ type and IR ‘late’ type galaxies (Wright et al., 2010). We explore how the Hi absorption gas properties change with W2W3 colour for LERGs and HERGs.
2 Sample selection
Using the Westerbork Synthesis Radio Telescope (WSRT), Geréb et al. (2014, 2015) studied Hi in absorption towards a sample of 101 radio sources, selected by cross matching SDSS (York et al., 2000), and FIRST-NVSS data, and considering sources in the red-shift range 0.02 z 0.23 and FIRST flux density greater than 50 mJy. The radio luminosity of these sources at 1.4 GHz are in the range 1023-26 WHz-1, due to the lower red-shift and lower flux density level. Geréb et al. (2014) observed each source for 4 hours and have reported that the sources with Hi detections and non-detections have statistically similar flux density distributions. Therefore their optical depth sensitivities are also similar, and hence non-detections are unlikely to be due to a poor signal to noise ratio, but due to a lower optical depth compared with the detections.
The optical spectroscopic classification of almost all these sources were done using the work of Best & Heckman (2012) who constructed a sample of 18286 radio sources (15300 are radio-loud AGNs) by cross-matching SDSS optical spectroscopic data (DR 7) and FIRST-NVSS radio data. They used the “excitation index", EI , defined by Buttiglione et al. (2010) to classify sources as LERGs (EI 0.95-1) and HERGs (EI 0.95+1) where all 6 emission lines were detected. For other cases, they used multiple approaches such as using Kewley et al. (2006), Cid Fernandes et al. (2010) diagnostics, and equivalent width of O[iii] emission lines (those with absolute values greater than 5Å were classified as HERGs). We cross matched Geréb et al. (2015) sample with Best & Heckman (2012) sample and find 100 sources to be common. We used topcat software package (Taylor, 2005) for this purpose. Of these, 11 are classified as HERGs, 81 as LERGs and 8 are unclassified. Again, of the 100 sources, we find that of the 31 sources detected in Hi, 5 are HERGs, 21 LERGs, 5 unclassified, while of the 69 sources without any Hi detection, 6 are HERGs, 60 LERGs and 3 unclassified.
Further cross-matching these 100 sources with the WISE catalogue 111http://vizier.cfa.harvard.edu/viz-bin/Cat?II/328(Cutri et al., 2013; Cutri et al., 2013) using search radius of 10′′, we have mid-IR data on all 100 sources. WISE observations have been more sensitive at 3.4 m and 4.6 m than at higher wavelengths of 12 m and 22 m (Yan et al., 2013). Hence, we have more reliable magnitudes for W1 and W2 than W3 and W4. In our sample for six sources (J075607+383401, J080042+321728, J083411+580321, J110305+191702, J122823+162613, J130621+434751), we have 2 upper limits on W3 magnitudes. However for completeness we have used these upper limits along with the measured values (3) of W3 magnitudes to estimate W2W3 colours. Our results remain unchanged even if these 6 are excluded.
Since nearly all sources have their optical colours gr 0.7 (Geréb et al., 2015), the host galaxies are optically of early type except a few unclassified sources and one Hi non-detection, J094542+575748, classified as LERG. Of the 8 unclassified sources, 5 sources are with Hi detection. Of these 5 sources, 4 have been marked as M sources (associated with mergers or have blue optical colours) by Geréb et al. (2015), which include two ongoing mergers (UGC05101 and IC883 or UGC 8387), one star forming galaxy (blue colour, gr 0.38 and from SDSS spectra) B2 1229+33 and one with Seyfert like morphology (IRAS 13384+4503). Fifth unclassified Hi detection, J160338+155402 is a compact radio source associated with red elliptical galaxy, identified as FSRQ (Flat Spectrum Radio Quasar) by Taylor et al. (2007). Of the three unclassified non-detections, two sources, J081827.29+281403 and J122121.9+301037, marked as compact radio sources by Geréb et al. (2015) have been identified as QSOs (Quasi Stellar Objects) from their SDSS spectra. Another unclassified non-detection, a compact radio source, J120303+603119, is associated with an E/S0 galaxy.
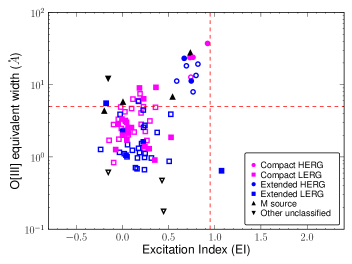
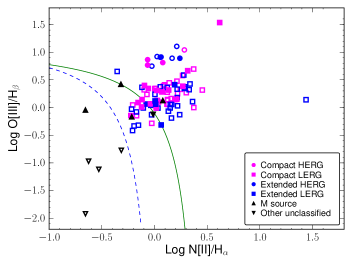
To be sure about LERG/HERG classification by Best & Heckman (2012), we checked online222http://wwwmpa.mpa-garching.mpg.de/SDSS/DR7/ optical emission line catalogue of SDSS spectral line data by the Max Planck Institute for Astrophysics, and the Johns Hopkins University (hereafter MPA-JHU; Brinchmann et al. 2004a). We have provided tables with these measurements for our sample in online version of the paper as supplementary material (see sample Tables 1, 2 and 3 in Appendix). Of the 100, 91 sources have all 6 emission lines detected, used for calculating excitation index. Of the remaining 9, 5 sources, J083139+223423, J091218+483045, J122122+301037, J130622+434751, J154912+304716, have O[i] equivalent width (EQW) 0 Å indicating absorption. Of these 5, J122122+301037 has been categorized as unclassified and remaining 4 classified as LERGs by Best & Heckman (2012). Two sources, J080042.0+321728 and J110305.8+191702, both LERGs, have S[ii] equivalent width 0 Å indicating absorption. J082028+485347, classified as LERG, has S[ii] and O[i] absorption lines. The ninth source, J151641.6+291810, classified as LERG, has reliable measurements available only for H, O[i] and O[iii] emission lines, where O[iii] equivalent width is 1.0490.175 Å and line flux is 26.046.53 10-17 erg s-1cm-2. It is an extended radio source (radio structural classification discussed in next section) and LERGs are known to have weak emission lines, sometimes difficult to detect, we continue with its classification as LERG. We further plotted O[iii] Equivalent width vs. Excitation Index for 91 sources with all six emission lines and Log O[iii]/H vs. Log N[ii]/H (Baldwin et al., 1981, BPT diagram) for 99 sources with atleast 4 emission lines, and checked the location of different sources in these diagrams (Fig. 1). We find in the equivalent width vs. excitation index plot, most of the HERGs lie close to the dividing line of EI 0.95 but with O[iii] equivalent width 5 Å, and clear division between two classes in BPT diagram. Except a few possible outliers classified as LERGs, e.g. J094542+575746, J142210+210554, J154912.3+304716, J155611.6+281133, the classification between LERGs and HERGs is consistent in both plots. The sources, J154912.3+304716 and J155611.6+281133, are extended radio sources. So we continue with them classified as LERGs. J142210+210554 is a compact radio source and have low flux measurements on all 6 lines, specially H measurements are low with high errors but O[III] equivalent width is 5 Å. So we continue with its classification as LERG. However, we exclude the source J094542+575748, classified as LERG, and put it in unclassified category along with the 8 sources already without any classification from Best & Heckman (2012), because it is located in star-forming region in BPT diagram and also have bluer colour. This gives us 26 sources detected in Hi, 5 HERGs and 21 LERGs, and 65 sources without any Hi detection, 6 HERGs and 59 LERGs, for our analysis. However, we will also show the positions of all 9 unclassified sources in the plots.
3 Results
The Geréb et al. (2015) sample is dominated by LERGs (80/91) as it is a low radio luminosity/redshift sample. Therefore we largely highlight the interesting results found for LERGs; the trends for HERGs have large statistical uncertainties due to their small numbers. For example, the detection rate of Hi absorption in the HERGs is 45.520.3% (5/11) compared to 26.35.7% (21/80) for the LERGs. Although there is a suggestion of a higher detection rate for HERGs, it has high statistical errors and it would be useful to investigate this further using a larger number of HERGs observed to a similar sensitivity limit.
Several earlier studies have indicated a higher detection rate for compact radio sources such as compact steep-spectrum and giga-Hertz peaked spectrum sources compared with the more extended ones (Pihlström et al., 2003; Gupta et al., 2006; Chandola et al., 2013). Although detailed structural information at sub-arcsec level are generally not available for these sources, we examined the detection rate using the structural classification of Geréb et al. (2015). They classified these sources as compact and extended using the NVSS major to minor axes ratio vs the FIRST peak to integrated flux density ratios, followed by visual inspections. For the sources classified as either HERGs or LERGs, we find 41.3 9.5% (19/46) Hi absorption detection rate for compact ones as compared to 15.65.9% (7/45) for extended sources. In LERGs, we find an Hi detection rate of 38.19.5% (16/42) for compact LERGs as compared to 13.25.9% (5/38) for extended LERGs.
WISE colours are being widely used for various galaxy studies such as population studies, separating normal galaxies from AGN, heating of dust and specific star formation rates (Yan et al., 2013). Sadler et al. (2014) noted that in their sample 92 % of the WISE ‘early-type’ galaxies with W2W3 2 are LERGs while the WISE ‘late type’ with W2W3 2 are a mixture of both LERGs and HERGs. Wright et al. (2010) have suggested the distribution of WISE colours for different kinds of astronomical objects in a W1W2 vs W2W3 diagram, and Nikutta et al. (2014) have modelled these in terms of dust with different temperatures and radial profiles. All colours in this paper are in Vega mag.
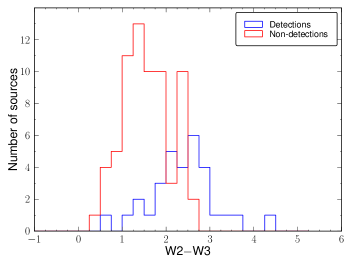
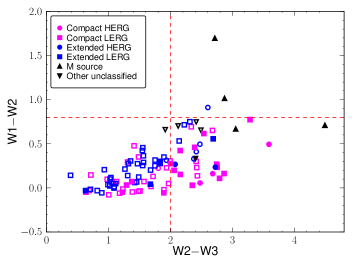
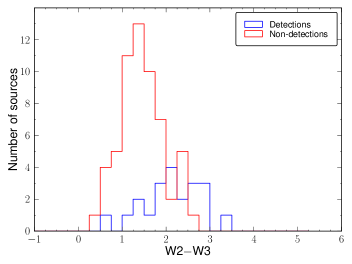
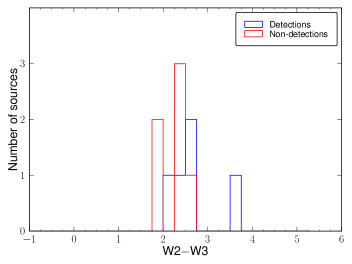
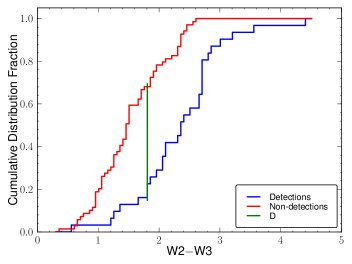
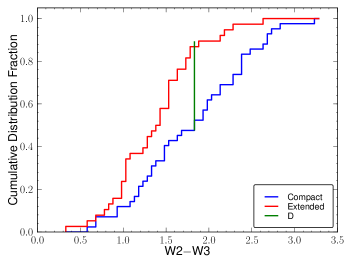
We checked the infrared data from WISE survey for our sample of sources. The distributions of W2W3 colours for sources with Hi absorption detection and non-detection, and locations of the different categories of objects in the W1W2 vs W2W3 plot (see Wright et al. 2010) are shown in Figs. 2 and 3. As we can see from these figures, there is a clear dichotomy in the distributions of W2W3 colour for sources with Hi detection and non-detection. A Kolomogorov-Smirnov(KS) test rejects the null hypothesis that two samples are similar in their W2W3 distribution with p-value 7.3510-6 and D (maximum difference) 0.52 at W2W3 1.8. A similar exercise for sources with Hi detections and non-detections for only LERGs gives p 0.00011 and D0.54 at W2W3 1.8, clearly indicating that these are distinct in their W2W3 properties.
Of the WISE ‘early-type’ galaxies with W2W3 2, almost all (96.712.6 %; 59/61) are LERGs, while amongst those with W2W3 2, 7015.3 % (21/30) are LERGs and 3010 % (9/30) are HERGs. Given the statistical uncertainties, these are consistent with the findings of Sadler et al. (2014). This dichotomy is also clearly seen when we consider the HERGs where 81.827.3 % (9/11) have W2W3 2 while most of the LERGs (73.89.6 %, 59/80) have W2W3 2. Therefore in this sample, the HERGs are almost entirely WISE ‘late-type’ (although all of them are optically early type galaxies) belonging to the region populated by LIRGs or luminous infrared galaxies (Wright et al., 2010), while a majority of the LERGs are early-type consisting of ellipticals.
Considering the WISE ‘late-type’ galaxies with W2W3 2, independent of radio structure, the Hi detection rates are similar for LERGs and HERGs, the numbers being 61.917.2 % (13/21) and 55.624.8% (5/9) respectively. For the WISE ‘early-type’ galaxies with W2W3 2, only 8 of the 59 LERGs (13.64.8 %) and none of the 2 HERGs have an Hi detection. The nature of the host galaxies as reflected in the WISE colours appear to play a significant role in the detection of Hi absorption for both LERGs and HERGs.
Now let us consider the radio structure of the sources along with the WISE colours. Of the 91 sources classified as either LERGs or HERGs, 45 are extended and 46 are compact. Of 45 extended sources, 35 have WISE colours W2W3 2 with an Hi detection rate of 11.45.7% (4/35), while the remaining 10 with W2W3 2 have a detection rate of 3017.3 % (3/10). Considering the 46 compact radio sources, the 26 with W2W3 2 have a detection rate of 15.47.7 % (4/26), compared with an Hi detection rate of 7519.4 % (15/20) for those with W2W3 2.
4 Discussion
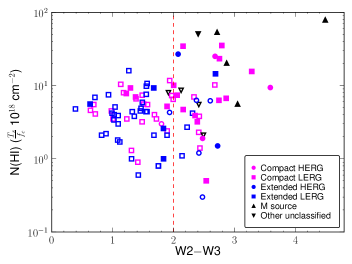
Our study shows a high detection rate of Hi absorption in the WISE ‘late-type’ galaxies with W2W3 2 and a compact radio structure. The high Hi detection rate for the radio sources with W2W3 2 indicates a close relationship between the presence of Hi gas and warm heated dust due to either star burst or AGN. Almost all the HERGs in our sample have W2W3 2 and this can be related to mid-IR excess due to star-burst and heating of dusty torus by central AGN (Pace & Salim, 2016). We also find that the Hi absorption detection rate for LERGs with W2W3 2 and compact radio structure is high (12/17; 70.620.4 %). Some of these LERGs have column densities comparable to HERGs and merger sources (Fig. 4). This implies there is also a sub population of LERGs which is gas and dust rich, although majority of these are gas poor, as reflected in the overall detection rate.
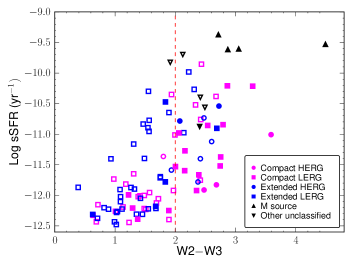
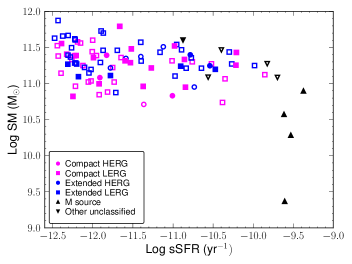
LERGs are believed to lack central dusty torus (Ogle et al., 2006; Heckman & Best, 2014) which indicates that in the case of gas-rich LERGs it is either individual clouds from mergers or interstellar medium playing the role of absorbers. To further investigate these aspects we examine their stellar mass (SM), star formation rate (SFR), specific star formation rate (sSFR), and see how these relate with WISE colours and detection rates of our sample for different categories of objects. For this we used online available information for our sample, from MPA-JHU database 333http://wwwmpa.mpa-garching.mpg.de/SDSS/DR7/Data/stellarmass.html,444http://wwwmpa.mpa-garching.mpg.de/SDSS/DR7/sfrs.html. Stellar masses for these sources in this database have been derived using fits to the photometry and estimates are similar to those of Kauffmann et al. (2003) who used spectral line indices and features like the 4000Å break. The star formation rate and specific star formation rate have been derived using the methods of Brinchmann et al. (2004b) with corrections for dust attenuation. Also, aperture corrections were done using methodology of Salim et al. (2007). Fig. 5 shows the variation of Log sSFR with WISE colour for different categories of objects. In our sample, WISE ‘late type’ LERGs as well as HERGs are of similar stellar masses and specific star formation rates which is evident from the Fig. 5. While we have higher specific star formation rate for the objects with W2W3 2 spanning a range of about 2 orders of magnitude with Log sSFR upto a few times 9 yr-1 (Fig. 5), a significant number of sources with WISE colour W2W3 2 have Log sSFR 12 yr-1. However there are also some objects with W2W3 2 but Log sSFR 12 yr-1. The median value of Log sSFR for all sources with WISE colours W2W3 2 is 12.02 yr-1 while for those with W2W3 2 the median value of Log sSFR = 10.85 yr-1. Considering only LERGs, the median values of Log sSFR for those with W2W3 2 and W2W3 2 are very similar to those for the entire sample. Higher specific star formation rate towards sources with WISE ‘late’ type colours suggests that gas and dust rich ISM could be one of the factors affecting the detection rate in the favour of compact LERGs/HERGs. This is consistent with findings of Morganti et al. (2001), who suggested that in some FR I type sources it is the star-forming gas in a rich ISM could play the role of absorbing gas. Another important factor affecting the detection rate is the fraction of the background source covered by the absorber given by the covering factor , which inversely depends on size of the radio source and affects our estimate of the integral optical depth (Curran et al., 2013). Moreover due to the compactness, compact radio sources trace sightlines towards central denser regions of radial density profiles of Hi disc (Pihlström et al., 2003). This could be the other reason for the low detection rate in extended radio sources. Available VLBI images for some of the compact LERG radio sources with Hi absorption detection suggest that these have sizes of parsec scale. However, we lack complete information on all sources. In HERGs, in addition to clouds in the interstellar medium, a dusty torus in an AGN could give rise to HI absorption if the compact radio source is of a similar or smaller scale than the torus.
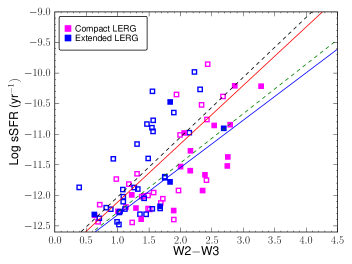
Since Hi absorption detections as well as star formation rates are higher for WISE ‘late-type’ galaxies, it is relevant to enquire about the possible origins of the gas or fuel. It could be the result of a normal process of galaxy evolution in which star-formation started in a dusty gas-rich environment and decreased at later stages due to scarcity of fuel, combined with possible feedback from a radio source. In addition, star-formation or AGN activity may get a boost from dust rich mergers or interactions. In the literature, suggested fuelling mechanisms vary from major mergers or secular processes for HERGs to accretion of halo gas, stellar remnants, winds from evolved stars or minor mergers for LERGs (Ellison et al., 2015). Also LERGs are reported with suppressed star-formation in the literature (Gürkan et al., 2015; Pace & Salim, 2016; Ellison et al., 2016). Although this may be true for a majority of the LERGs in our sample, it doesn’t explain the higher Hi gas detection rate and higher rate of star formation in WISE ‘late-type’ LERGs. There have been suggestions for higher rates of mergers for WISE IR-selected AGNs with W1W2 0.8 (Satyapal et al., 2014; Ellison et al., 2016). However, as can be seen from Fig. 2, our sample hardly has any AGN with W1W2 0.8. Also the optical host galaxies don’t suggest any significant morphological differences, except a few cases of disturbed morphology or evidence of interaction with a companion galaxy e.g. J105327.2+205836. To understand these aspects and clarify any possible evolutionary scenario, we fit a first order linear function in Log sSFR vs. WISE colour for LERG detections, non-detections, and also for compact and extended LERGs separately. Using Kendall-tau test, we find there exists a significant correlation ( 0.47, p 4.3710-10) between Log sSFR and WISE W2W3 colour (Fig. 6). Left panel of Fig. 6 also shows that compact radio sources (slope:0.810.12) and the detections (slope:0.780.16) have similar flatter slopes while extended sources (slope:0.980.19) and the non-detections (slope:0.960.14) have similar and somewhat steeper values but differences are only about 1-sigma. This correlation is consistent with the findings of Donoso et al. (2012), with our sample of sources lying in the region of weak AGN where sSFR is lower than the star-forming galaxies of Donoso et al. (2012) by about an order of magnitude.
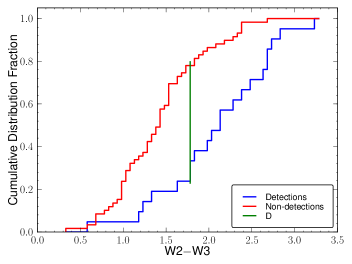
Fig. 3 (right panel) shows that 80 % of LERGs with no Hi detection have W2W3 1.8 which imply a significant old stellar population in their host galaxies. Also a high fraction (80 %) of extended LERGs have W2W3 1.8 (right panel of Fig. 6) again suggesting a significant old stellar population in their host galaxies compared with the compact sources. We further explored this using KS-test for W2W3 and Log sSFR properties of compact and extended LERGs. While the KS-test shows that the two samples have similar Log sSFR distributions with p value 0.94 and D 0.11, the two samples are distinct in their W2W3 values with p 0.0027 (3-sigma significance) and D 0.39. A KS test also demonstrates that Hi detections and non-detections amongst compact LERGs have more significant differences in WISE colour distributions (D 0.56, p 0.0023) as compared with Log sSFR (D 0.42, p 0.044). For extended LERGs, where we have very few detections, these differences are of low significance in both WISE colour (D 0.58, p 0.059) and Log sSFR (D 0.19, p 0.99). Hence this difference in WISE colours of two samples of different structures imply depletion of gas for the extended sources which appears to be playing an important role in Hi detection rates.
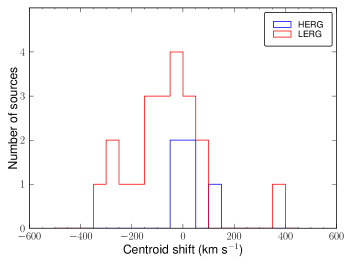
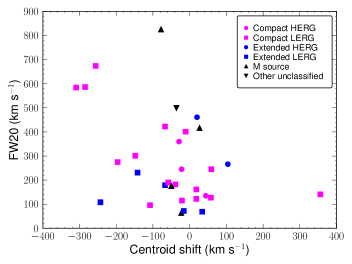
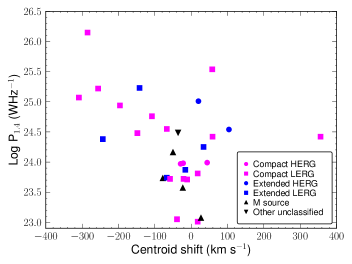
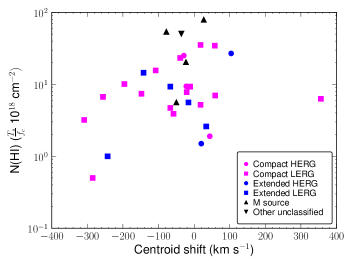
While this may indicate depletion of gas for the extended sources, we also explore any possible role of feedback from radio jets by examining the Hi absorption profiles of these sources. Hi absorption studies have shown that highly-blueshifted gas due to jet-cloud interactions often have low optical depth which may escape detection. For this discussion we have therefore used the FW20 (Full width at 20 percent of the peak) values and the centroid shift of the profiles w.r.t optical systemic velocity provided by Geréb et al. (2015). While HERGs have profiles with velocity shifts 100 km s-1 (upper panels Fig. 7) with respect to the optical redshift, LERGs exhibit velocity shifts over a large range extending to blueshifts of about 310 km s-1, with a median value of 58 km s-1. There is also a profile with large red-shift 356 km s-1 indicating possible infall of clouds towards the host galaxy. The most blueshifted features also tend to have the largest linewidths (FW20 500 km s-1) (upper right panel of Fig. 7). Geréb et al. (2015) had shown that these highly blue-shifted (centroid shift w.r.t. optical velocity 100 km s-1) features are associated with radio sources of higher luminosity at 1.4 GHz. In the lower left panel of Fig. 7, we have plotted our different categories of objects in a luminosity at 1.4 GHz vs. centroid shift plot. A Kendall-Tau test for Log radio luminosity vs. absolute centroid shift of LERGs gives 0.51 and p 0.0013 ( 3-sigma significance), indicating a significant relation as suggested earlier by Geréb et al. (2015). In addition, if we consider all compact sources classified as either LERGs or HERGs, a Kendall-tau test for Log radio luminosity vs. absolute centroid shift gives 0.62 and p 0.0002 ( 3-sigma significance), which is also significant. The lower right panel of Fig. 7 shows that the gas with higher column densities (1019 cm-2) have velocity shifts usually within 100 km s-1, while the blue-shifted LERGs show a weak tendency to have smaller values of column densities. Overall, these findings suggest that LERGs with lower radio luminosities trace the gas with less centroid shifts and some of these have high column-densities, while LERGs with relatively higher radio luminosities show evidence of outflows interacting with the ISM which may affect the star-formation rate and the WISE colours as the sources evolve.
5 Conclusions
We summarise our conclusions in this section.
-
1.
Earlier studies of Hi absorption had reported that compact radio sources, namely the compact steep-spectrum and giga-Hertz peaked spectrum sources, exhibited the highest detection rates of up to 45 per cent. We have shown that there is significant difference in distributions of W2W3 colour for Hi absorption detections and non-detections. Considering the galaxies with WISE infrared colour W2W3 2, which is typical of gas-rich systems, along with a compact radio structure leads to high detection rates of over 70 per cent.
-
2.
Although majority of LERGs have low Hi detection rate, the compact LERGs with bright WISE colours W2W3 2 also have high Hi detection rates of over 70 per cent, which indicates a gas and dust rich ISM.
-
3.
The distributions of W2W3 for compact and extended LERGs are significantly different, with the extended LERGs having lower values, the maximum difference in their cumulative distributions occurring at W2W3 1.8. The W2W3 colours appear to be playing an important role in determining detection of Hi in absorption rather than the specific star-formation rate.
-
4.
Overall a lower rate of Hi detection in LERGs is consistent with a scenario of suppressed star formation rate suggested in the literature, perhaps due to feedback from radio source. It is likely that the LERGs are following a secular evolutionary process and some of these started their evolution with higher gas/dust content and may have also undergone a minor merger at some stages of their evolution, but feedback from the radio source appears to be playing a role in affecting and suppressing star formation at later stages.
Acknowledgements
The authors thank an anonymous referee for many valuable comments and suggestions which have helped improve the paper significantly.This work of YC was sponsored by the Chinese Academy of Sciences Visiting Fellowship for Researchers from Developing Countries, Grant No. 2013FFJB0009”. YC also acknowledges support from National Natural Science Foundation of China (NSFC) Grant No. 11550110181 and the China Ministry of Science and Technology under State Key Development Program for Basic Research (973 program) No. 2012CB821802. This publication makes use of data products from the Wide-field Infrared Survey Explorer, which is a joint project of the University of California, Los Angeles, and the Jet Propulsion Laboratory/California Institute of Technology, funded by the National Aeronautics and Space Administration. This research has made use of NASA’s Astrophysics Data System. This research has made use of the NASA/IPAC Extragalactic Database (NED) which is operated by the Jet Propulsion Laboratory, California Institute of Technology, under contract with the National Aeronautics and Space Administration. This research has made use of the VizieR catalogue access tool, CDS, Strasbourg, France. The original description of the VizieR service was published in A&AS 143, 23. This work also makes use of Sloan Digital Sky Survey (SDSS)-III . Funding for SDSS-III has been provided by the Alfred P. Sloan Foundation, the Participating Institutions, the National Science Foundation, and the U.S. Department of Energy Office of Science. The SDSS-III web site is http://www.sdss3.org/. SDSS-III is managed by the Astrophysical Research Consortium for the Participating Institutions of the SDSS-III Collaboration including the University of Arizona, the Brazilian Participation Group, Brookhaven National Laboratory, Carnegie Mellon University, University of Florida, the French Participation Group, the German Participation Group, Harvard University, the Instituto de Astrofisica de Canarias, the Michigan State/Notre Dame/JINA Participation Group, Johns Hopkins University, Lawrence Berkeley National Laboratory, Max Planck Institute for Astrophysics, Max Planck Institute for Extraterrestrial Physics, New Mexico State University, New York University, Ohio State University, Pennsylvania State University, University of Portsmouth, Princeton University, the Spanish Participation Group, University of Tokyo, University of Utah, Vanderbilt University, University of Virginia, University of Washington, and Yale University. This work has also used different Python packages e.g. numpy, scipy and matplotlib.
References
- Abazajian et al. (2009) Abazajian K. N., et al., 2009, ApJS, 182, 543
- Allen et al. (2006) Allen S. W., Dunn R. J. H., Fabian A. C., Taylor G. B., Reynolds C. S., 2006, MNRAS, 372, 21
- Allison et al. (2012) Allison J. R., et al., 2012, MNRAS, 423, 2601
- Baldwin et al. (1981) Baldwin J. A., Phillips M. M., Terlevich R., 1981, PASP, 93, 5
- Balmaverde et al. (2008) Balmaverde B., Baldi R. D., Capetti A., 2008, A&A, 486, 119
- Becker et al. (1995) Becker R. H., White R. L., Helfand D. J., 1995, ApJ, 450, 559
- Best (2007) Best P. N., 2007, New Astron. Rev., 51, 168
- Best & Heckman (2012) Best P. N., Heckman T. M., 2012, MNRAS, 421, 1569
- Brinchmann et al. (2004a) Brinchmann J., Charlot S., Heckman T. M., Kauffmann G., Tremonti C., White S. D. M., 2004a, ArXiv Astrophysics e-prints, (arXiv:0406220v1)
- Brinchmann et al. (2004b) Brinchmann J., Charlot S., White S. D. M., Tremonti C., Kauffmann G., Heckman T., Brinkmann J., 2004b, MNRAS, 351, 1151
- Buttiglione et al. (2010) Buttiglione S., Capetti A., Celotti A., Axon D. J., Chiaberge M., Macchetto F. D., Sparks W. B., 2010, A&A, 509, A6
- Chandola et al. (2011) Chandola Y., Sirothia S. K., Saikia D. J., 2011, MNRAS, 418, 1787
- Chandola et al. (2013) Chandola Y., Gupta N., Saikia D. J., 2013, MNRAS, 429, 2380
- Chiaberge et al. (2015) Chiaberge M., Gilli R., Lotz J. M., Norman C., 2015, ApJ, 806, 147
- Cid Fernandes et al. (2010) Cid Fernandes R., Stasińska G., Schlickmann M. S., Mateus A., Vale Asari N., Schoenell W., Sodré L., 2010, MNRAS, 403, 1036
- Condon et al. (1998) Condon J. J., Cotton W. D., Greisen E. W., Yin Q. F., Perley R. A., Taylor G. B., Broderick J. J., 1998, AJ, 115, 1693
- Curran et al. (2013) Curran S. J., Allison J. R., Glowacki M., Whiting M. T., Sadler E. M., 2013, MNRAS, 431, 3408
- Cutri et al. (2013) Cutri R. M., et al. 2013, VizieR Online Data Catalog, 2328
- Cutri et al. (2013) Cutri R. M., et al., 2013, Technical report, Explanatory Supplement to the AllWISE Data Release Products
- Davis et al. (2015) Davis T. A., et al., 2015, MNRAS, 449, 3503
- Donoso et al. (2012) Donoso E., et al., 2012, ApJ, 748, 80
- Ellison et al. (2015) Ellison S. L., Patton D. R., Hickox R. C., 2015, MNRAS, 451, L35
- Ellison et al. (2016) Ellison S. L., Teimoorinia H., Rosario D. J., Mendel J. T., 2016, MNRAS, 458, L34
- Emonts et al. (2010) Emonts B. H. C., et al., 2010, MNRAS, 406, 987
- Fanaroff & Riley (1974) Fanaroff B. L., Riley J. M., 1974, MNRAS, 167, 31P
- Geréb et al. (2014) Geréb K., Morganti R., Oosterloo T. A., 2014, A&A, 569, A35
- Geréb et al. (2015) Geréb K., Maccagni F. M., Morganti R., Oosterloo T. A., 2015, A&A, 575, A44
- Gupta et al. (2006) Gupta N., Salter C. J., Saikia D. J., Ghosh T., Jeyakumar S., 2006, MNRAS, 373, 972
- Gürkan et al. (2015) Gürkan G., et al., 2015, MNRAS, 452, 3776
- Hardcastle et al. (2007) Hardcastle M. J., Evans D. A., Croston J. H., 2007, MNRAS, 376, 1849
- Heckman & Best (2014) Heckman T. M., Best P. N., 2014, ARA&A, 52, 589
- Hine & Longair (1979) Hine R. G., Longair M. S., 1979, MNRAS, 188, 111
- Kauffmann et al. (2003) Kauffmann G., et al., 2003, MNRAS, 341, 33
- Kauffmann et al. (2008) Kauffmann G., Heckman T. M., Best P. N., 2008, MNRAS, 384, 953
- Kewley et al. (2001) Kewley L. J., Dopita M. A., Sutherland R. S., Heisler C. A., Trevena J., 2001, ApJ, 556, 121
- Kewley et al. (2006) Kewley L. J., Groves B., Kauffmann G., Heckman T., 2006, MNRAS, 372, 961
- Laing et al. (1994) Laing R. A., Jenkins C. R., Wall J. V., Unger S. W., 1994, in Bicknell G. V., Dopita M. A., Quinn P. J., eds, Astronomical Society of the Pacific Conference Series Vol. 54, The Physics of Active Galaxies. p. 201
- Martini (2004) Martini P., 2004, in Storchi-Bergmann T., Ho L. C., Schmitt H. R., eds, IAU Symposium Vol. 222, The Interplay Among Black Holes, Stars and ISM in Galactic Nuclei. pp 235–241 (arXiv:astro-ph/0404426), doi:10.1017/S1743921304002170
- Morganti et al. (2001) Morganti R., Oosterloo T. A., Tadhunter C. N., van Moorsel G., Killeen N., Wills K. A., 2001, MNRAS, 323, 331
- Narayan & Yi (1994) Narayan R., Yi I., 1994, ApJ, 428, L13
- Narayan & Yi (1995) Narayan R., Yi I., 1995, ApJ, 452, 710
- Nikutta et al. (2014) Nikutta R., Hunt-Walker N., Nenkova M., Ivezić Ž., Elitzur M., 2014, MNRAS, 442, 3361
- Novikov & Thorne (1973) Novikov I. D., Thorne K. S., 1973, in Dewitt C., Dewitt B. S., eds, Black Holes (Les Astres Occlus). pp 343–450
- Ogle et al. (2006) Ogle P., Whysong D., Antonucci R., 2006, ApJ, 647, 161
- Pace & Salim (2016) Pace C., Salim S., 2016, ApJ, 818, 65
- Pihlström et al. (2003) Pihlström Y. M., Conway J. E., Vermeulen R. C., 2003, A&A, 404, 871
- Sadler et al. (2014) Sadler E. M., Ekers R. D., Mahony E. K., Mauch T., Murphy T., 2014, MNRAS, 438, 796
- Salim et al. (2007) Salim S., et al., 2007, ApJS, 173, 267
- Satyapal et al. (2014) Satyapal S., Ellison S. L., McAlpine W., Hickox R. C., Patton D. R., Mendel J. T., 2014, MNRAS, 441, 1297
- Shabala et al. (2012) Shabala S. S., et al., 2012, MNRAS, 423, 59
- Shakura & Sunyaev (1973) Shakura N. I., Sunyaev R. A., 1973, A&A, 24, 337
- Shao et al. (2013) Shao L., Kauffmann G., Li C., Wang J., Heckman T. M., 2013, MNRAS, 436, 3451
- Snellen et al. (2004) Snellen I. A. G., Mack K.-H., Schilizzi R. T., Tschager W., 2004, MNRAS, 348, 227
- Son et al. (2012) Son D., Woo J.-H., Kim S. C., Fu H., Kawakatu N., Bennert V. N., Nagao T., Park D., 2012, ApJ, 757, 140
- Tadhunter et al. (2014) Tadhunter C., Dicken D., Morganti R., Konyves V., Ysard N., Nesvadba N., Ramos Almeida C., 2014, MNRAS, 445, L51
- Taylor (2005) Taylor M. B., 2005, in Shopbell P., Britton M., Ebert R., eds, Astronomical Society of the Pacific Conference Series Vol. 347, Astronomical Data Analysis Software and Systems XIV. p. 29
- Taylor et al. (2007) Taylor G. B., et al., 2007, ApJ, 671, 1355
- Vermeulen et al. (2003) Vermeulen R. C., et al., 2003, A&A, 404, 861
- Wright et al. (2010) Wright E. L., et al., 2010, AJ, 140, 1868
- Yan et al. (2013) Yan L., et al., 2013, AJ, 145, 55
- York et al. (2000) York D. G., et al., 2000, AJ, 120, 1579
- Young et al. (2014) Young L. M., et al., 2014, MNRAS, 444, 3408
- Yuan & Narayan (2014) Yuan F., Narayan R., 2014, ARA&A, 52, 529
- van Gorkom et al. (1989) van Gorkom J. H., Knapp G. R., Ekers R. D., Ekers D. D., Laing R. A., Polk K. S., 1989, AJ, 97, 708
| (1) | (2) | (3) | (4) | (5) | (6) | (7) | (8) | (9) | (10) | (11) | (12) |
|---|---|---|---|---|---|---|---|---|---|---|---|
| Sq. | RA | Dec | Hβ Flux | O[iii] Flux | O[iii] EQW | O[i] Flux | Hα Flux | N[ii] Flux | S[ii] Flux | Optical | Radio |
| Å | Class | Class | |||||||||
| 1 | 07 57 56.7 | +39 59 36 | 186.261( 10.098) | 1364.281( 20.400) | 37.224( 0.360) | 105.589( 8.243) | 803.512( 23.928) | 691.473( 16.945) | 257.189( 10.055) | HERG | C |
| 2 | 08 06 01.5 | +19 06 15 | 46.529( 8.398) | 376.843( 10.831) | 11.258( 0.222) | 43.195( 6.408) | 336.209( 17.030) | 381.474( 13.136) | 136.350( 9.655) | HERG | E |
| 3 | 08 09 38.9 | +34 55 37 | 91.580( 13.851) | 44.482( 8.970) | 1.059( 0.134) | 18.584( 7.407) | 114.215( 21.062) | 132.103( 15.357) | 34.271( 10.370) | LERG | E |
| 4 | 08 36 37.8 | +44 01 10 | 141.161( 11.989) | 915.593( 17.147) | 23.732( 0.282) | 114.595( 9.000) | 528.403( 26.060) | 632.954( 20.318) | 254.389( 13.003) | HERG | C |
| 5 | 08 43 07.1 | +45 37 43 | 6.874( 4.445) | 6.719( 4.618) | 0.908( 0.462) | 1.435( 3.411) | 28.736( 13.966) | 29.787( 10.209) | 2.635( 5.381) | LERG | C |
| 6 | 09 09 37.4 | +19 28 08 | 254.722( 18.626) | 342.203( 16.477) | 3.349( 0.108) | 258.302( 17.929) | 901.681( 48.750) | 957.775( 37.700) | 593.890( 26.776) | LERG | C |
| …. | …. | …. | …. | …. | …. | …. | …. | …. | …. | …. | …. |
Notes: Column 1: Sequence no. ; Columns 2-3: co-oridinates for radio sources from Geréb et al. (2015); columns 4-10: line parameters for different optical lines (with errors) from MPA-JHU group database (Brinchmann et al. 2004a); column 11: Optical classification: HERG/LERG/U(unclassified) following Best & Heckman (2012); column 12: radio structural classification C (compact) E(extended) M (Merger/optical blue objects) from Geréb et al. (2015)
Flux values are in units of 10-17 ergs s-1 cm-2 and errors are scaled up by factors as recommended by MPA-JHU group (Brinchmann et al. 2004a). In column 6, O[iii] equivalent width (EQW) is in Angstrom. Only absolute values for these measurements are provided in this table.
† for absorption lines with equivalent width positive.
| (1) | (2) | (3) | (4) | (5) | (6) | (7) | (8) | (9) | (10) | (11) | 12 |
|---|---|---|---|---|---|---|---|---|---|---|---|
| Sq. | RA | Dec | Hβ Flux | O[iii] Flux | O[iii] EQW | O[i] Flux | Hα Flux | N[ii] Flux | S[ii] Flux | Optical | Radio |
| Å | Class | Class | |||||||||
| 1 | 07 56 07.1 | +38 34 01 | 14.764( 5.731) | 14.764( 4.364) | 1.698( 0.395) | 9.303( 4.089) | 46.291( 11.643) | 109.312( 10.642) | 26.828( 5.360) | LERG | C |
| 2 | 07 58 28.1 | +37 47 12 | 125.398( 22.360) | 278.040( 19.919) | 2.571( 0.121) | 119.835( 19.460) | 473.809( 54.911) | 922.909( 45.210) | 150.965( 24.682) | LERG | E |
| 3 | 07 58 47.0 | +27 05 16 | 52.036( 6.965) | 37.139( 4.774) | 2.213( 0.209) | 21.922( 3.793) | 102.876( 10.638) | 69.520( 6.935) | 27.495( 4.739) | LERG | C |
| 4 | 08 00 42.0 | +32 17 28 | 4.400( 11.869) | 11.738( 8.383) | 1.278( 0.391) | 2.331( 6.052) | 9.035( 19.401) | 19.641( 13.878) | 1.880( 9.496)† | LERG | E |
| 5 | 08 18 27.3 | +28 14 03 | 98.942( 11.180) | 7.570( 7.961) | 0.177( 0.201) | 3.206( 8.697) | 81.246( 16.620) | 24.049( 13.662) | 0.213( 10.966) | U | C |
| 6 | 08 18 54.1 | +22 47 45 | 24.458( 8.422) | 52.467( 6.703) | 1.533( 0.139) | 24.411( 5.844) | 86.687( 16.420) | 142.249( 12.049) | 35.152( 7.774) | LERG | E |
| …. | …. | …. | …. | …. | …. | …. | …. | …. | …. | …. | …. |
Notes: Column 1: Sequence no. ; Columns 2-3: co-oridinates for radio sources from Geréb et al. (2015); columns 4-10: line parameters for different optical lines (with errors) from MPA-JHU group database (Brinchmann et al. 2004a); column 11: Optical classification: HERG/LERG/U(unclassified) following Best & Heckman (2012); column 12: radio structural classification C (compact) E(extended) M (Merger/optical blue objects) from Geréb et al. (2015).
Flux values are in units of 10-17 ergs s-1 cm-2 and errors are scaled up by factors as recommended by MPA-JHU group (Brinchmann et al. 2004a). In column 6, O[iii] equivalent width (EQW) is in Angstrom. Only absolute values for these measurements are provided in this table.
†: absorption lines with equivalent width positive.
| (1) | (2) | (3) | (4) | (5) | (6) | (7 ) | (8) | (9) |
|---|---|---|---|---|---|---|---|---|
| Sq. | ALLWISE | W1mag | W2mag | W3mag | W4mag | Log SM | Log SFR | Log sSFR |
| name | M⊙ | M⊙yr-1 | yr-1 | |||||
| 1 | J075607.17+383400.4 | 14.101( 0.043) | 13.750( 0.052) | 12.265( ….. ) | 8.980( ….. ) | 11.602 | -0.342 | -12.003 |
| 2 | J075756.71+395936.1 | 12.832( 0.023) | 12.338( 0.024) | 8.749( 0.028) | 5.088( 0.030) | 10.831 | -0.121 | -11.008 |
| 3 | J075828.11+374711.8 | 10.837( 0.021) | 10.788( 0.021) | 9.671( 0.052) | 7.764( 0.254) | 11.620 | -0.554 | -12.226 |
| 4 | J075847.02+270515.7 | 12.877( 0.025) | 12.226( 0.022) | 9.549( 0.044) | 7.472( 0.166) | 10.739 | 0.381 | -10.383 |
| 5 | J080041.93+321728.8 | 13.789( 0.038) | 13.514( 0.043) | 12.192( ….. ) | 8.239( ….. ) | 11.729 | -0.091 | -11.897 |
| 6 | J080601.54+190614.6 | 12.462( 0.026) | 12.195( 0.026) | 10.120( 0.068) | 8.430( 0.443) | 11.399 | 0.662 | -10.785 |
| 7 | J080938.85+345537.3 | 12.477( 0.026) | 12.176( 0.025) | 10.340( 0.092) | 8.218( 0.422) | 11.198 | 0.783 | -10.473 |
| …. | …. | …. | …. | …. | …. | …. | …. | …. |
| …. | …. | …. | …. | …. | …. | …. | …. | …. |
Notes: Column 1: Sequence number; column 2: WISE name of sources; columns 3-6: WISE vega magnitudes at W1(3.4 m), W2(4.6 m), W3(12 m) and W4(22 m) with errors from WISE catalog (Cutri et al. 2013); column 7: stellar masses (SM) from MPA-JPU database (Brinchmann et al. 2004a,2004b); column 8: star formation rates (SFR) from MPA-JPU database (Brinchmann et al. 2004a,2004b); column 9: specific star formation rates (sSFR) from MPA-JPU database (Brinchmann et al. 2004a,2004b).
Upper limits on magnitudes are given with errors as blank (….).