Exclusive Photoproduction of Upsilon in pPb collisions with the CMS
Abstract:
Results of exclusive photoproduction of Upsilon states in Ultraperipheral collisions (UPC) of protons and ions with the CMS experiment are presented, which provides a clean probe of the gluon distribution at small values of parton fractional momenta at central rapidities (—y— ). The three Upsilon states (1S, 2S, 3S) are measured in the dimuon decay channel along with the photon-photon decaying to dimuon QED continuum at TeV for integrated luminosity of nb-1. The total Upsilon photoproduction cross sections at different photon-proton center of mass energy and t-differential distributions are presented and compared with other experimental results as well as theoretical predictions.
1 Introduction
Exclusive photoproduction of heavy vector mesons at very high photon-proton center-of-mass energies can be studied in ultraperipheral collisions (UPC) of protons (ions). Recently, CMS, ALICE [1] and LHCb [2] presented their measurements of exclusive heavy vector meson photoproduction at the LHC. Since the process occurs through or interaction via the exchange of two-gluons with no net color transfer and thus, at the LO, the cross section is proportional to the square of the gluon density in the target proton or ion. It provides a valuable probe of the gluon density at the small gluon momentum fraction which is kinematically related to (). The exclusive photoproduction of (1S, 2S, 3S) measurement was presented in their dimuon decay channel in ultraperipheral collisions of protons and heavy ions (pPb) with the CMS experiment at TeV for an integrated luminosity of nb-1 (The luminosity corresponds to the data taken by HLT trigger). The photoproduction cross section for was measured as a function of in the range GeV which corresponds to the rapidity of the meson in the range and values are of the order to . (Later in the analysis, we decided to restrict the rapidity, —y—2.2, to have better muon finding efficiency). The dependence of the elastic photoproduction cross section on the squared transverse momentum approximating the four-momentum transfer at the proton vertex (), can be parametrized with an exponential function at low values of . The differential cross section , was measured in the range (GeV/c)2 and the b-slope parameter was estimated.


2 Detector
The CMS detector at LHC is composed of superconducting solenoid of m internal diameter which provides the magnetic field of T. The solenoid volume contains silicon pixel, strip tracker, electromagnetic calorimeter, hadronic calorimeter. Muons are measured in gas-ionization detectors embedded in the steel flux-return yoke. The muons are measured in the pseudorapidity window , with muon station consists of: Drift Tubes, Cathode Strip Chambers, and Resistive Plate Chambers. Matching the tracks from muon stations to the tracks measured in the silicon tracker results in a transverse momentum resolution better than for smaller than GeV/c. The first level (L1) of the CMS trigger system, composed of custom hardware processors, uses information from the calorimeters and muon detectors to select the most interesting events in a fixed time interval of less than s. The high-level trigger (HLT) processor farm further decreases the event rate to less than 1 kHz, before data storage. A detailed description of CMS can be found in Ref. [9].
3 Event selection
The pPb collisions dataset at recorded by CMS experiment in 2013, corresponding to integrated luminosity nb-1 was used in this analysis. The data comprise two subsets: the pPb sample, with the Pb ion going in direction, corresponding to an integrated luminosity of nb-1, and the Pbp sample, with the Pb ion going in the direction, corresponding to an integrated luminosity of nb-1.
The exclusive (nS) photoproduction signal (Figure 1 (left)) and elastic QED background (Figure . 1 (right)) were generated using Starlight event generator. The exclusive signal events (where the photon comes from Pb) were simulated assuming an exponential dependence on the four-momentum transfer squared at the proton vertex, with b = 4 GeV2, and power-law dependence of the cross section on the photon-proton center-of-mass energy, with . The and parameter were tuned to describe the data in this analysis. The small fraction of events where the photon is emitted by proton is considered as background in this analysis.
The UPC events were selected by applying dedicated HLT trigger which selects at least one muon in each event and at least one to six tracks. The (nS) states are studied in dimuon decay channel. To select the exclusive (nS) events, two muon tracks originating from the same primary vertex in each event were used. The muons were selected with GeV and pseudorapidity , in order to have high muon finding efficiency. The of the muon pair was selected between to GeV. The lower cut on muon pair reduces the contamination from elastic QED background and higher cut on muon pair reduces the contamination from inelastic background (proton dissociation, inclusive , Drell-Yan). The rapidity of muon pair is restricted to .
Figure 2 shows the invariant mass distribution of the pair in the range between and GeV where the three resonances (1S), (2S) and (3S), are visible. The fit to the data was performed using RooFit [7] with a linear function to describe the continuum background from the exclusive two-photon process and three Gaussians to describe the signal peaks. The width of the (1S) Gaussian and the signal and background yields were free parameters, while the widths of the (2S) and (3S) peaks were fixed to their world average values [8].
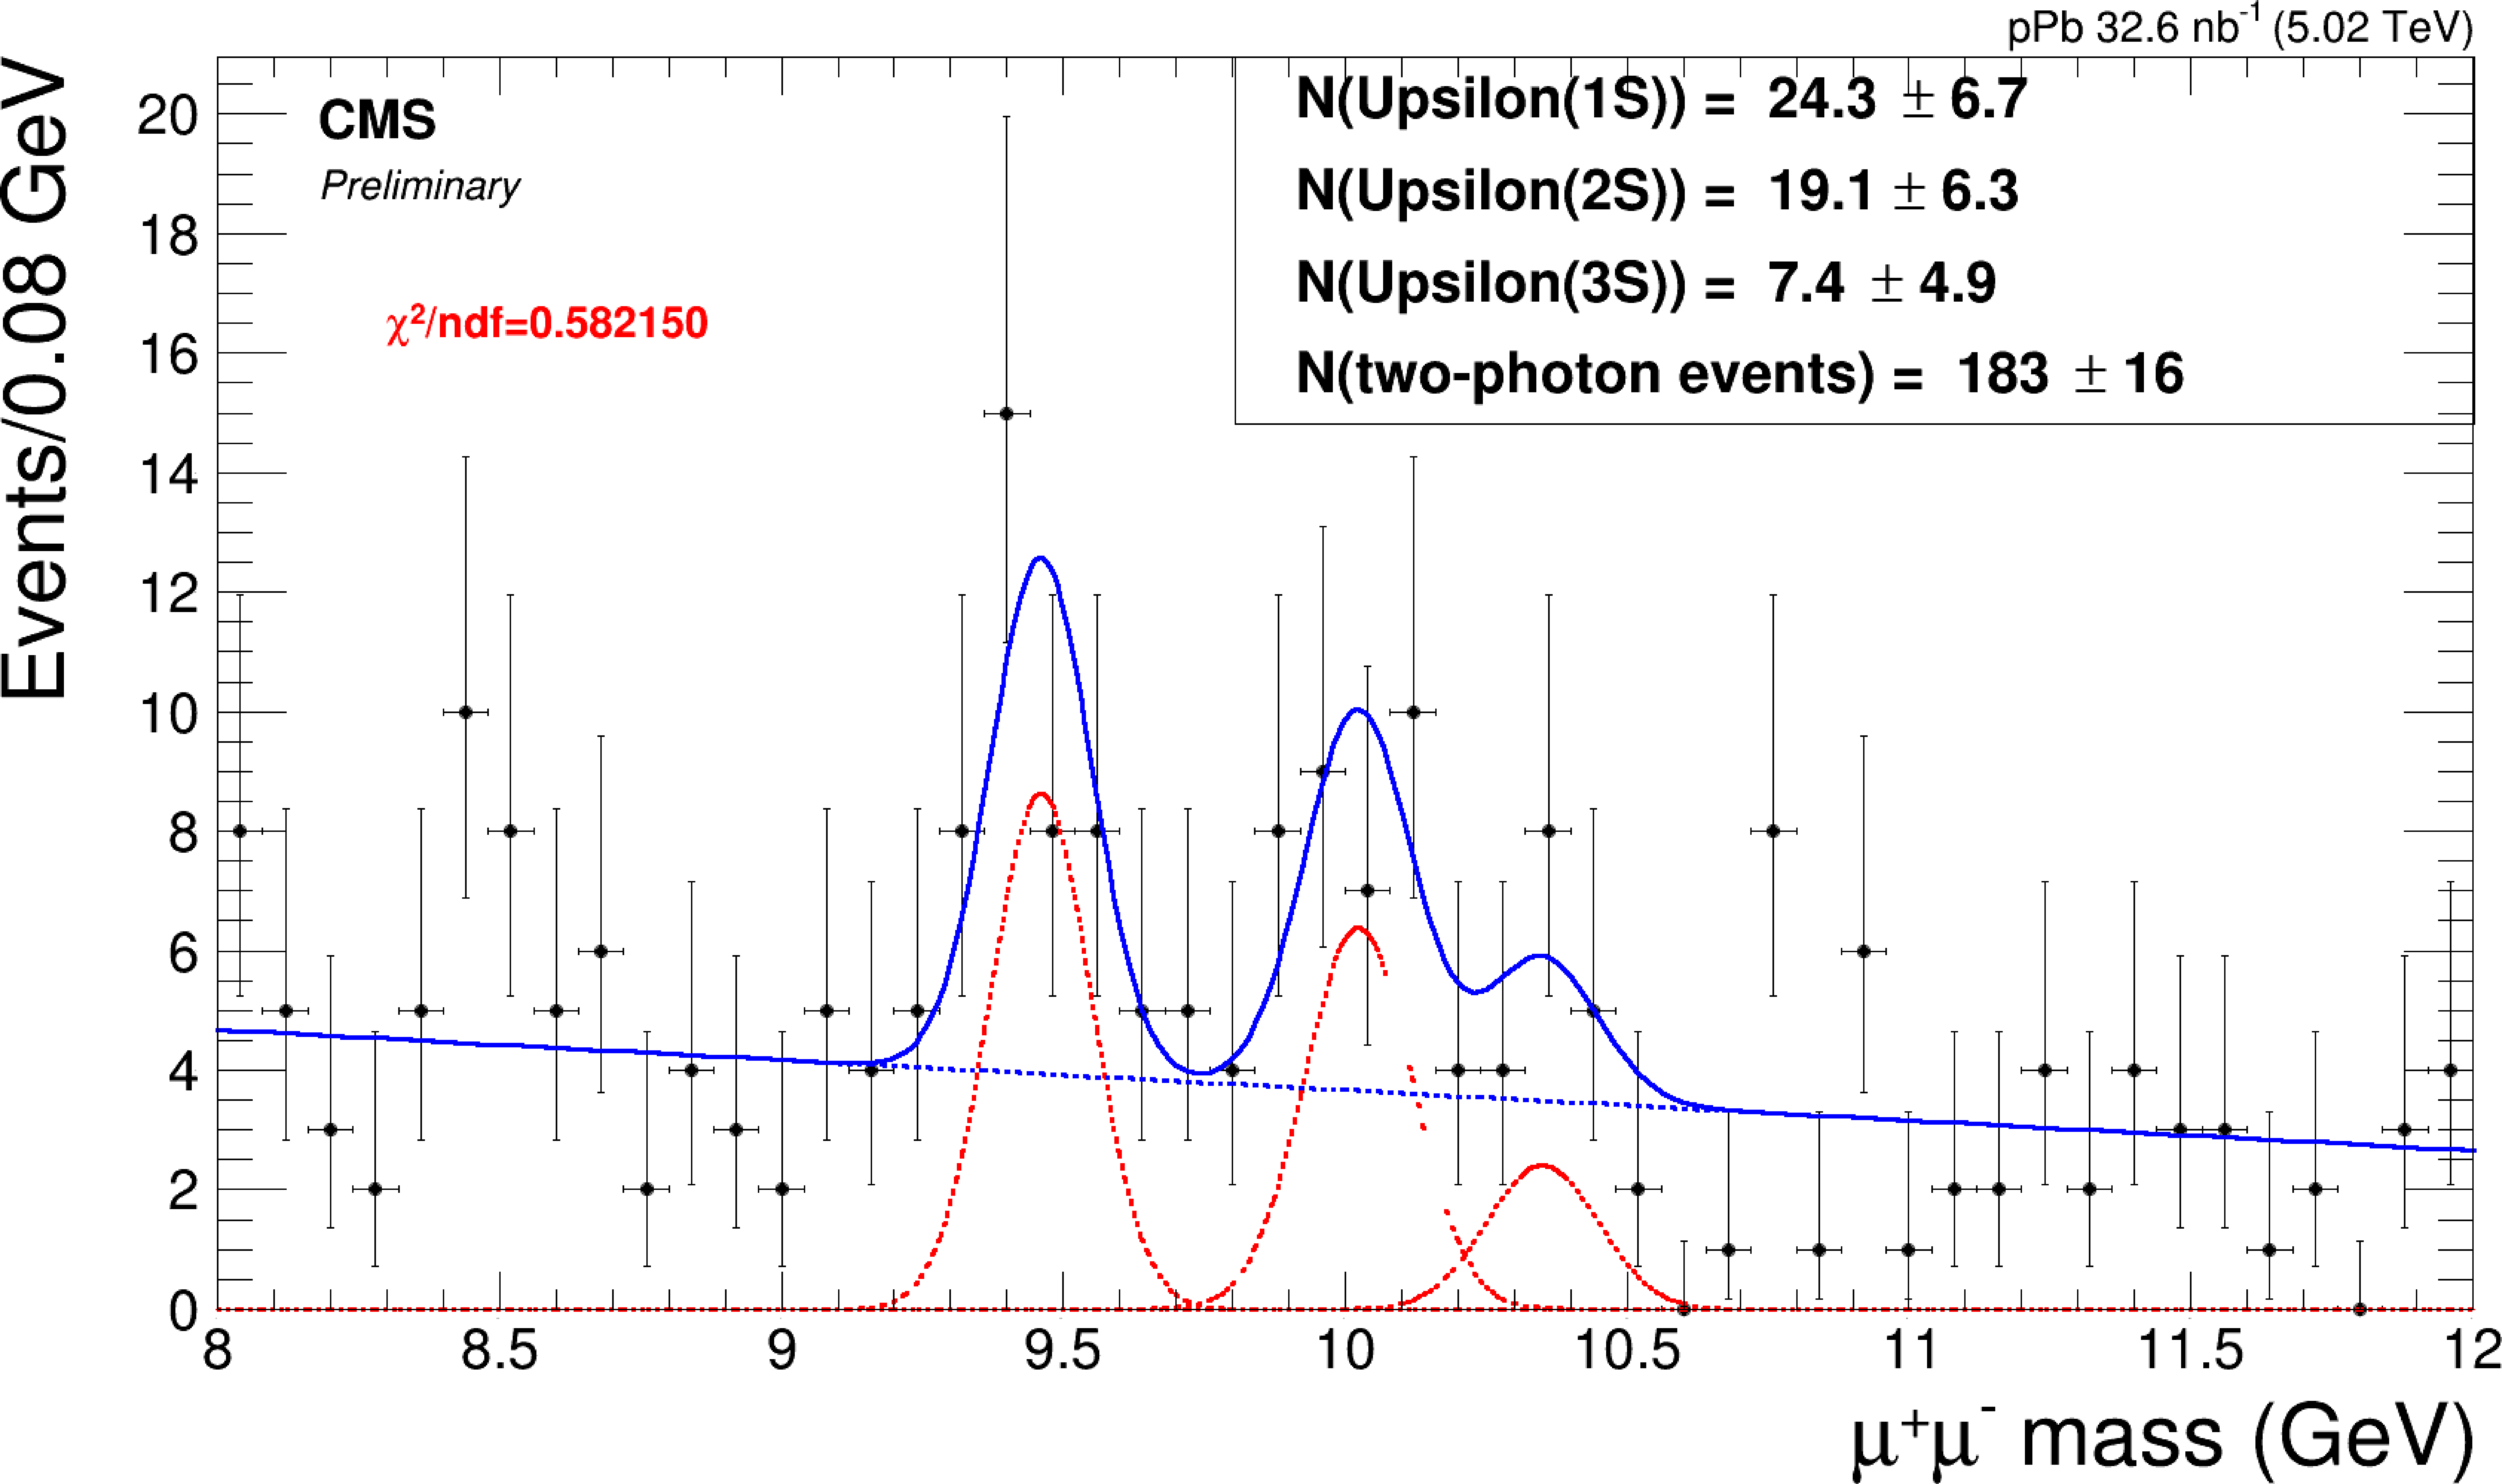
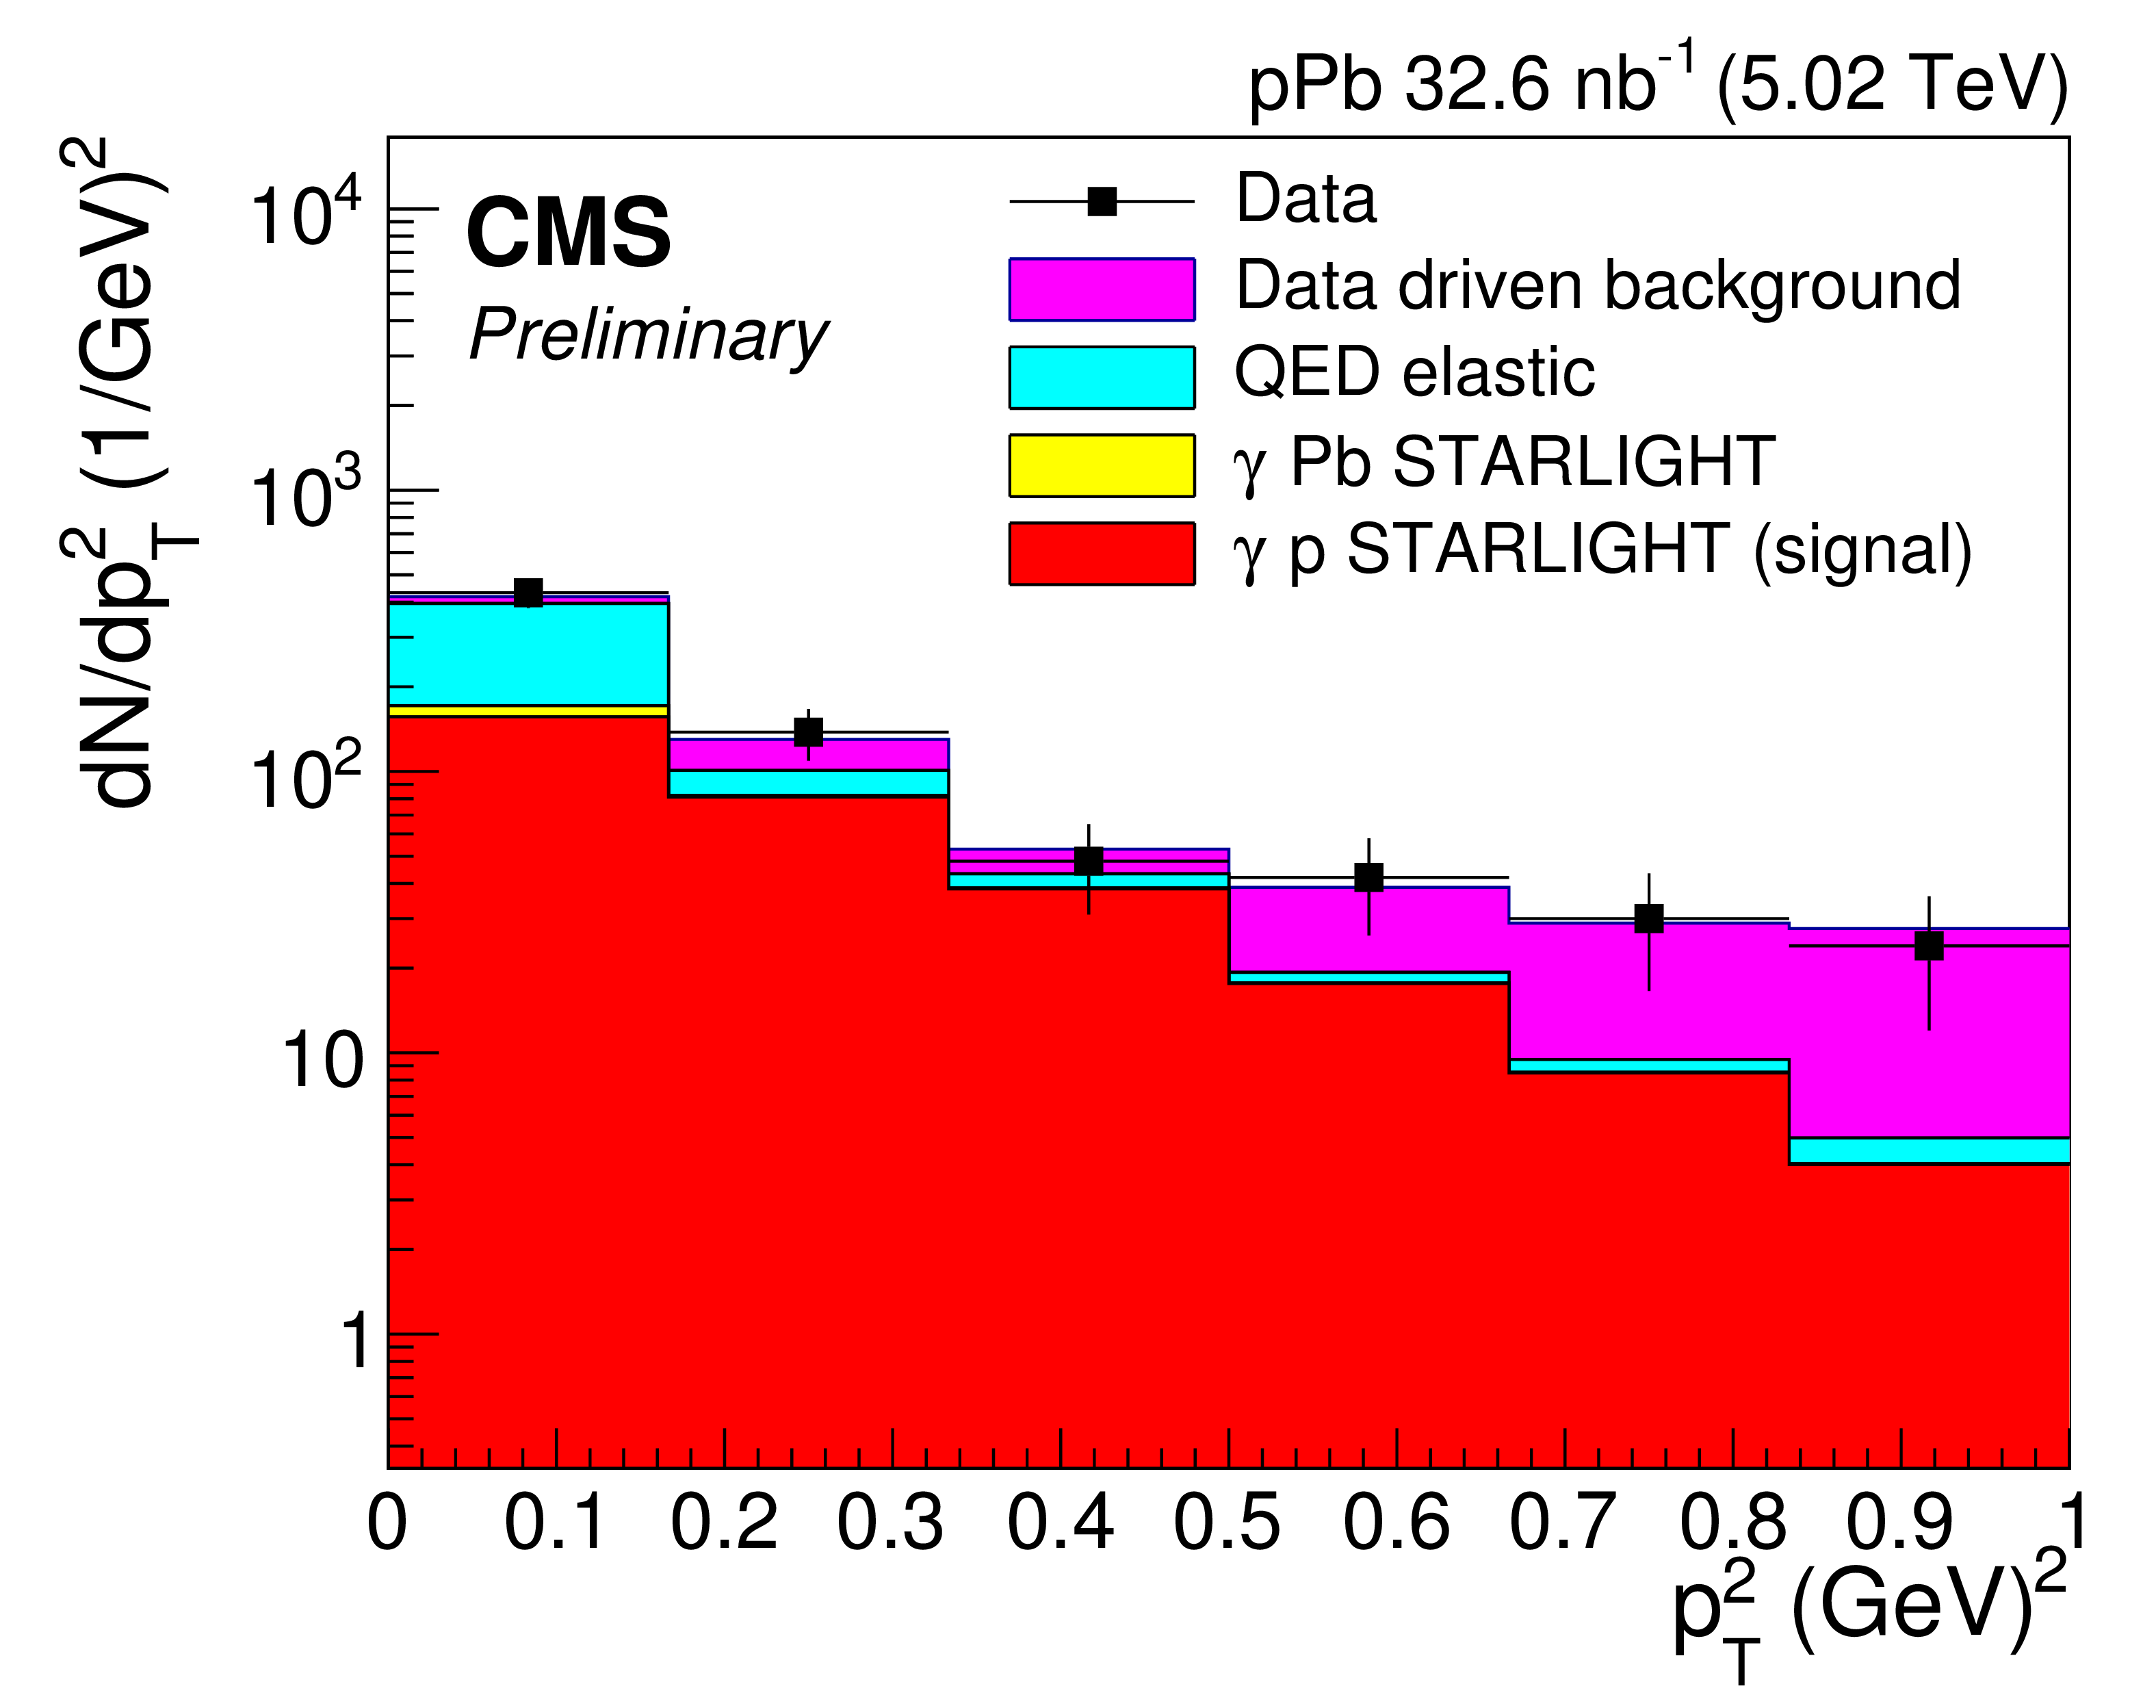
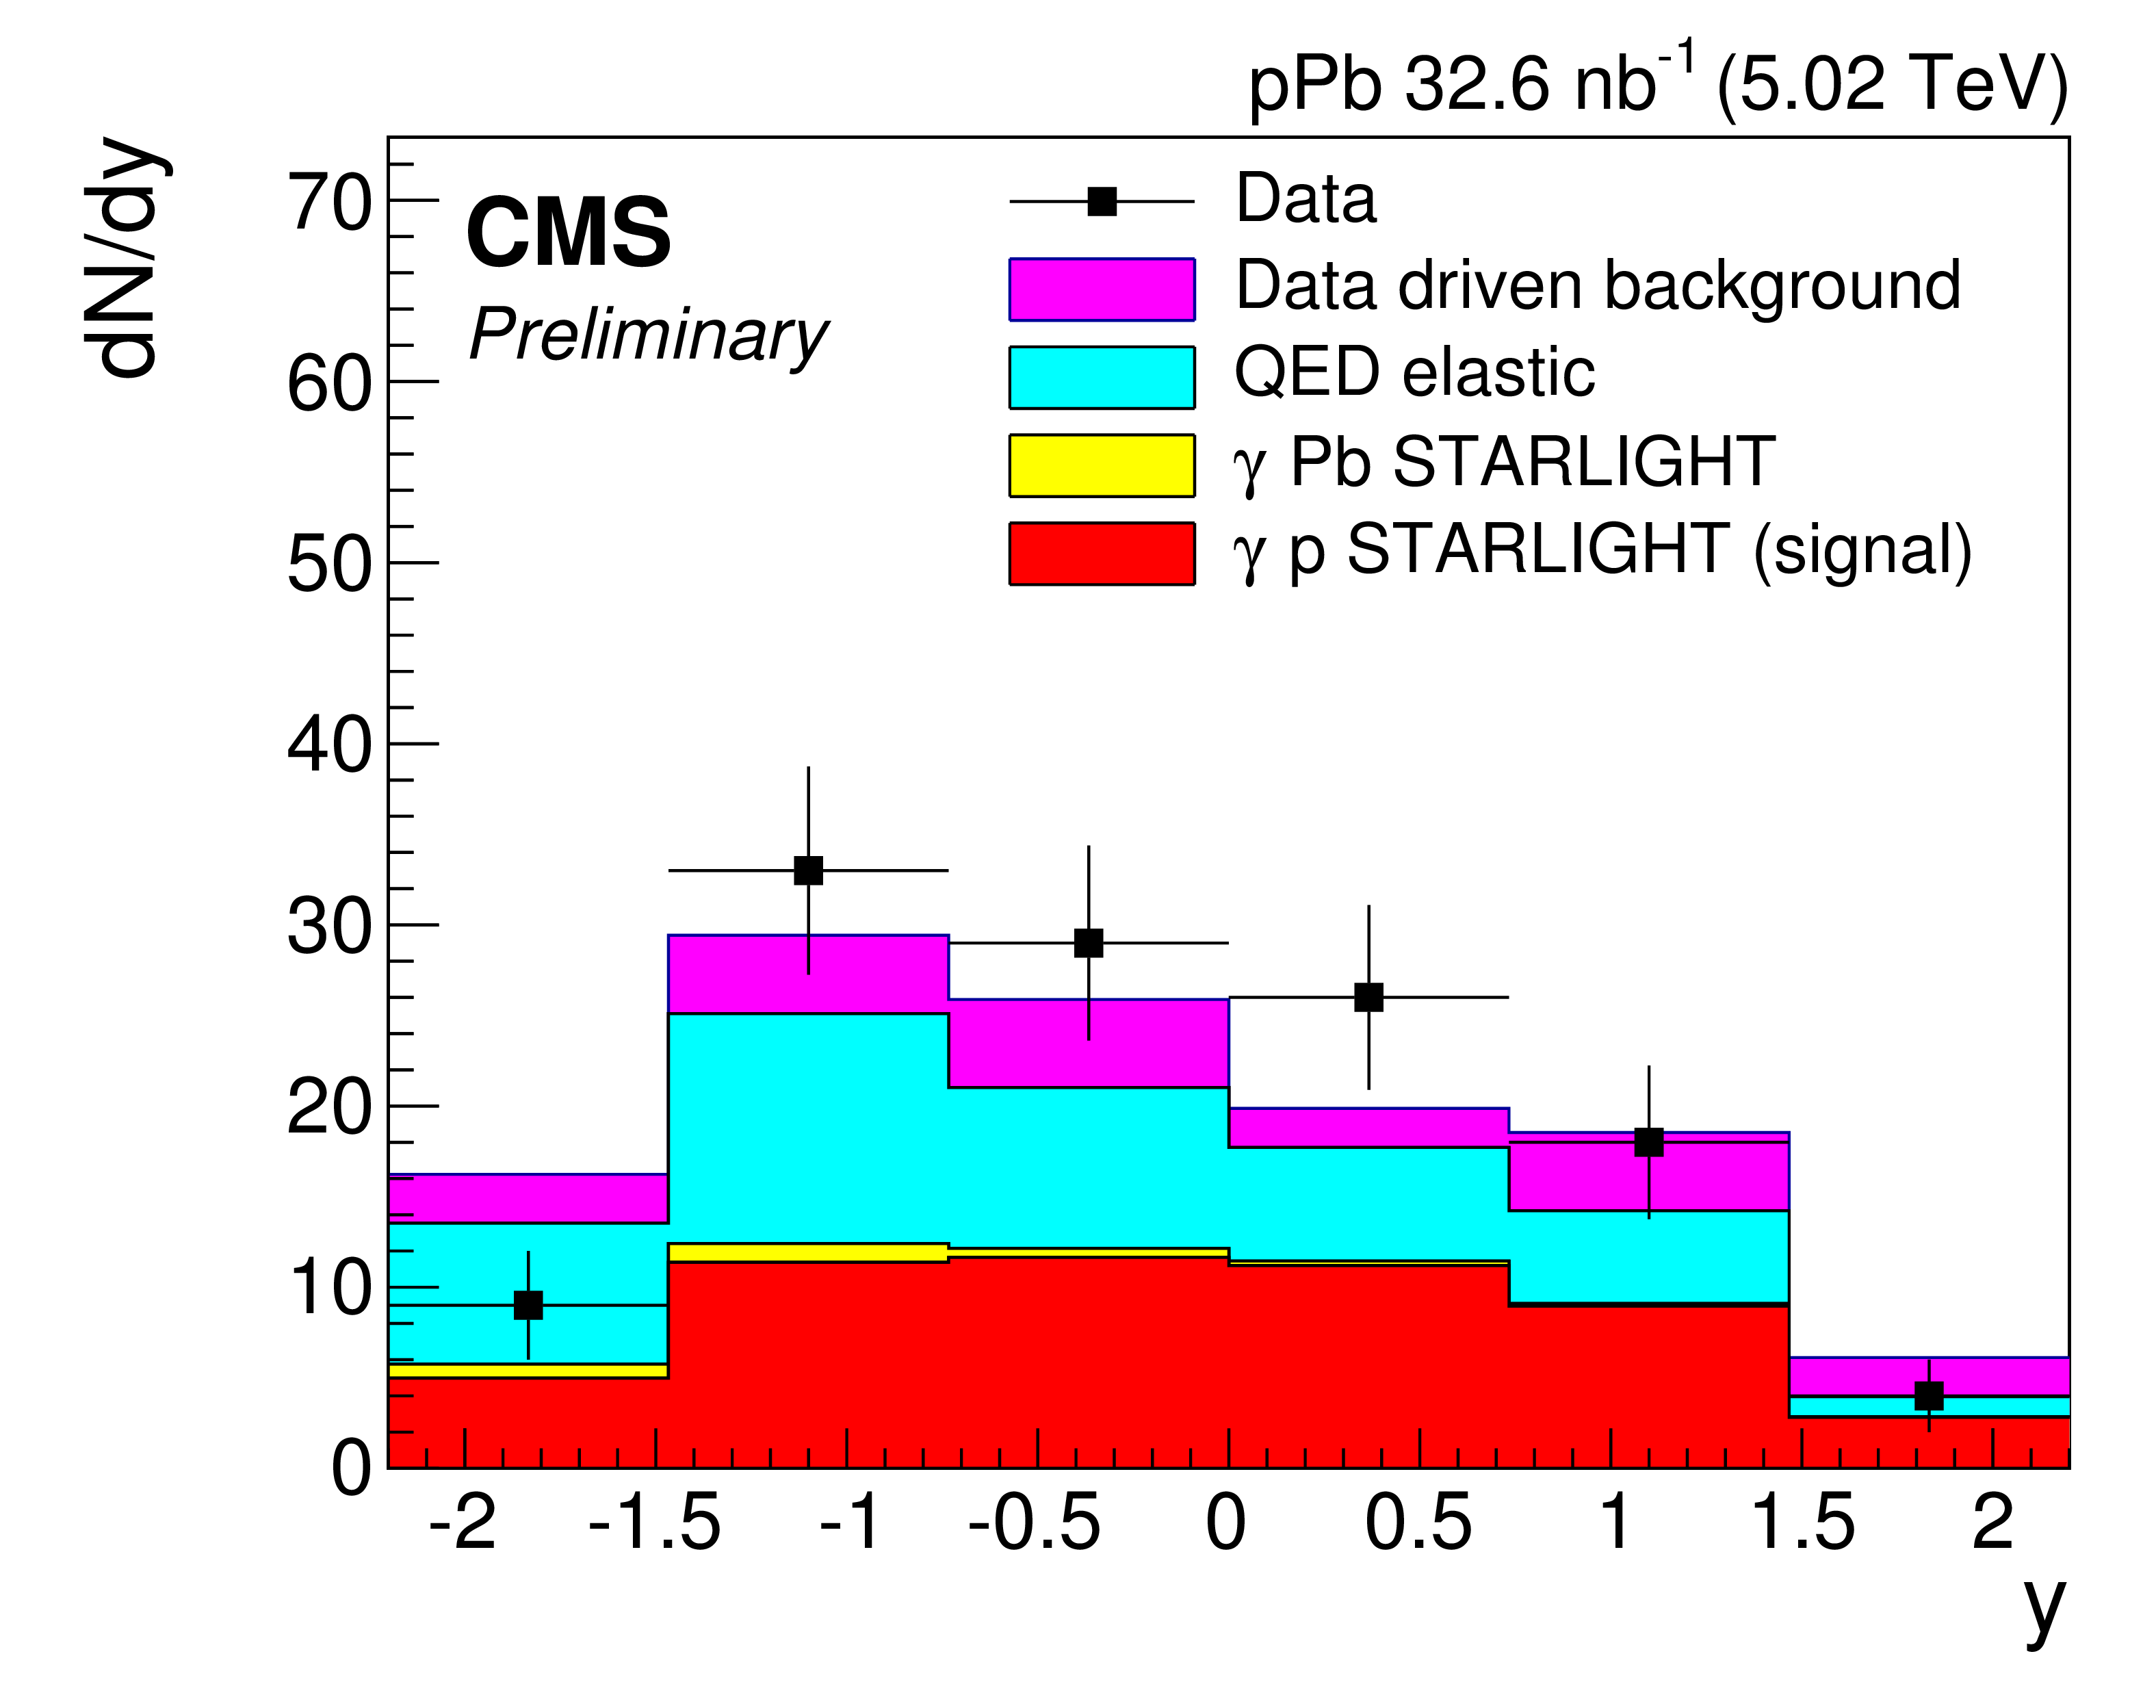
Figure 3 shows the dimuon (left) and rapidity (right) distributions in the invariant mass interval GeV for events passing all the selection criteria for the combined pPb and Pbp samples. The data are compared to the MC simulations of the exclusive (nS) production and elastic QED background processes, both simulated with Starlight and normalized to the luminosity of the data. Also shown are the inelastic background events estimated from the data as explained in Section 4.
4 Determining the exclusive yield
The dominant background contribution to exclusive signal comes from QED, , which was estimated by Starlight. The absolute prediction of QED was checked by comparing the data between invariant mass region 8–9.12 and 10.64–12 GeV for dimuon GeV to the simulation. The simulation reproduces data well in this region, with data-MC ratio 1.03 0.10. The contribution of non-exclusive background (inclusive , Drell-Yan and proton dissociation) was estimated by data-driven method by selecting events with more than 2 tracks. This template was normalized to two muon track sample in the region of dimuon GeV. The normalized template describes well the region of high dimuon in the data in all four y bins used for the cross section extraction. Additional background in this analysis originates from a small contribution of exclusive events. The fraction of these events in the total number of exclusive events was estimated using the reweighted Starlight MC sample. These backgrounds were subtracted from data to get the exclusive signal.
5 Cross section extraction
The data sample selected as described in Section 3 and 4 was used to determine the differential and cross sections in five bins of and four bins of respectively, for GeV2 and . The dsitribution was used to extract the slope of the exponential dependence. The background subtracted and distributions were first unfolded to the region GeV2, , and muon GeV, using the iterative Bayesian unfolding technique, as implemented in the RooUnfold package, with four iterations, to correct for detector effects and data migration between bins. The distribution is further extrapolated to the full range of muon transverse momenta by means of an acceptance correction factor GeV, estimated using the Starlight simulation. The cross section is extracted according to
| (1) |
where is approximated by the dimuon transverse momentum squared , denotes the background-subtracted, unfolded and acceptance-corrected number of signal events in each bin, is the integrated luminosity, and is the width of each bin.
The differential (1S) photoproduction cross section is extracted in four bins of dimuon rapidity according to
| (2) |
where denotes the background-subtracted, unfolded and acceptance-corrected number of signal events in each rapidity bin. The factor describes the ratio of (1S) to (nS) events, is the feed-down contribution to the (1S) events originating from the (2S) decays (where or ), is the branching ratio for muonic decays, and is the width of the bin.
The fraction is used from the results of the inclusive analysis [10]. The feed-down contribution of (2S) decaying to and was estimated as % from the Starlight. The contribution from feed-down of exclusive states was neglected, as these double-pomeron processes are expected to be comparatively much suppressed in proton-nucleus collisions [11, 12].
The systematic uncertainty in the measurement of the exponential slope of the and distribution was considered, which amounts to be 13 and 25, respectively.
6 Results
6.1 Cross section as a function of
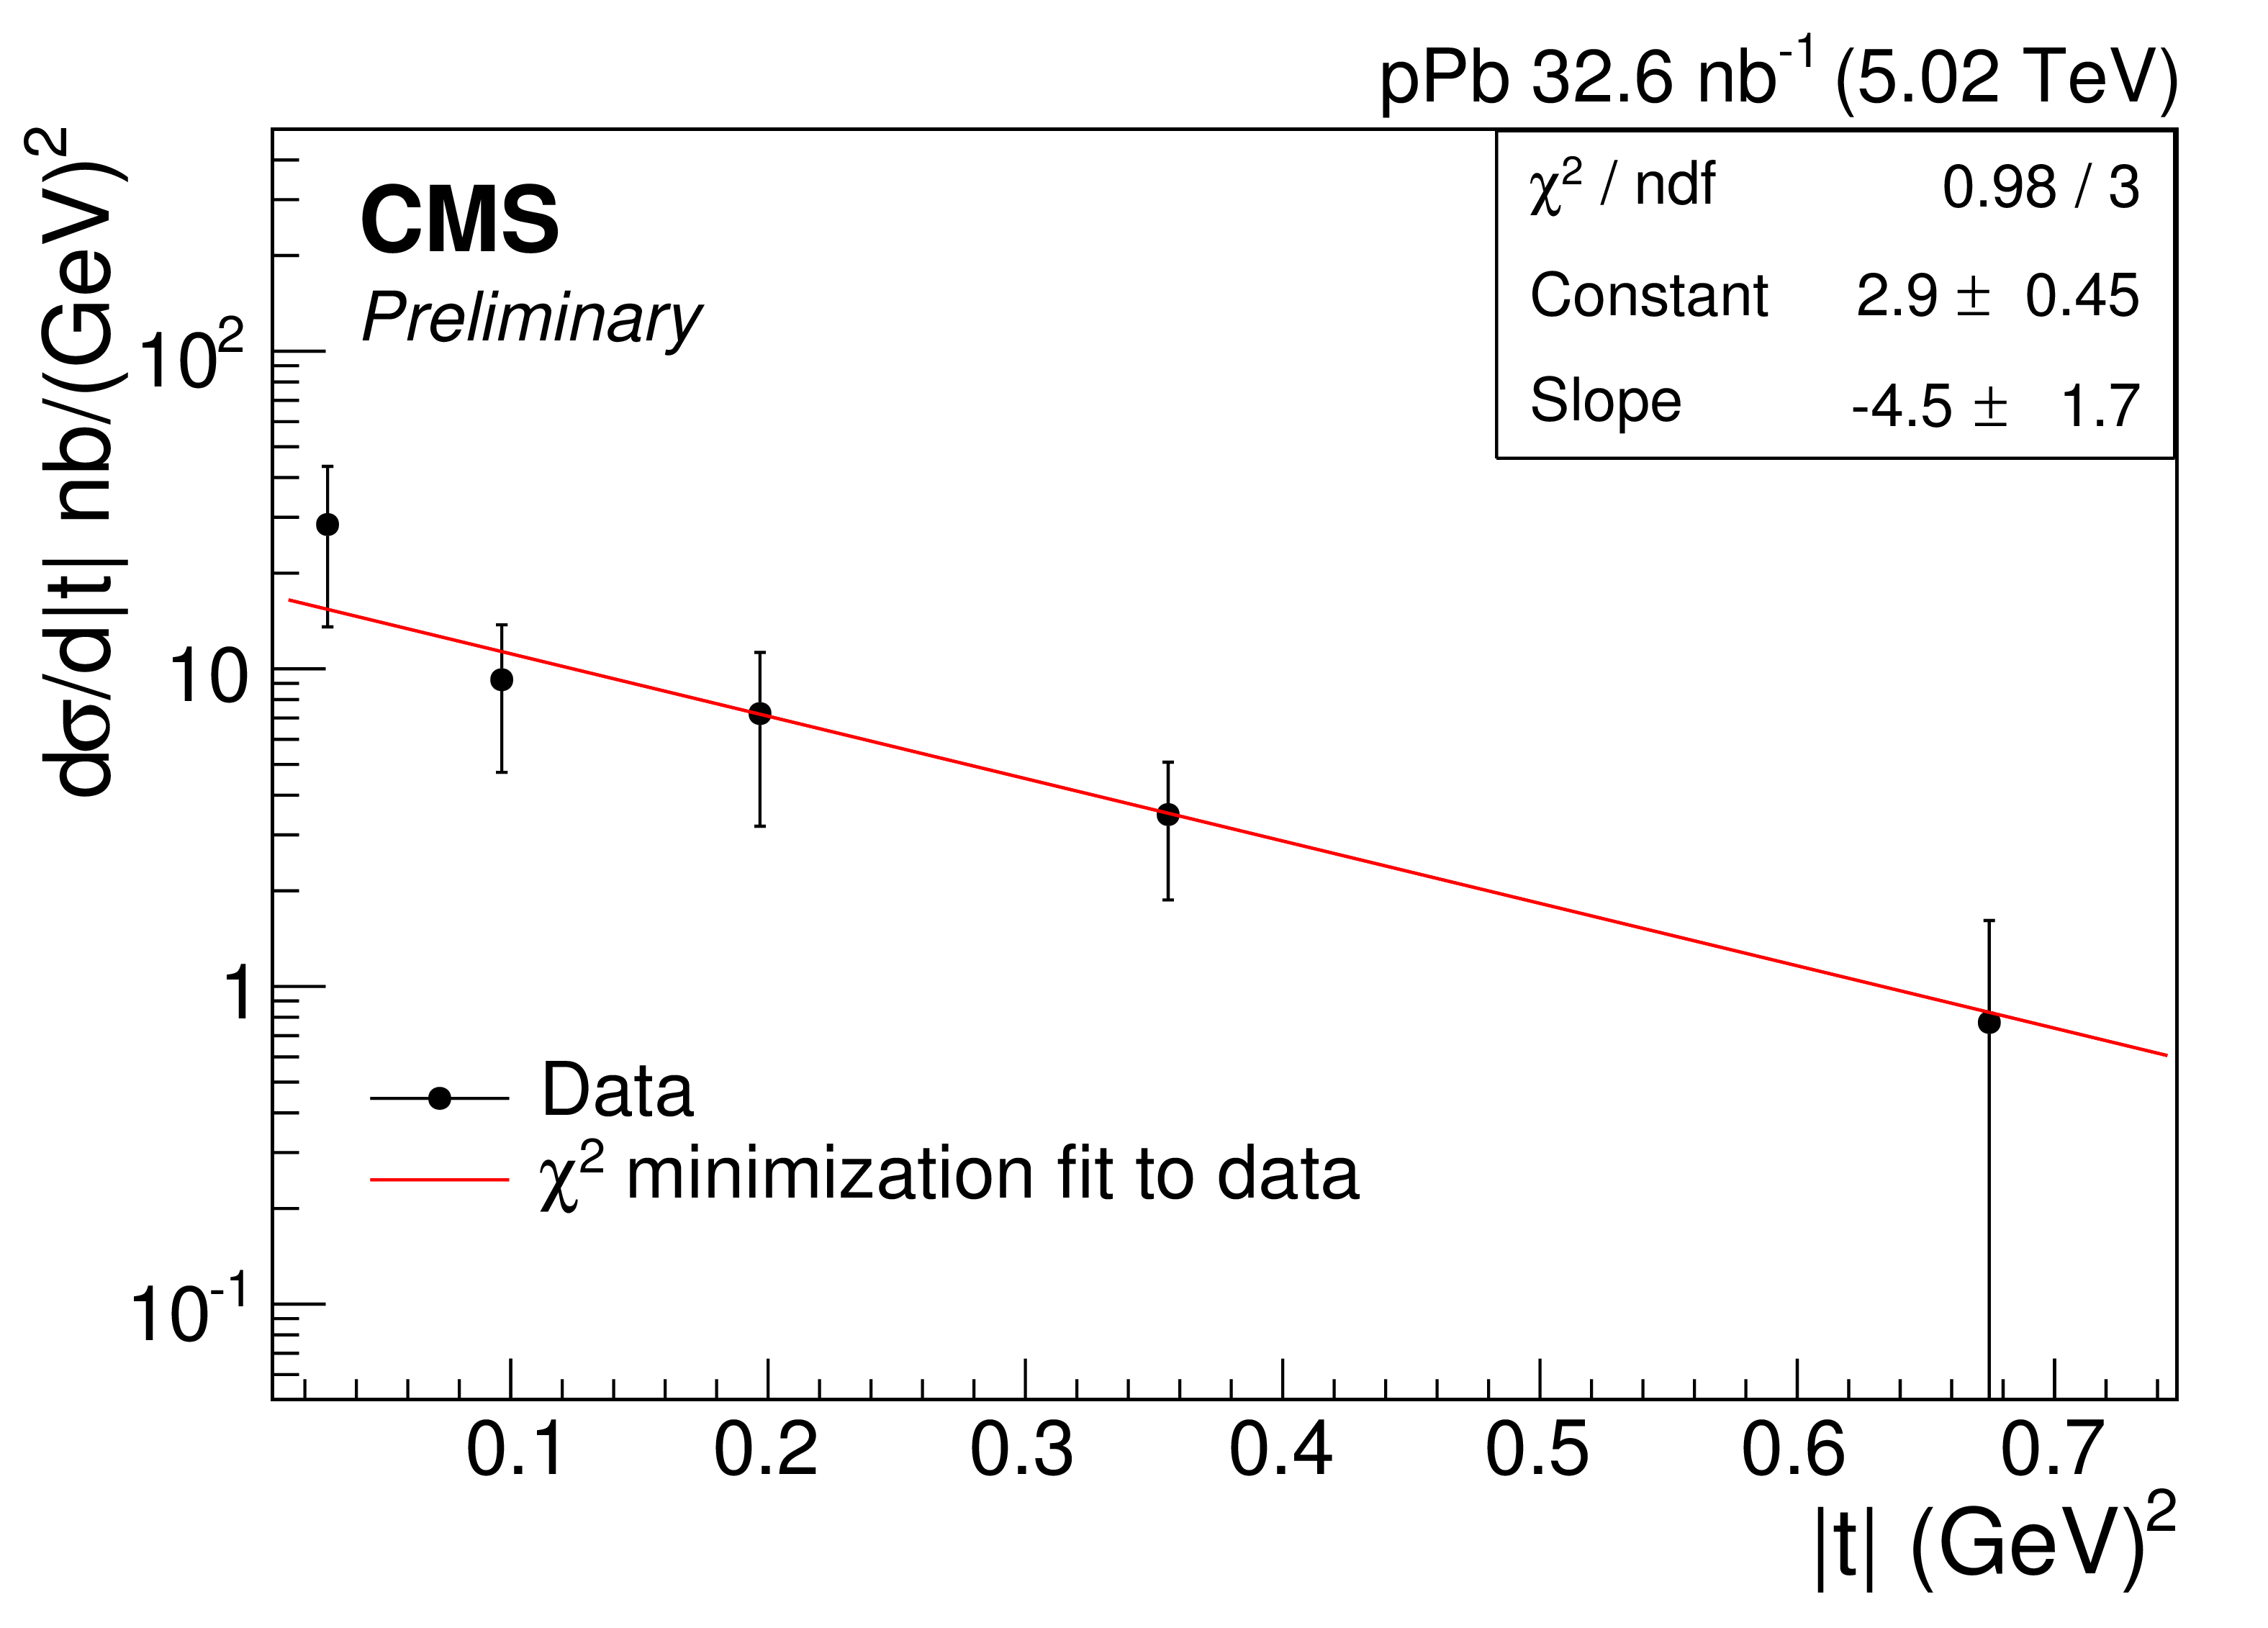
The differential cross section measured in five bins of for , as described in section 5, is shown in Figure 4. The cross section is fitted with an exponential function in the region GeV2, using an unbinned minimization method. A value of (stat) (syst) GeV-2 is extracted from the fit. This result is in agreement with the value (stat) measured by the ZEUS experiment [13] for the photon-proton center-of-mass energy GeV. The measured value of is also consistent with the predictions based on pQCD models [14].
6.2 Cross-section as a function of
The differential cross section is measured in four bins rapidity, as described in section 5, is shown in Figure 5. The exclusive (1S) photoproduction cross section as a function of is obtained by using,
| (3) |
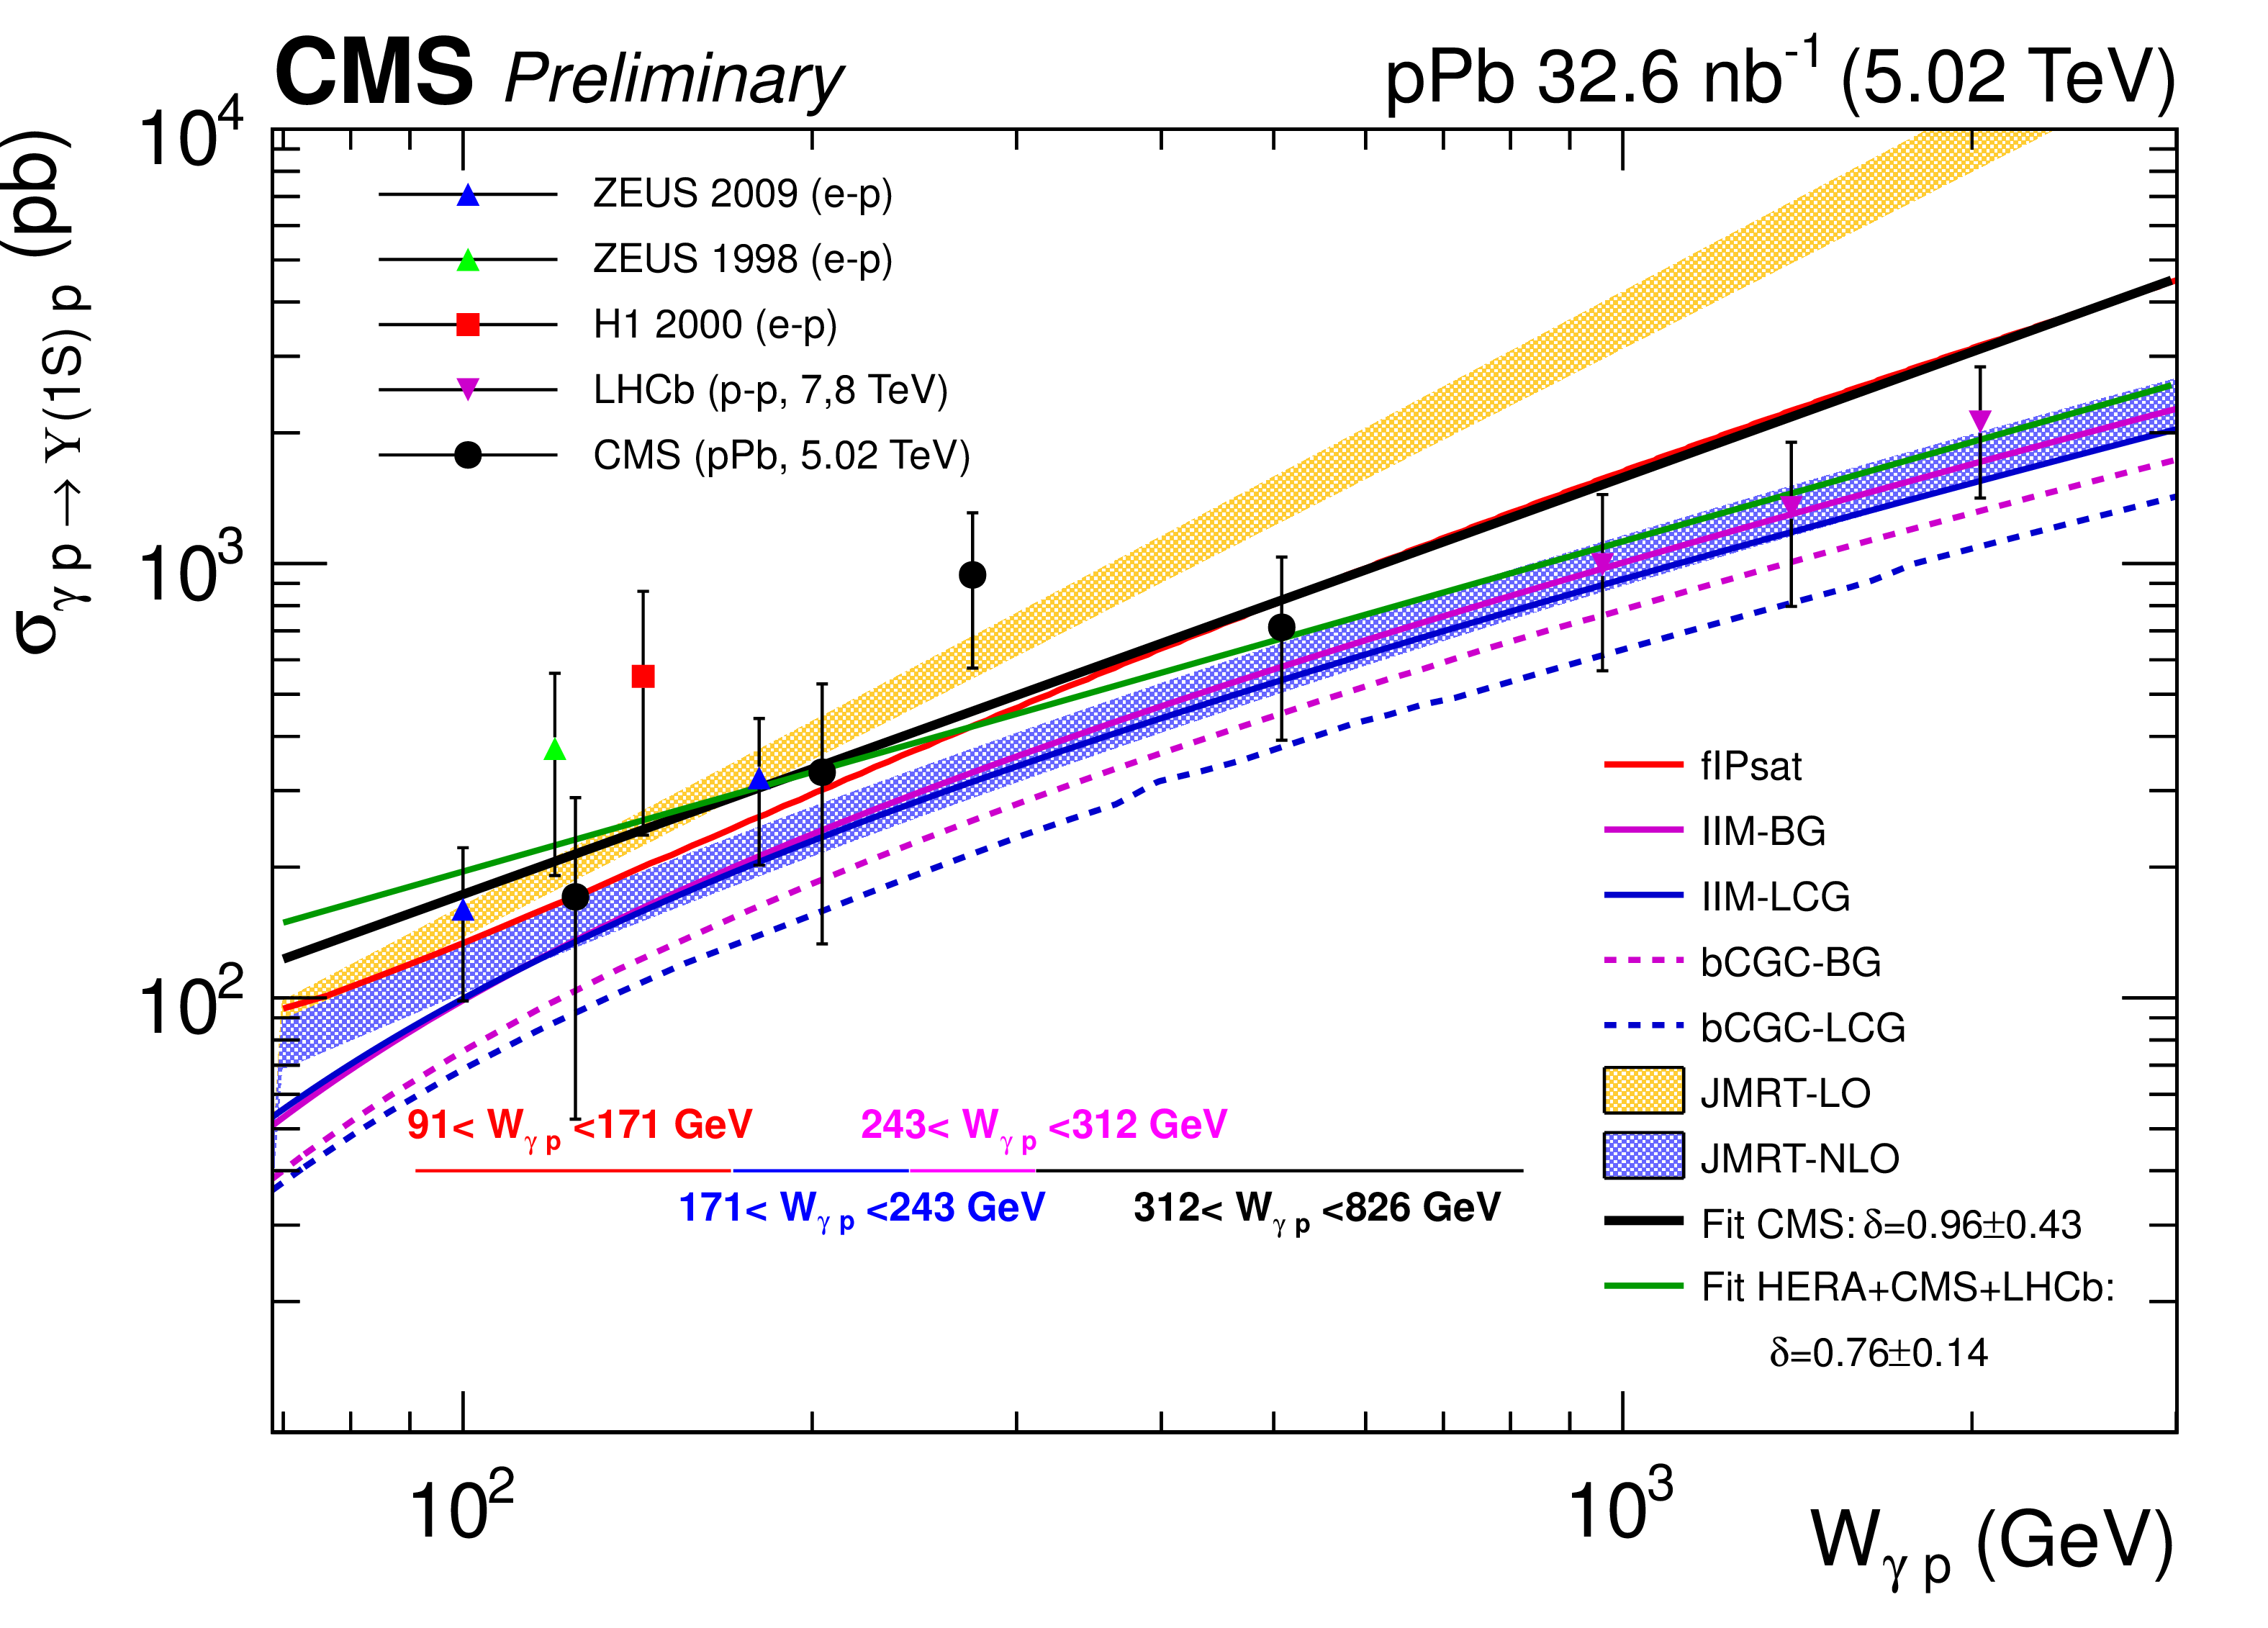
where is the photon flux evaluated at the mean of the rapidity bin, estimated from Starlight. The CMS data are plotted together with the previous measurements from H1 [5], ZEUS [6] and LHCb [2] data. It is also compared with different theoretical predictions of the JMRT model [14], factorized IPsat model [15, 16], IIM [17, 18] and bCGC model [19]. As is proportional to the square of the gluon PDF of the proton and the gluon distribution at low Bjorken is well described by a power law, the cross section will also follow a power law. Any deviation from such trend would indicate different behaviour of gluon density function. We fit a power law with CMS data alone which gives and and is shown by the black solid line. The extracted value is comparable to the value , obtained by ZEUS [6].
7 Summary
We reported the first measurement of the exclusive photoproduction of (1S, 2S, 3S) mesons in the decay modes in ultraperipheral pPb collisions at TeV, using data collected with the CMS detector in 2013, corresponding to an integrated luminosity of nb-1. The exclusive photoproduction cross sections have been measured as a function of the photon-proton center of mass energy in the range GeV, probing the region of parton fractional momenta in the proton –, bridging a previously unexplored region between HERA and LHCb measurements. Our data are compatible with a power law dependence of , disfavouring faster rising predictions of LO pQCD. The differential cross section has been also measured in the range GeV2, and the exponential spectral slope (stat) (syst) GeV-2 has been extracted, in agreement with earlier measurements.
References
- [1] ALICE Collaboration, Phys. Rev. Lett. 113 (2014) 232504.
- [2] LHCb Collaboration, JHEP 09 (2015) 084, arXiv:1505.08139.
- [3] S. R. Klein and J. Nystrand, Phys. Rev. Lett. 92, 142003 (2004).
- [4] ZEUS Collaboration, Phys. Lett. B 708 (2012) 14.
- [5] H1 Collaboration, Eur. Phys. B 46 (2006) 585.
- [6] ZEUS Collaboration, Phys. Lett. B 680 (2009) 4.
- [7] W. Verkerke and D. P. Kirkby, eConf C0303241 (2003) MOLT007, arXiv:physics/0306116.
- [8] J. Beringer et al., “Particle Data Group”, Phys. Rev. D 86 (2012) 010001.
- [9] CMS Collaboration, JINST 3, S08004 (2008).
- [10] CMS Collaboration, JHEP 04 (2014) 103.
- [11] A. J. Schramm and D. H. Reeves, Phys. Rev. D 55 (1997) 7312.
- [12] L. A. Harland-Lang, V. A. Khoze, M. G. Ryskin, and W. J. Stirling, Eur. Phys. J. C 69 (2010) 179.
- [13] ZEUS Collaboration, Phys. Lett. B 708 (2012) 14.
- [14] P. Jones, D. Martin, M. G. Ryskin, and T. Teubner, JHEP 11 (2013) 085.
- [15] T. Lappi and H. Mantysaari, Phys. Rev. C 83 (2011) 065202.
- [16] T. Lappi and H. Mantysaari, Phys. Rev. C 87.
- [17] G. Sampaio dos Santos and M. V. T. Machado, Phys. Rev. C 89 (2014) 025201,(2013) 032201.
- [18] G. Sampaio dos Santos and M. V. T. Machado, J. Phys. G42 (2015) 105001.
- [19] V. P. Goncalves, B. D. Moreira, and F. S. Navarra, Phys. Lett. B 742 (2015) 172.
- [20] CMS Collaboration, FSQ-13-009