High-harmonic generation in -quartz by the electron-hole recombination
Abstract
A calculation of the high-harmonic generation (HHG) in -quartz using the time-dependent density functional theory is reported. The inter-band process is attributed to the dominant in HHG above the band gap. The photon energy is set to 1.55 eV, and the cutoff energy of the plateau region is found to be limited at the 19th harmonic (30 eV). The dependence of the HHG efficiency at the cutoff energy region on laser intensity is consistent with that of the hole density in the lowest-lying valence band. Numerical results indicate that electron-hole recombination plays a crucial role in HHG in -quartz. It is found that a 200 attosecond pulse train is produced using HHG around the plateau cutoff energy.
I introduction
In the last four decades, the highly nonlinear interaction between intense ultrafast laser pulses and various materials has attracted great interest. In particular, high-harmonic generation (HHG) is one of the most important phenomena in laser-matter interactions. HHG from atoms and molecules enables us attosecond light-pulse generation and reveals the tomography of molecular orbitals atto01 ; Itatani04 ; Corkum07 . In general, HHG from atoms and molecules is understood to follow a three-step model: that is, the rescattering process of the emitted electron with the parent ion Corkum93 .
Recently, HHG from dielectrics has been reported Ghimire11 ; Schubert14 ; Luu15 ; Zaks12 ; Huber15 ; Langer15 ; Corkum15 ; Georges16 . Because a bulk crystal is a semi-infinite system, the physical process of HHG in a dielectrics should be different from that in the gas phase. Some theoretical models to describe HHG from bulk crystals have been proposed, including Bloch oscillation Ghimire11 ; Schubert14 ; Luu15 ; Hawkins13 ; Hawkins15 , electron-hole recombinationZaks12 ; Huber15 ; Langer15 ; Corkum15 ; Vampa14 ; Vampa15 ; Georges16 , and Wannier-Stark localization Higuchi14 ).However, further experimental and theoretical investigation is needed to clarify which effect is the dominant process.
Previously, we successfully applied the time-dependent density-functional theory (TDDFT) Runge84 to laser-matter interactionsOtobe08 ; Shino10 ; yabana12 ; Sato14 ; Sato15 ; Otobe16 . We also solved the time-dependent Kohn-Sham (TDKS) equation, which is the fundamental equation of the TDDFT, using the real-time and -space method Bertsch00 . Because our method does not require preparation of the excited states, highly nonlinear processes can be described with relatively low computational cost.
In this paper, we report a density-functional calculation using real-time TDDFT of HHG in -quartz under an intense laser field. We chose -quartz as a suitable target for HHG because its band structure is very simple. The effective mass of the valence band of -quartz is very heavy (), and only the conduction band around the -point has light effective mass (0.3, where is the electron mass) Chelikowsky77 . Therefore, the comparison between the HHG spectrum and band structure of -quartz is straightforward.
II real-time TDDFT calculation
In real-time TDDFT, we described the electron dynamics in a unit cell of a crystalline solid under a spatially uniform electric field . Treating the field with a vector potential, we obtained
| (1) |
We assumed the laser was linearly polarized, and the polarization direction was parallel to the optical axis of -quartz. The electron dynamics were described by the following TDKS equation in atomic units (a.u.):
| (2) |
where is composed of the electron-ion, Hartree, and exchange-correlation potentials. We use a norm-conserving pseudopotential for the electron-ion potential TM91 ; Kleinman82 . In this work we used a modified Becke-Johnson (mBJ) exchange potentialmBJ as given by Eqs. (2)-(4) in Ref. mBJ2 with a local-density approximation (LDA) correlation potential LDA under adiabatic approximation.
The rectangular unit cell containing six silicon atoms and 12 oxygen atoms was discretized into Cartesian grids of . The point group of the crystal structure is P3(2)21. The space was also discretized into grid points. Time evolution was computed using a fourth-order Taylor expansion of the operator. We use a time step of 0.02 a.u. The number of time steps was typically 40,000.
III ground state and linear response of -quartz
Figure 1 (a) shows the imaginary part of the dielectric function () calculated by real-time approach yabana12 with LDA (blue dashed line) and mBJ (red solid line) potentials. mBJ potential gives an optical band gap of 9.2 eV for -quartz agreeing well the experimental value of 9-10 eV. Figure 1 (b) shows the density of states (DoS) as the function of energy from the top of the valence band, which shows the lower band gap ( eV).
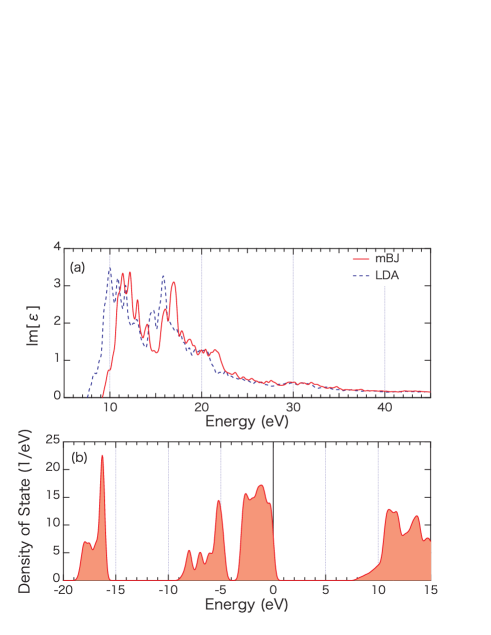
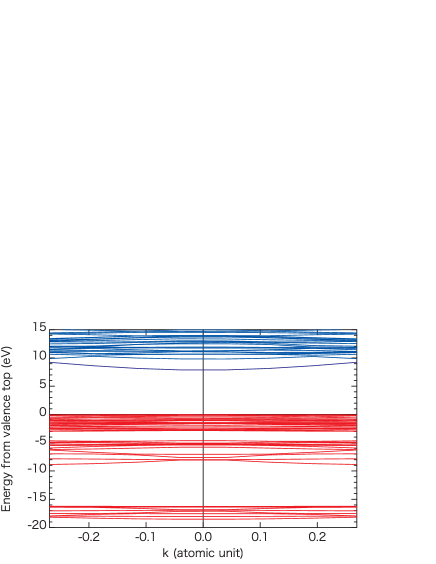
Although our calculation employ the primitive cell, the band map of the ground state may give important information. Figure 2 show the band map along line. Blue (red) lines presents the conduction bands (valence bands). Valence top has very flat structure and heavy effective mass. Therefore the difference between the optical gap (Fig. 1 (a)) and energy gap in DoS (Fig. 1 (b)) is attributed to the dynamical effect in TDDFT.
IV High-harmonic generation in -quartz
IV.1 HHG under few cycle intense laser
The laser electric field was assumed to be,
| (3) |
where is the maximum electric field amplitude and is the laser frequency ( eV). is related to the incident laser field () by , where is the dielectric function at yabana12 . The pulse length was set to be six optical cycles (16.2 fs), and the computation was terminated at (19.4 fs).
An important output of the calculation was the average electric current density as a function of time, , which is given by
| (4) |
where is the volume of the unit cell. is the current produced by the pseudopotential Bertsch00 ; Sato15 . The spectrum of light inside a material can be calculated by the Fourier transformation of the electron current,
| (5) |
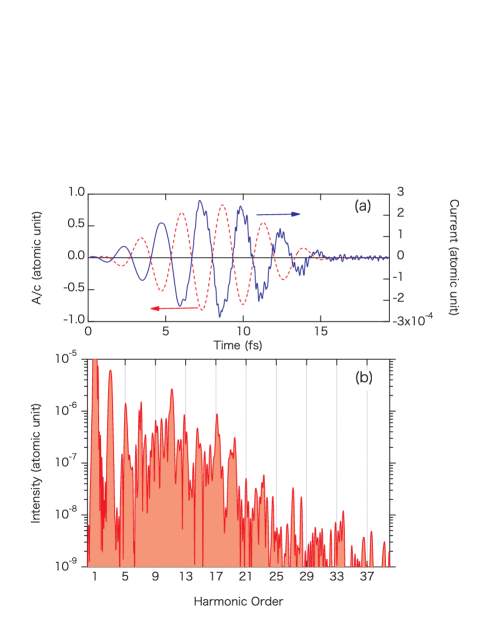
We present the result calculated at the laser intensity of W/cm2 as Fig. 3. The laser intensity is related to the applied electric field by . in the bulk is related to incident intensity by yabana12 . Therefore, W/cm2 is consistent with W/cm2. The red dashed line in Fig. 3 (a) indicates the applied vector potential () with phase in Eq. (3), and the blue solid line is the induced current (J(t)). The intensity of HHG, , is shown in Fig. 3(b). The HHG spectrum is characterized by two relatively intense peaks at 11th harmonic and 17th harmonic.
Previous works on HHG in solids discussed the contribution of the inter-bandZaks12 ; Huber15 ; Langer15 ; Corkum15 ; Vampa14 ; Vampa15 ; Georges16 ; Higuchi14 and intra-bandGhimire11 ; Schubert14 ; Luu15 ; Hawkins13 ; Hawkins15 processes. One possible way to elucidate the physical process is expanding the electron dynamics into inter- and intra-band processes. The time-dependent wavefunctions can be projected to the eigenstates of the time-dependent hamiltonian (),
| (6) |
where the band index runs valence and conduction bands. If we can prepare the complete set of , the current is expanded into intra-band
| (7) | |||||
and inter-band
| (8) | |||||
components exactry. Here is intra- (inter-)comtribution from pseudopotential. The intra-band component is accessible because it dose not depend on the phase of and .
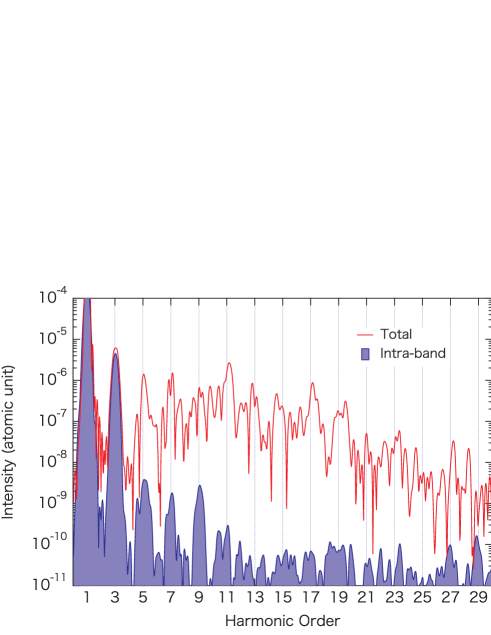
Figure 4 shows the HHG from and at the laser intensity of W/cm2. We assumed 10 conduction bands in this calculation for intra-band process, and calculated the and each 50 time steps, which corresponds to one atomic unit in time.
The HHG spectrum by intra-band process shows relatively good agreement with full calculation at 3rd harmonic. However it drop off at 5th harmonic and the signal decreases to numerical error level above 11th harmonic. Therefore, contribution of the intra-band process can be considered as minor effect and the inter-band process is dominant.
IV.2 Intensity dependence
In previous subsection, we confirm that the inter-band process is dominant in HHG. In this subsection, we would like to explore detail of HHG.
The laser intensity dependence of the integrated HHG spectra,
| (9) |
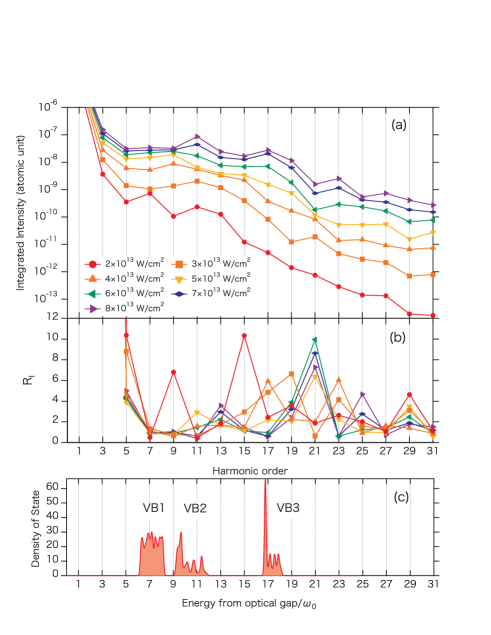
is presented in Fig. 5 (a). From to W/cm2, some peaks appear at different harmonic order, and the spectrum accesses to flat structure (plateau). Above W/cm2, the spectral shape becomes similar.
In most case, the definition of the cutoff energy is difficult because the HHG spectrum in solids dose not drop off clearly like gas phaseLewenstein . Figure 5 (b) presents the relative intensity of each harmonics,
| (10) |
which presents how the -th order harmonic decreases with respect to -th order harmonic. The legend of Fig. 5 (b) is the same as Fig. 5 (a). In this paper, we would like to define the cutoff as the intense single peak in Fig. 5 (b). Above W/cm2, single intense peak can be seen at 21th harmonic. This result indicates that the cutoff is stay at 19th harmonic above W/cm2.
The robustness of the cutoff energy is an important feature, because both the Bloch oscillationGhimire11 ; Luu15 and Wannier-Stark localization Higuchi14 are sensitive to laser intensity. In contrast, the electron-hole recombination model is consistent with our result Georges16 ; Vampa14 ; Vampa15 . In particular, the experimental and theoretical result reported by Ndabashimiye et al. Georges16 suggest that the saturated plateau cutoff corresponds to the recombination between valence and conduction bands in a rare-gas solid.
In general, the velocity of electrons and holes depends on the inverse of the effective mass. In the case of -quartz, the reduced mass (or effective mass of electron) has the smallest value around the -point, which corresponds to the direct band gap as shown in Fig. 2.
The density of states of the valence band for the initial state are presented as a function of the absolute energy from the optical band gap in Fig. 5 (b). We defined the three valence bands as VB1, VB2, and VB3. The band energy was scaled by the photon energy, , to allow comparison with the HHG spectrum. The plateau cutoff energy coincides with the energy of VB3, and the characteristic peaks at the 11th and 17th harmonics for W/cm2 correspond to VB2 and VB3 respectively. These results also indicate that HHG in -quartz can be understood on the basis of the electron-hole recombination process.
We note that the orbital energy in this DFT calculation has less meaning than that of an orbital-dependent theory, such as the Hartree-Fock theory. In our calculation, the direct band gap calculated from the orbital energies is 7.8 eV, which is smaller than the optical band gap of -quartz of 9.2 eV calculated from a real-time simulation (Fig. 2 and Ref. Sato15 ). Therefore, the horizontal axis of Fig. 5(b) has an uncertainty of 10% or 1 eV. This uncertainty is relatively small and does not affect our conclusions.
The relation between the HHG spectrum and hole density of each valence band should be consistent with the recombination process. In previous works, we defined the hole density as the projection of the time-dependent wavefunction at to the initial state given by,
| (11) |
where and are the band indices of orbitals for the initial and time-dependent states, and is the wavefunction of the initial state, Otobe08 . Similarly, the hole density for VB3 is defined as,
| (12) |
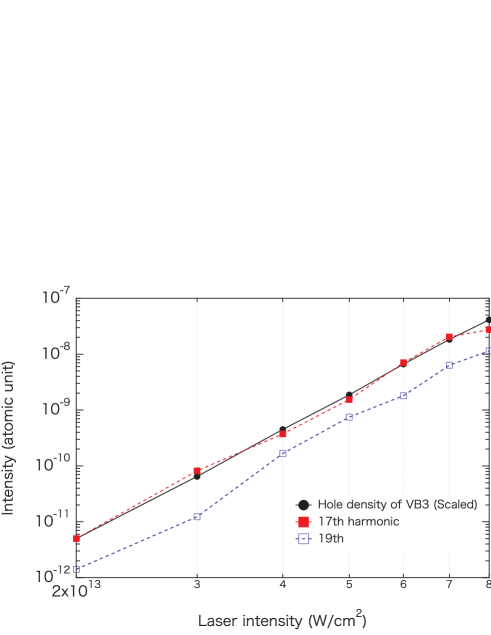
Figure 6 shows the laser-intensity dependence of 17th and 19th harmonics, together with the . We scaled the hole density at W/cm2 to obtain the intensity dependence. The power laws of hole density and harmonic intensity agree very well. This result strongly indicates that the 17th harmonic is caused by the electron-hole recombination in VB3. We also present the results for the 19th harmonic, which is the neighbor of the 17th harmonic in Fig. 6. Because the 17th and 19th harmonics show the same power law, they both correspond to the emission caused by the electron-hole recombination in VB3. It should be noted that the Keldysh parameter Kel65 for VB3 is around one in the present laser intensities. Therefore, the laser-intensity dependence of the hole density is not scaled to the usual power law where is the photon number.
The laser-intensity dependence of lower-order harmonics shows fluctuation and saturation, as illustrated in Fig 5(a). The HHG from different paths interfere, which decrease its overall intensity Hawkins13 ; Hawkins15 . At higher intensity, electron excitation to higher-lying conduction bands becomes substantial. Therefore, the emission from various quantum paths contributes to HHG, which modulates the HHG intensity. For higher harmonics concerning the lowest-lying valence band, the laser intensity is not sufficient to cause such interference with the HHG from VB2 because the energy difference is large ( eV). According to our previous work, at extremely high laser intensities, the -quartz is excited so strongly that the laser-plasma interaction becomes a major process when a near-infrared laser is used Sato15 ; Otobe12 . In other words, HHG around the plateau cutoff is emitted from same quantum path and maintains good coherence in our calculation.
IV.3 Time evolution of HHG
The time evolution of HHG emission () calculated from the time-gated Fourier transformation;
| (13) |
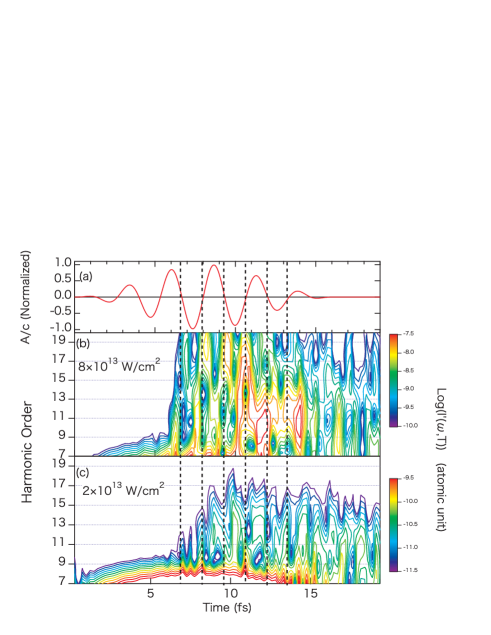
is shown in Fig. 7(b) and (c). Here, we define the parameter as 0.24 fs (ten a.u. ) in Eq. (13). Figure 7(a) is the normalized , and the vertical dashed lines represent the minimum of , which corresponds to the maximum of the electric field. At an intensity of W/cm2, the 9-13th and 15-19th harmonics show almost the same time dependence. In contrast, at a higher intensity of W/cm2, the relative phase of each HHG emission with respect to the laser field shifts between the 9-13th and 15-19th harmonics. In particular, the time dependence of 15-19th harmonics is relatively strong compared with that of the 9-13th harmonics. Because the 9-13th and 17-19th harmonics can be attributed to VB2 and VB3, respectively, from Fig. 5, the relative phase shift also indicates that these two energy region have different quantum paths. The 15th harmonics shows intermediate time-evolution between those of the 9-13th and 17-19th harmonics.
Because the 15-19th harmonics have the same time evolution and quantum paths, their summation is expected to be an ultrafast pulse on the attosecond time scale. The time evolution of the current corresponding to the -th harmonics () from the filtered inverse Fourier transformation is given by,
| (14) |
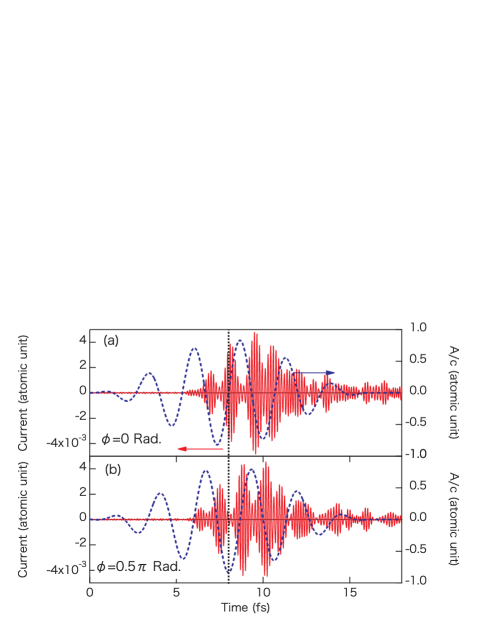
Figure 8(a) depicts the summation of the current for the 15- 19th harmonics (red solid line) and the applied vector potential (blue dashed line) for an intensity of W/cm2. The vertical dotted line indicates the peak of the envelope function of the laser pulse. The 15-19th harmonics show a burst at the minimum vector potential (maximum electric field) and the pulse train has a duration of about 200 attoseconds.
Figure 8(b) displays the case for the . The relative phase of the pulse train with respect to the laser field is unchanged. In the case of , the pulse train has a single maximum peak at 9.5 fs. However, Fig. 8(b) showing contains double maximum peaks . Therefore, the intensity of the pulse train constructed from the cutoff region is the controlled by the phase of the applied incident laser.
V Summary
In summary, we reported a density-functional calculation of the HHG in -quartz under an intense few-cycle pulse laser. Our simulation indicates that the inter-band interaction is the dominant process. We found that the cutoff of the plateau was limited at the 19th harmonic (30 eV), which corresponds to the maximum energy gap between the lowest-lying valence band and the bottom of the conduction band. The power laws of the hole density and the harmonic intensity indicate that the HHG emission in an -quartz is attributable to electron-hole recombination. HHG around the cutoff energy enabled us to generate a pulse train of 200 attoseconds from the solid target because the electron velocity was high at the specific point with a small mass (-point in -quartz).
Acknowledgement
This work was supported by a JSPS KAKENHI (Grants No. 15H03674). Numerical calculations were performed on the supercomputer SGI ICE X at the Japan Atomic Energy Agency (JAEA).
References
- (1) M. Hentschel, R. Klenberger, Ch. Spielmann, G.A. Reider, N. Milosevic, T. Brabec, U. Heinzmann, M. Drescher, and F. Krausz, Nature 414, 509 (2001).
- (2) J. Itatani, J. Levesque, D. Zeidler, H. Niikura, H. Pepin, J. C. Kieffer, P. B. Corkum, and D. M. Villeneuve, Nature 432, 867 (2004).
- (3) P. B. Corkum and Ferenc Krausz, Nature Physics 3, 381 (2007).
- (4) P. B. Corkum, Phys. Rev. Lett. 71, 1994 (1993).
- (5) S. Ghimire, A. D. DiChiara, E. Sistrunk, P. Agostini, L. F. DiMauro and D. A. Reis, Nature Physics 7 138, (2011).
- (6) O. Schubert, M. Hohenleutner, F. Langer, B. Urbanek, C. Lange, U. Huttner, D. Golde, T. Meier, M. Kira, S. W. Koch, and R. Huber, Nat. Photonics 8, 119 (2014)
- (7) T. T. Luu, M. Garg, S. Yu. Kruchinin, A. Moulet, M. Th. Hassan, and E. Goulielmakis, Nature 521 498, (2015).
- (8) B. Zaks, R. B. Liu, and M. S. Sherwin, Nature 483 580, (2012).
- (9) M. Hohenleutner, F. Langer, O. Schubert, M. Knorr, U. Huttner, S. W. Koch, M. Kira, and R. Huber, Nature 523 572, (2015).
- (10) F. Langer, M. Hohenleutner, C. P. Schmid, C. Poellmann, P. Nagler, T. Korn, C. Schuller, M. S. Sherwin, U. Huttner, J. T. Steiner, S. W. Koch, M. Kira, and R. Huber, Nature 533 225, (2016).
- (11) G. Vampa, T. J. Hammond, N. Thire, B. E. Schmidt, F. Legare, C. R. McDonald, T. Brabec, and P. B. Corkum, Nature 522 462, (2015).
- (12) G. Ndabashimiye, S. Ghimire, M. Wu, D. A. Browne, K. J. Schafer, M. B. Gaarde, and D. A. Reis, Nature 534, 520 (2016).
- (13) P. G. Hawkins and M. Y. Ivanov, Phys. Rev. A 87 063842 (2013).
- (14) P. G. Hawkins, M. Y. Ivanov, and V. S. Yakovlev, Phys. Rev. A 91 013405 (2015).
- (15) G. Vampa, C. R. McDonald, G. Orlando, D. D. Klug, P. B. Corkum, and T. Brabec, Phys. Rev. Lett. 113 073901 (2014).
- (16) G. Vampa, C. R. McDonald, G. Orlando, P. B. Corkum, and T. Brabec, Phys. Rev. B 91 064302 (2015).
- (17) T. Higuchi, M. I. Stockman, and P. Hommelhoff, Phys. Rev. Lett. 113 213901, (2014).
- (18) E. Runge and E. K. U. Gross, Phys.Rev. Lett. 52, 997 (1984).
- (19) T. Otobe, M. Yamagiwa, J. -I. Iwata, K. Yabana, T. Nakatsukasa, and G. F. Bertsch, Phys. Rev. B77, 165104 (2008).
- (20) Y. Shinohara, K. Yabana, Y. Kawashita, J.-I. Iwata, T. Otobe , and George F. Bertsch, Phys. Rev. B 82, 155110 (2010).
- (21) K. Yabana, T. Sugiyama, Y. Shinohara, T. Otobe, and G. F. Bertsch, Phys. Rev. B 85, 045134 (2012).
- (22) S. A. Sato, K. Yabana, Y. Shinohara, T. Otobe, G.F. Bertsch, Phys. Rev. B89, 064304 (2014).
- (23) S. A. Sato, K. Yabana, Y. Shinohara, T. Otobe,K.-M. Lee, and G.F. Bertsch, Phys. Rev. B 92 205413 (2015).
- (24) T. Otobe, Y. Shinohara, S. A. Sato, and K. Yabana, Phys. Rev. B 93, 045124 (2016).
- (25) G.F. Bertsch, J.-I. Iwata, A. Rubio, and K. Yabana, Phys. Rev. B 62 , 7998 (2000).
- (26) J. R. Chelikowsky and M. Schluter, Phys. Rev. B 15, 4020 (1977).
- (27) N. Troullier and J.L. Martins, Phys. Rev. B43, 1993 (1991).
- (28) L. Kleinman and D. M. Bylander, Phys. Rev. Lett. 48, 1425 (1982).
- (29) A. D. Becke and E. R. Johnson, J. Chem. Phys. 124 221101 (2006).
- (30) F. Tran and P. Blaha, Phys. Rev. Lett. 102, 226401 (2009).
- (31) J. P. Perdew and Y. Wang, Phys. Rev. B 45, 13244 (1992).
- (32) M. Lewenstein, Ph. Balcou, M. Yu. Ivanov, Anne L’Huillier, and P. B. Corkum, Phys. Rev. A 49, 2117 (1994).
- (33) L.V. Keldysh, Sov. Phys. JETP 20, 1307 (1965).
- (34) S. L. Chin, Advances in Multiphoton Processes and Spectroscopy, (World Scientific, Singapore 2004), Chapter 3 .
- (35) T. Otobe, Appli. Phys. Lett. 111, 093112 (2012).