11email: pohl@mpia.de 22institutetext: Heidelberg University, Institute of Theoretical Astrophysics, Albert-Ueberle-Str. 2, D-69120 Heidelberg, Germany 33institutetext: National Astronomical Observatory of Japan, Mitaka, Tokyo 181-8588, Japan 44institutetext: Leiden Observatory, Leiden University, P.O. Box 9513, NL-2300 RA Leiden, The Netherlands
Investigating dust trapping in transition disks with millimeter-wave polarization
Abstract
Context. Spatially resolved polarized (sub-)mm emission has been observed for example in the protoplanetary disk around HL Tau. Magnetically aligned grains are commonly interpreted as the source of polarization. However, self-scattering by large dust grains with a high enough albedo is another polarization mechanism, becoming a compelling method independent of the spectral index to constrain the dust grain size in protoplanetary disks.
Aims. We study the dust polarization at mm wavelength in the dust trapping scenario proposed for transition disks, when a giant planet opens a gap in the disk. We investigate the characteristic polarization patterns and their dependence on disk inclination, dust size evolution, planet position, and observing wavelength.
Methods. We combine two-dimensional hydrodynamical simulations of planet-disk interactions with self-consistent dust growth models. These size-dependent dust density distributions are used for follow-up three-dimensional radiative transfer calculations to predict the polarization degree at ALMA bands due to scattered thermal emission.
Results. Dust self-scattering has been proven to be a viable mechanism for producing polarized mm-wave radiation. We find that the polarization pattern of a disk with a planetary gap after 1 Myr of dust evolution shows a distinctive three ring structure. Two narrow inner rings are located at the planet gap edges. A third wider ring of polarization is situated in the outer disk beyond 100 au. For increasing observing wavelengths all three rings slightly change their position, where the innermost and outermost rings move inward. This distance is detectable comparing the results at ALMA bands 3, 6 and 7. Within the highest polarized intensity regions the polarization vectors are oriented in the azimuthal direction. For an inclined disk there is an interplay between polarization originating from a flux gradient and inclination-induced quadrupole polarization. For intermediate inclined transition disks the polarization degree is as high as at mm (band 3), which is well above the detection limit of future ALMA observations.
Key Words.:
Protoplanetary disks – Planet-disk interactions – Radiative transfer – Polarization – Scattering1 Introduction
To investigate dust coagulation and ongoing planet formation processes observational constraints on the size of grains embedded in a protoplanetary disk are crucial. Observations at millimeter (mm) wavelengths have probed large (mm sized) grains in the disk midplane, through calculation of a low spectral index of the dust opacity (e.g. Beckwith & Sargent 1991; Testi et al. 2001; Rodmann et al. 2006; Ricci et al. 2010a, b; Guilloteau et al. 2011). For a continuous disk with a monotonically decreasing radial gas pressure, mm dust particles in the outer disk can experience an excessive radial drift towards the star, in contradiction to observations that revealed the existence of mm sized particles in the outer disk regions (Wilner et al. 2005; Andrews & Williams 2005; Ricci et al. 2010b, 2011). A particle trap caused by a pressure bump might be a solution to prevent this drift problem and to allow the grains to grow efficiently (Whipple 1972; Klahr & Henning 1997; Fromang & Nelson 2005; Johansen et al. 2009; Pinilla et al. 2012b; Zhu et al. 2012). This bump can for example result from the presence of a massive planet carving a gap in the gas density. Hence, so-called transition disks characterized by large radial gaps are excellent targets to study the impact of planet formation on the disk structure. To explain pronounced dust rings in protoplanetary disks there are certainly also other mechanisms, such as the generation of gaps at the dead-zone edges in magnetized disks without any planet (Flock et al. 2015). Particle trapping can be probed by measuring low spectral index values inside the trap, however, small opacity index values could be also explained by optically thick emission from compact regions (Ricci et al. 2012). Among other uncertainties, such as the composition and porosity of dust aggregates (Henning & Stognienko 1996; Kataoka et al. 2014), this shows that constraining the grain size only with opacity index measurements is still problematic.
Recently, Kataoka et al. (2015) introduced an alternative, independent method to constrain the grain size distribution in protoplanetary disks based on dust polarization at mm wavelengths. The classical picture from the optical and near-infrared (NIR), where stellar photons are scattered by small dust in the disk surface layers, is transferred to dust self-scattering111Self-scattering means that the source of incident radiation is the thermal emission of the dust itself, which is then scattered off large dust grains resulting in polarized mm disk emission. in the mm wavelength regime. As mentioned above, it is known that dust grains in protoplanetary disks can grow to sizes comparable to mm wavelengths, meaning that they are expected to have a large albedo and thus, can produce scattered light. When the radiation field is anisotropic, the continuum emission is expected to be partially polarized due to self-scattering of dust thermal emission. So far, polarized (sub-)mm emission has been observed in the disks around a few young stellar objects, e.g. IRAS 16293-2422B (Tamura et al. 1995; Rao et al. 2014), HL Tau (Tamura et al. 1995; Stephens et al. 2014), DG Tau (Tamura et al. 1999; Hughes et al. 2013), MWC 480 (Hughes et al. 2013), and L1527 (Segura-Cox et al. 2015). Commonly, magnetically aligned grains (see e.g. Lazarian 2007) are assumed as the source of polarization, but dust self-scattering is another important mechanism that needs to be considered. This idea has been explicitly applied to the protoplanetary disk around HL Tau by Kataoka et al. (2016) and Yang et al. (2016), who successfully reproduced the polarization signatures observed by means of scattered mm radiation.
In this paper we study the dust trapping scenario when a massive planet is embedded in the disk, and investigate where polarization due to scattering can be detected. We combine 2D hydrodynamical simulations of planet-disk interactions with self-consistent dust growth models (cf. Pinilla et al. 2012a; de Juan Ovelar et al. 2013). These results are used to perform 3D radiative transfer calculations in order to predict the polarization at ALMA wavelengths due to scattered thermal emission. In difference to Kataoka et al. (2015), we consider the simulated spatial dust density distribution for each grain size from the dust evolution model instead of a parametrized dust density and a simplified power law grain size distribution. We compare our results for different dust evolution timescales and analyze the dependence of the polarization degree on the disk inclination, dust composition, planet’s position and observing wavelength. Moreover, it is discussed whether the polarization is detectable with future ALMA observations.
This paper is organized as follows. In Sect. 2 we describe the numerical methods to obtain a transition disk model and the radiative transfer calculations. Section 3 presents our results of the dust growth modeling and the simulated polarization maps. Furthermore, we discuss our findings in terms of disk inclination, dust evolution timescales, dust composition, planet’s position and observing wavelength. Finally, our results and the conclusions of this work are summarized in Sect. 4.
2 Numerical methods
Our numerical models start with performing hydrodynamical simulations of planet-disk interactions followed by self-consistent dust growth models, based on the setup from Pinilla et al. (2012a), also used in de Juan Ovelar et al. (2013). The resulting dust distributions after different evolution times are taken as input for radiative transfer calculations with the Monte-Carlo based radiative transfer code radmc-3d222The code and more information is available on http://www.ita.uni-heidelberg.de/dullemond/software/radmc-3d/.. The details of the individual simulation steps are presented in the following Sects. 2.1 and 2.2.
2.1 Planet-disk interaction and dust evolution models
The two-dimensional hydrodynamical grid code fargo (Masset 2000) is used to simulate the planet-disk interaction processes. The parameters are similar to the models in Pinilla et al. (2012a) and can be found in Table 1. The basic model consists of a viscous disk with and an embedded massive planet with a planet-to-star mass ratio of located on a fixed orbital radius at 20 au or 60 au, respectively. Our choice for the value is motivated by recent results from de Juan Ovelar et al. (2016), who constrained to be within an order of magnitude of in order to reproduce the observed structures in transition disks. The radial grid with is logarithmically spaced between 0.5 and 140 au, while the azimuthal grid considers uniformly distributed cells. Furthermore, a surface density profile of is chosen, such that the disk mass corresponds to . The hydrodynamical simulations are run for about 1000 planetary orbits until the disk gas surface density has reached a quasi-stationary state.
In the next step, the final gas surface density is azimuthally averaged, interpolated to a radial grid of 300 cells, and used as initial condition for the 1D dust evolution code from Birnstiel et al. (2010). Since we are only interested in the radial dust distribution, this simplification is adequate. The code computes the coagulation and fragmentation of dust grains due to radial drift, turbulent mixing and gas drag. The gas surface density is kept constant during the dust evolution on simulation timescales of a few million years. This is justifiable because the gap opening timescale is much shorter compared to the dust evolution processes. As initial conditions a dust-to-gas ratio of 0.01 with an initial particle size of m and an intrinsic dust volume density of are assumed. The fragmentation velocity is considered to be . Stellar parameters typical for those of T Tauri stars (K, M⊙, R⊙) are assumed. The dust grain distribution depends on the grain size , the distance to the star and the height above the midplane . For its description the vertically integrated dust surface density distribution is used, since the coagulation processes are concentrated in the disk midplane. The vertically integrated dust surface density distribution per logarithmic bin of grain radius is defined as (see Birnstiel et al. 2010)
| (1) |
with being the mass of a single particle of size .
The dust coagulation simulations consider 180 different particle sizes from micron size up to two meters. Since the density of grains larger than 10 cm is very small and their contribution to the emitted and scattered light is negligible, the grain size and density distributions are binned such that 140 grains with a maximum size of 7 cm are taken into account for further calculations.
| Parameter | Variable | Value |
|---|---|---|
| Inner disk radius | 0.5 au | |
| Outer disk radius | 140 au | |
| # of radial grid cells | 512 | |
| # of azimuthal grid cells | 1024 | |
| -viscosity | 10-3 | |
| Surface density at | ||
| Surface density index | -1 | |
| Star temperature | 4730 K | |
| Star mass | 1.0 | |
| Star radius | 1.7 | |
| Planet-to-star mass ratio | ||
| Planet position | ||
| Fragmentation velocity | 1000 cm/s | |
| Solid density of dust particles | 1.2 g/cm3 | |
| # of photons for RT | ||
| Observer distance | 140 pc | |
| Disk inclination |
2.2 Radiative transfer calculations
In order to calculate intensity and polarized intensity images of our transition disk model, the radiative transfer code radmc-3d is used. The code is frequently applied to compare theoretical disk models with observations or to make observational predictions (see recent studies from e.g. Marino et al. 2015; Casassus et al. 2015; Kataoka et al. 2015; Juhász et al. 2015; Pohl et al. 2015). In addition, Kataoka et al. (2015) confirmed the validity of the polarization calculations of radmc-3d with a benchmark test proposed by Pinte et al. (2009). Intensity images and polarization maps in this paper are simulated with photon packages. The linear polarization degree can be calculated with . The radiative transfer calculations require a radiation source, which has typical stellar parameters of a T Tauri star (see Table 1), where a black body radiation field is assumed for simplicity. Furthermore, the results of the dust evolution models are taken as input, i.e. the corresponding dust density for each grain size extracted from the distribution , which was previously introduced in Sect. 2.1 and described in more detail in Sect. 3.1. The vertical density profile is assumed to be Gaussian, so that the dust volume density is given by
| (2) |
where and refer to spherical coordinates and can be converted into cylindrical ones via and , and describes the polar angle. The value of the dust scale height is grain size dependent, since the effect of dust settling is included. Large enough dust grains are decoupled from the gas and settle down to the midplane. Following Youdin & Lithwick (2007) and Birnstiel et al. (2010) the dust scale height can be estimated by
| (3) |
where is the viscous parameter, is the gas scale height and corresponds to the Stokes number. The latter is a dimensionless coupling constant which describes how well the dust particles couple to the gas. Our study focuses on the so-called Epstein regime, where the molecular hydrogen mean free path divided by the particle size is . In this case the Stokes number at the midplane is given by (Birnstiel et al. 2010)
| (4) |
where denotes the gas surface density.
2.2.1 Opacity calculation
For the opacity calculation we use Mie theory considering the BHMIE code of Bohren & Huffman (1984) which assumes the dust grains to be spherically symmetric. The dust composition consists of a mixture between silicate (Draine 2003), carbonaceous material (Zubko et al. 1996) and water ice (Warren & Brandt 2008), consistent with Ricci et al. (2010b), who considered the bulk densities from Pollack et al. (1994). The fractional abundances are taken as 7%, 21% and 42% so that the amount of vacuum is 30%. The opacity of the mixture is determined by means of the Bruggeman mixing theory. The absorption and scattering opacities, and , as well as the scattering matrix elements are calculated. Here, the notation of the radmc-3d code is used, which is related to the notation from Bohren & Huffman (1984) by , with being the wave number. Taking the angular integral of the matrix element gives the scattering opacity,
| (5) |
where . Similarly, the anisotropy factor is given by the following integration
| (6) |
As already mentioned in Sect. 2.1, 140 different grain sizes are considered. For the scattering phase function represented by as a function of scattering angle Mie theory produces very strong oscillations if the wavelength of the incoming radiation is very small compared to the grain size. Therefore, a grain size distribution between two neighboring grain size bins is applied with a MRN powerlaw index of -3.5 (Mathis et al. 1977). This averaging smears out the wiggles, giving more manageable opacity values. Furthermore, to avoid problems with the spatial resolution of our models, we define a cut-off value for setting an upper limit for the forward peaking of the phase function. This means that for very small scattering angles is set to a constant (typically to the value it has at 5 deg). This is reasonable since such low scattering angles are not relevant for our analysis of mostly highly inclined disks.
The polarization by dust scattering is strongly dependent on the scattering angle, grain size and wavelength. Therefore, in order to determine an effective polarization degree , effective scattering matrix elements and have to be derived. In our case this is done by weighting the individual elements and by the corresponding dust density distribution at a specific radial position . More precisely, we obtain
| (7) |
so that the effective polarization degree is determined by
| (8) |


2.2.2 Temperature profile
Since we are only interested in the scattering, for simplicity we assume that the dust temperatures are the same for all grain species. Thus, for the dust temperature profile of the disk a power-law distribution is adopted,
| (9) |
where is set to 65 K, is equal to 20 au and the flaring index corresponds to 0.25. The parameters are chosen such that they coincide with those of the hydrodynamical FARGO simulations and are in agreement with the disk geometry found in observations of T Tauri disks (e.g. D’Alessio et al. 2001).
3 Results
3.1 Gas and dust density distribution
Figure 1 illustrates the azimuthally averaged gas surface density profile after 1000 orbits of evolution of the planet-disk interaction processes. The embedded planet with a planet-to-star mass ratio of (1 Mjup for our case) is located on a fixed circular orbit at 60 au in a flared, viscous () disk. A pronounced gap is opened by the planet, whereas its width is constrained by the planet mass. The presence of the planet generates a pressure bump in the otherwise monotonically decreasing pressure distribution (see Pinilla et al. 2012a for detailed discussion). The vertically integrated dust density distribution (cf. Eq. 1) for three different times of dust evolution (0.1, 1.0 and 3.0 Myr) is shown in Fig. 2. As we noticed for the gas density, the planet also clearly carves a gap in the dust influencing the distribution of dust particle sizes in the inner and outer disk. Large dust grains of mm-size are trapped at the pressure maximum, which is located at a larger radius than the gap edge in the gas density. Smaller, micron-sized particles can pass the pressure maximum and radially drift to the inner disk region. Dust particles in the outer regions of the disk grow until they reach a size of mm and remain there several million years. Additionally, the result of a comparison simulation without any planet after 1 Myr of dust evolution in the disk is shown in Fig. 3. In this case no pressure bump is created, instead the dust just grows, fragments and drifts towards the star without building any accumulation of mm-sized grains in the outer disk regions.

3.2 Analysis of polarization maps

As shown in Kataoka et al. (2015) even without a specific central light source, the continuum emission is polarized due to self-scattering if the dust emission exhibits quadrupole anisotropy at certain positions in the disk. In this section we investigate the characteristic polarization pattern for a transition disk and discuss the detection possibility with current (sub-)mm observations. The basic polarization mechanism is explained in Sect. 3.2.1 by means of a reference face-on disk model. The effects on the polarization of disk inclination, observing wavelength, dust size evolution, dust composition and presence of the planet are studied in Sects. 3.2.2–3.2.6.
3.2.1 Reference simulation
As a reference simulation we define the case of a planet with planet-to-star mass ratio of located at 60 au taking the dust evolution of the disk after 1 Myr and an opacity mixture as described in Sect. 2.2.1. By means of radmc-3d we calculate intensity and polarized intensity images at a reference wavelength of mm (ALMA band 7) considering anisotropic scattering with polarization. Figure 4 displays the Stokes intensity, polarized intensity , and polarization degree with overlaying polarization vectors for a face-on disk with respect to the line-of-sight. The intensity image reveals the structure of the transition disk, such that around the planet’s position a gap is detected. As explained in the previous Sect. 3.1, mm grains are trapped in the pressure maximum at au and generate the bright emission ring at that location.


Polarization generally depends on the observing wavelength, grain size and scattering angle. For small, micrometer-sized particles the scattering opacity is much smaller than the absorption opacity in the mm. Scattering at mm wavelength becomes efficient if the dust grains are as large as a few hundred micrometers. In addition, there is also an upper grain size limit for significant polarization due to scattering. As discussed in Kataoka et al. (2015) the maximum grain size that is responsible for producing polarization is determined by . This is illustrated by the horizontal dashed lines in Figs. 2 and 3. If grains larger than that size are present at a certain location in the disk, no polarization is expected. To distinguish between different scattering regimes, the size parameter is important (Bohren & Huffman 1984). For the Rayleigh scattering regime with , i.e. for the grain size being smaller than the wavelength, the polarization curve as a function of scattering angle is symmetric and features a peak at . This can be clearly seen in Fig. 6 for most disk locations for a wavelength of 0.87 mm. One also recognizes that for certain radii where mm/cm grains dominate, e.g. at the pressure bump region around 90 au (yellow line) and in the very inner disk at 20 au (black line), there is a sign flip in the polarization, which is known as polarization reversal (Daniel 1980; Fischer et al. 1994; Kirchschlager & Wolf 2014). This generally influences the orientation of the polarization vectors. However, effects of negative polarization are not expected in our simulations since the absolute polarization values are quite small at those positions in the disk where negative polarization occurs.
The polarization map in the right panel of Fig. 4 shows a three ring structure. These features are unique for the polarization due to dust self-scattering in a transition disk hosting a gap and pressure bump caused by a giant planet. The rings’ positions coincide with those locations of the disk where the dust grains have a maximum size of m for mm. This can be verified by looking at the dashed blue line in the center panel of Fig. 2 and counting the crossing points/regions for which this condition is fulfilled. This is the case just around the gap and in the outer disk beyond the pressure bump, illustrated also in Fig. 5. The third ring is wider in the radial dimension because the suitable maximum grain size is met for the whole outer part au. We note that the high polarization degree is unaffected by the disk boundaries, proven by a model with an extended disk radius of 300 au instead of 140 au. At the location of the pressure bump big cm and mm grains (m), which do not produce polarization, are present as well. Although the polarized intensity is not zero, since there are particles with a suitable size for polarization, the amount of unpolarized intensity is high. Hence, the ratio of polarized to unpolarized radiation is tiny and no polarization is expected in that region. Another important prerequisite to have such a significantly polarization degree is that the radiation field has a strong gradient field. Thus, the third ring has the highest polarization degree since it is located outside of the bright intensity ring. The dominant photon source for the outer disk is determined by the thermal emission from this intensity peak.
The two inner rings are inside of the bright emission ring. For the innermost ring, it is expected that the incident radiation originates primarily from the very inner disk acting as a point source. The polarization vectors in all rings are orientated in azimuthal direction for this face-on disk. Two effects play an important role here, the propagation direction of incident photons and the sign of the polarization. Most of the incident photons for the last scattering come from the inner disk or emission from the ring region and therefore, propagate radially outwards. Thus, assuming that we are in the Rayleigh scattering regime and hence there is no polarization reversal, the radiation is azimuthally polarized.
It should be emphasized that if the amount of polarized intensity is too low, no polarization can be detected, even if the polarization degree itself were high. Since the polarized intensity is highest around 85 au, the second and third polarization ring might be observationally most important. The width of the bright emission ring in PI is au, which defines the minimum spatial resolution needed to resolve the ring structure.
3.2.2 Effect of disk inclination
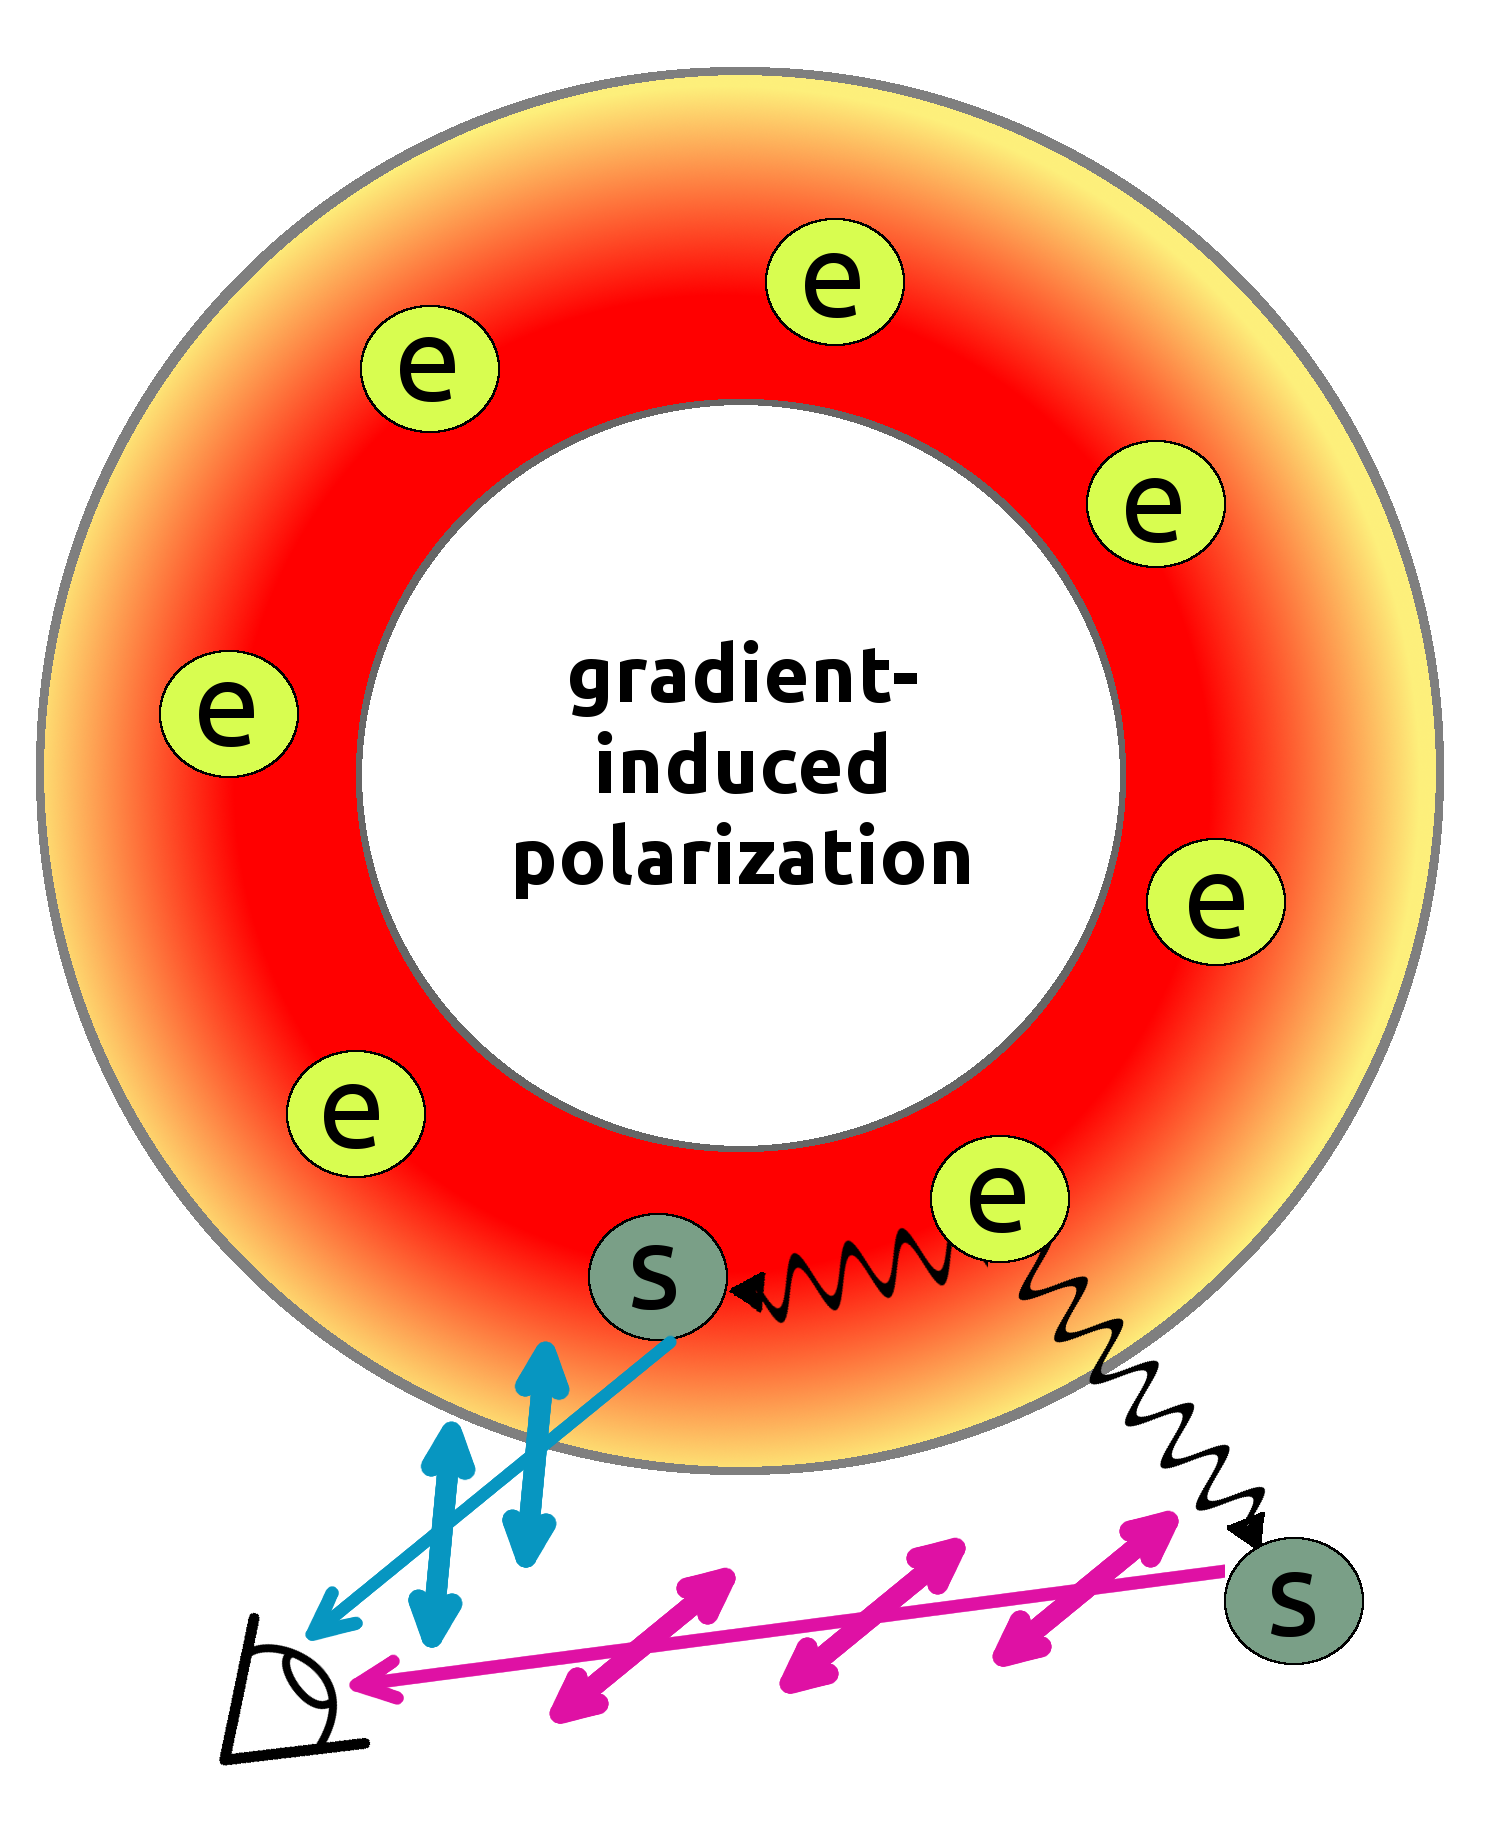
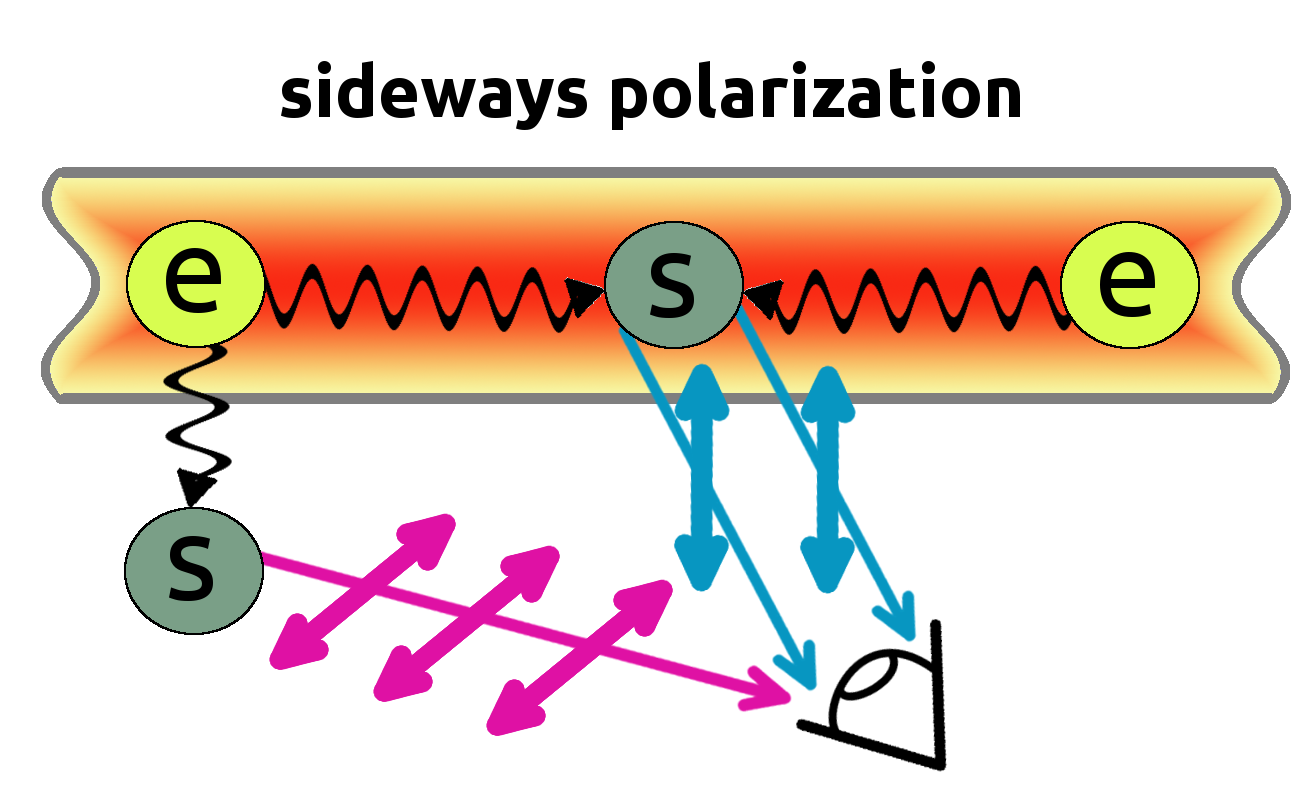
Figure 7 shows polarization maps for different disk inclinations (20∘, 40∘, 60∘ and 90∘) with respect to the observer. All other simulation parameters are the same as in the reference model presented in Sect. 3.2.1 and displayed in Fig. 4. The general polarization degree structure, i.e. the number and position of the rings, stays the same, since the dust density distribution has not been changed. Nonetheless, the amount of polarization and the orientation of the polarization vectors drastically changes. In the previous Sect. 3.2.1 we show that a high polarization degree for a face-on disk is linked to a strong flux gradient, which causes the polarization vectors to be azimuthally orientated. In the following this mechanism is referred to as gradient-induced polarization. For an inclined disk there is an interplay between this effect and inclination-induced quadrupole polarization, in the following called sideways polarization. Both polarization mechanisms are sketched in Fig. 8.
In an inclined disk the light coming from a direction along the major axis is scattered by 90∘ and therefore fully polarized along the minor axis in the Rayleigh limit. Contrarily, incident light from the minor axis is scattered by 90, which is then partially polarized along the major axis of the disk. Thus, the majority of the polarization vectors are orientated along the minor axis. Qualitatively, Yang et al. (2016) found a similar polarization vector behavior for the specific case of HL Tau using a semi-analytic model. To better understand the sideways polarization, one should first take a look at the case of an edge-on disk (right most panel of Fig. 7). The basic mechanism is illustrated in Fig. 8. The polarization effect seen in this case is comparable to that for a tube-like density distribution (cf. Fig. 5 in Kataoka et al. 2015), just imagine to bend the tube forming a ring. The radiation inside the tube is polarized radially and so it is detected for the edge-on disk due to the net flux from the azimuthal direction being larger than that from the radial direction. Since the midplane is, however, optically thick, the polarization degree values themselves are quite low. The decrease of polarization degree at optically thick regions was also reported in Kataoka et al. (2015). Furthermore, the vector orientation changes for the location where the vertical optical depth reaches unity. Therefore, the vertical gradient of radiation dominates and the polarization vectors are azimuthally orientated. Intermediate inclined disks, such as , 40∘ or 60∘, indicate that for all rings there is a decrease of polarization along the minor axis and enhanced polarization along the major axis. In the outer ring the gradient-induced polarization and, therefore, the azimuthal vector orientation still dominates, since the major emission comes from the inside. As already mentioned, the bright intensity ring works as the thermal emission source here. In contrast, the inclination-induced sideways effect is strong for the central region inside of the intensity ring, where the gradient-induced polarization is weak already for the face-on disk. Hence, there is a polarization direction change by 90∘ along the minor axis in the inner disk. Indeed, the fraction of scattered radiation polarized due to disk inclination gets larger with increasing inclination angle.
The polarization detection generally depends on the spatial resolution. If the disk cannot be spatially resolved, i.e. it is seen as a point source, it depends on the disk inclination whether polarization can be actually detected. Considering this case, for a face-on disk, where exclusively gradient-induced polarization acts, the polarization components cancel out ending in no polarization at all. However, for an inclined disk, where the sideways polarization plays an important role, polarization can be detected even for a point source. In Fig. 9 the net polarization is plotted versus the disk inclination angle. It is shown that the net polarization is zero for the face-on disk, gradually increases with inclination and peaks at . Then, it slightly decreases again for the edge-on disk. This clearly indicates that the sideways polarization is the dominant factor for the net polarization. Since we are interested in detecting the characteristic polarization features when dust tapping is triggered by a planet embedded in the disk, we do not consider edge-on disks in the following simulations. We set the disk inclination angle to an intermediate value of to obtain polarization at a high level and still resolve the structures. Since the polarization degree is up to in this case, it is likely to be detected with ALMA observations as in the case of HL Tau (Stephens et al. 2014; Kataoka et al. 2015; Yang et al. 2016). A spatial resolution as high as 02 is required to safely resolve the emission rings in PI, and hence the polarization structures. Due to the non-detection of polarization by previous observational studies, we strongly argue here that a high enough spatial resolution is the key for our science goals.

3.2.3 Wavelength dependence of polarization rings
Observations at different wavelengths are most sensitive to different particle sizes. Furthermore, as described in Sect. 3.2.1 the maximum grain size for producing polarization is proportional to the observing wavelength. Hence, although the basic polarization ring structure stays the same, the ring locations slightly change with the wavelength. More precisely, the innermost and outermost rings move inwards, while the middle ring moves in opposite direction for longer wavelengths as displayed in Fig. 10. For the third ring the moving distance of the polarization peak is au, which is large enough to be detectable with the two ALMA bands 3 and 7. This is what we expect from the dust density distribution in Fig. 2, center bottom panel. With our dust transport for each grain size together with coagulation and fragmentation of grains, a spatial segregation of the grain size distribution is modeled. The crossing point of the most upper horizontal dashed line (representative for mm) with the maximum available grain size is further inside than for the two lower horizontal lines (representing the shorter observing wavelengths). The maximum polarization degree is approximately by a factor of two higher for mm compared to mm. The reason for this is that the albedo increases with grain size and the amount of polarized intensity with respect to the unpolarized one is higher for longer wavelengths.

3.2.4 Effect of dust size evolution

To understand whether and how the polarization map changes with the dust evolution timescale we study the polarization degree at different time snapshots. We show the results for 0.1 Myr, 1 Myr and 3 Myr in Fig. 11. At a very early dust evolution time only the two inner polarization rings are produced. The reason for the absence of the third ring is that grains have not grown to sizes larger than 10 microns in the outer disk at that stage of evolution. For the small grains the absorption opacity dominates over the scattering opacity so that their scattering at mm wavelength is inefficient. At longer times of evolution, grains grow to larger sizes and drift to the region of high pressure. The third polarization ring appears already after approximately 0.5 Myr due to this efficient grain growth mechanism. From 1 Myr of dust evolution on there is a quite stable situation for the overall polarization structure. At Myr only the polarization degree in the innermost ring is slightly reduced due to the ongoing drift of particles towards the star. Contrarily, the maximum polarization degree in the outermost ring becomes slightly higher.
3.2.5 Effect of dust composition
| Dust species | Net polarization [] |
|---|---|
| Mixture | 0.042 |
| Silicate | 0.048 |
| Carbon | 0.25 |
| Water ice | 0.006 |
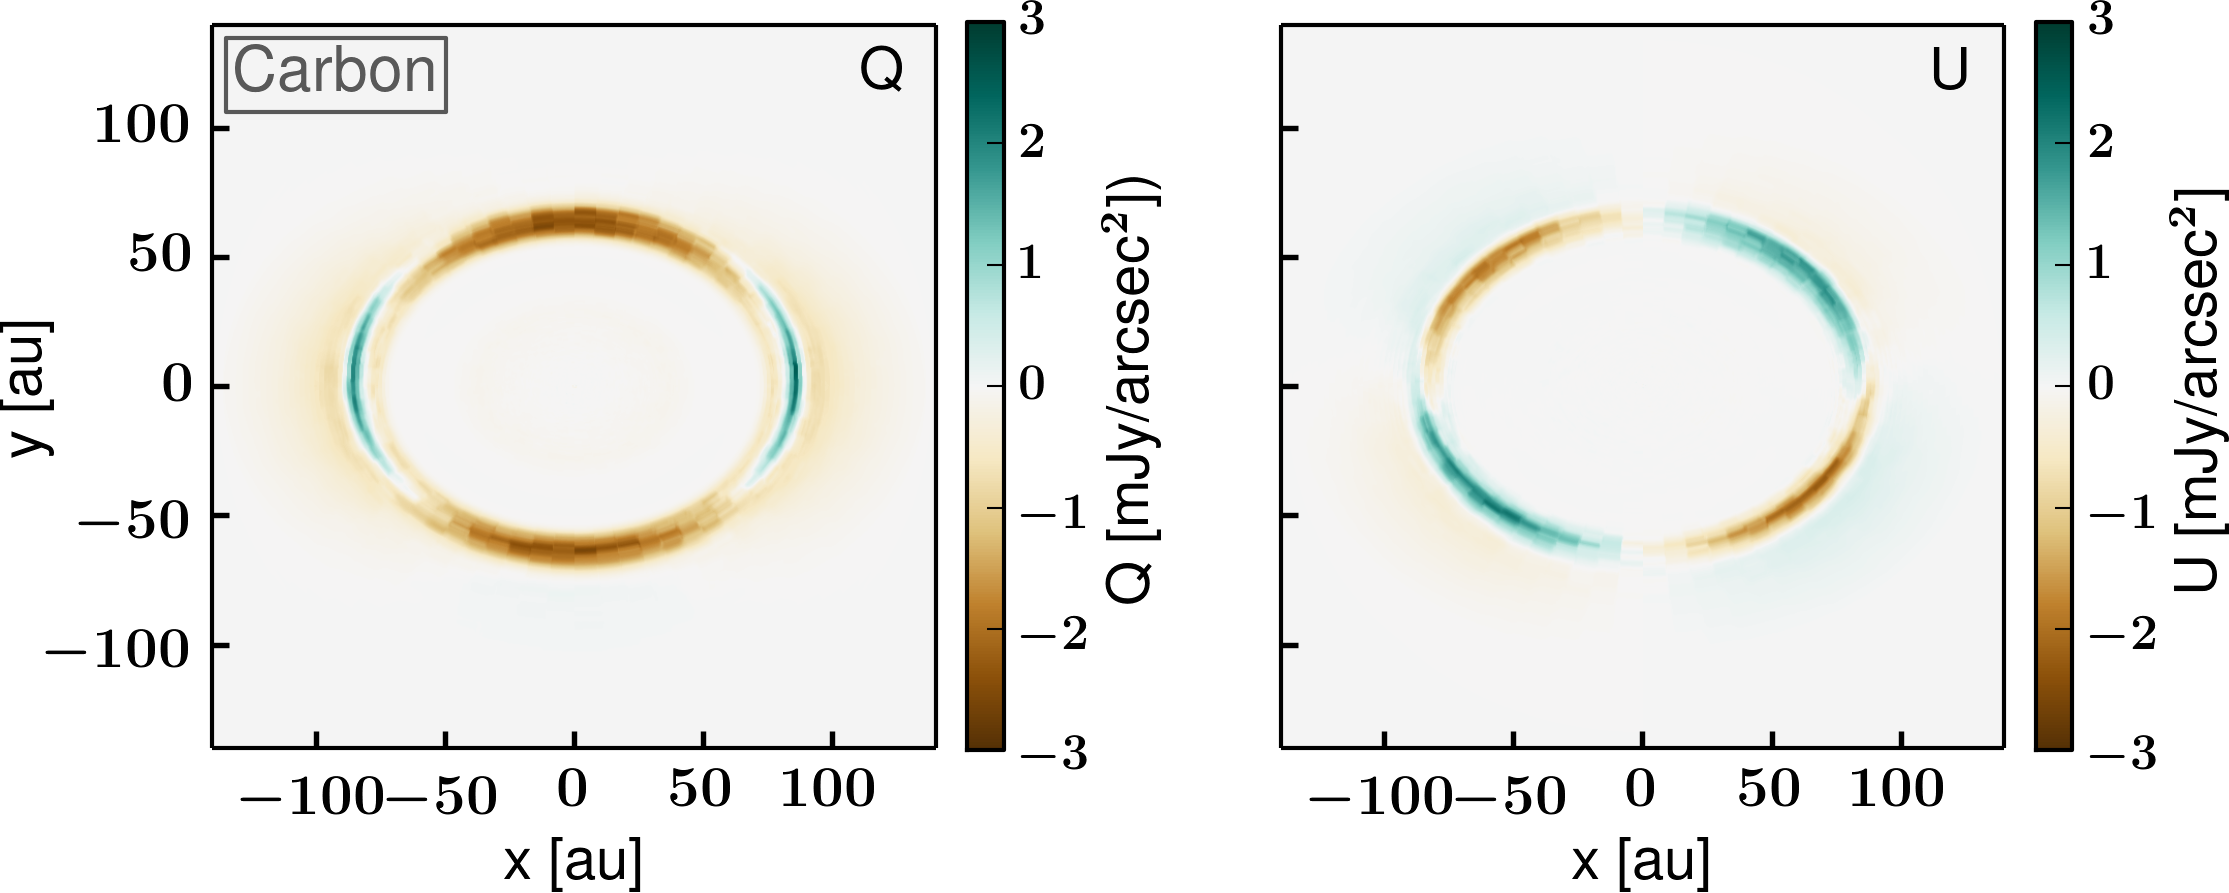
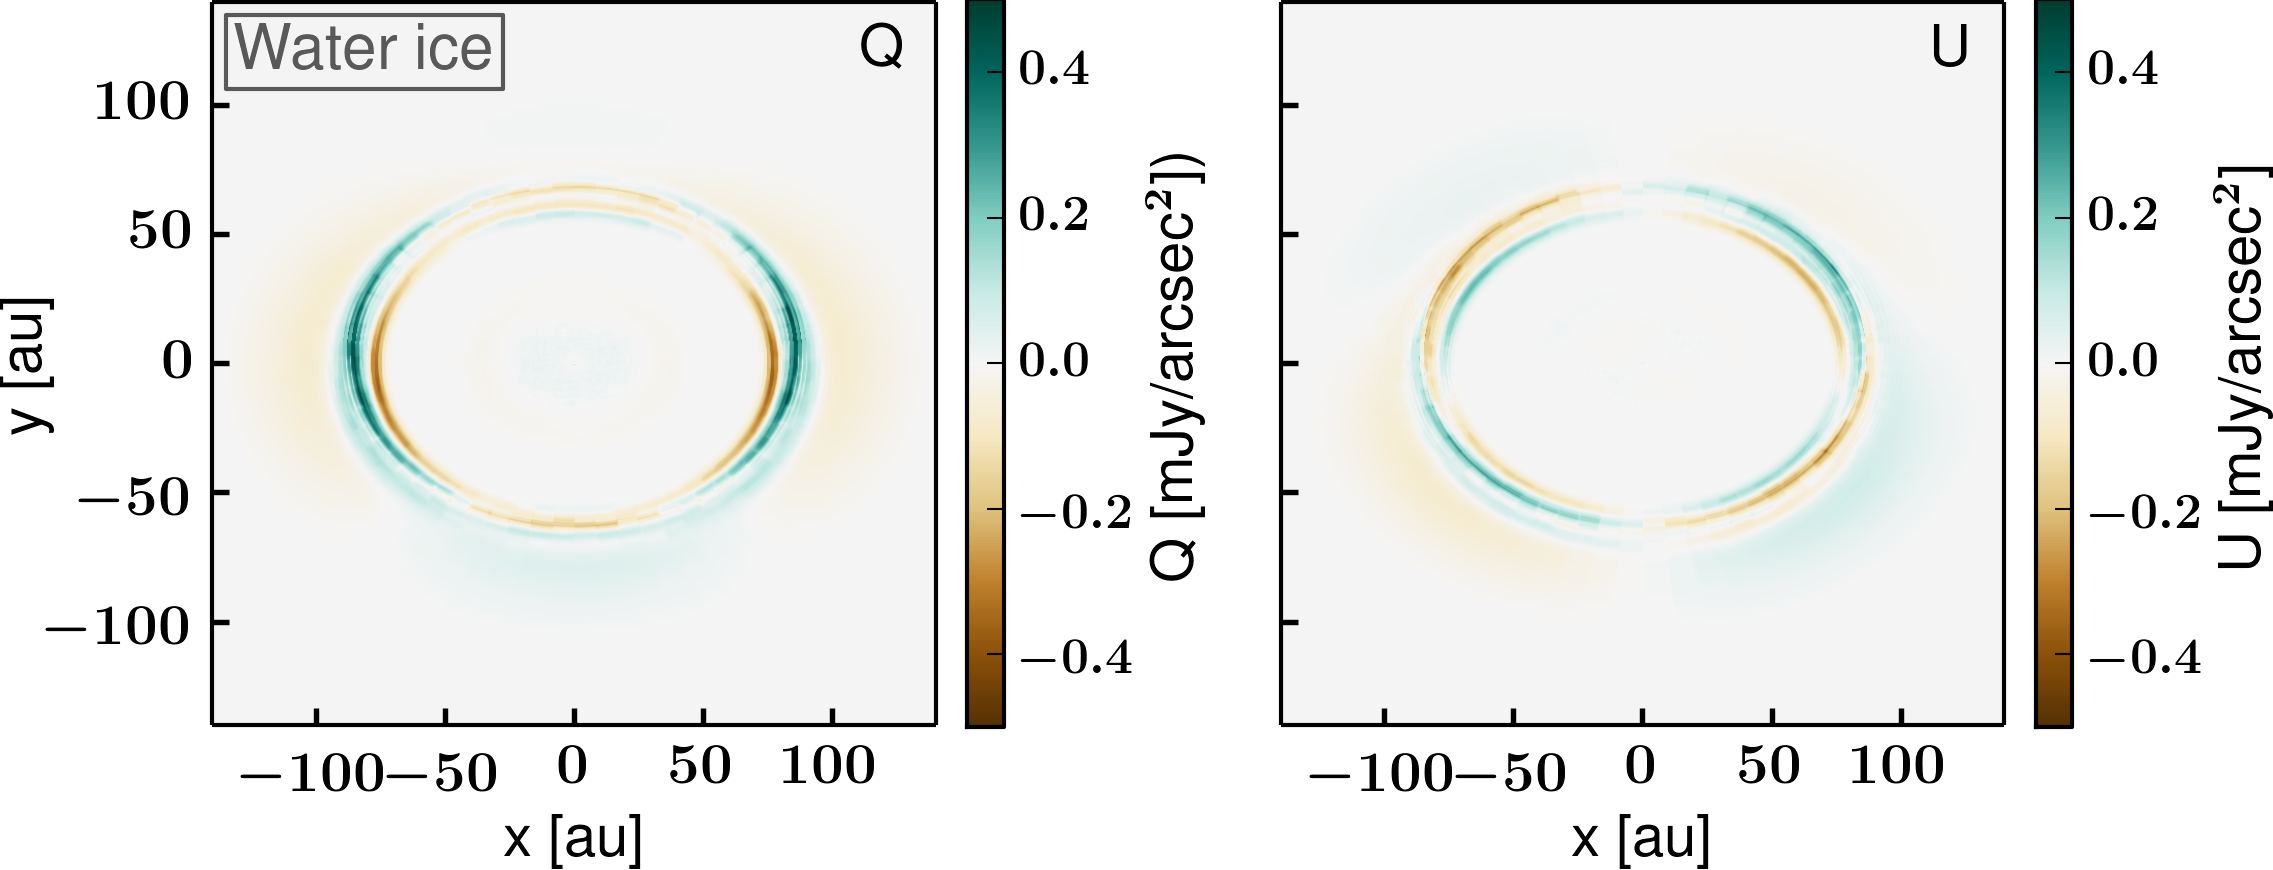
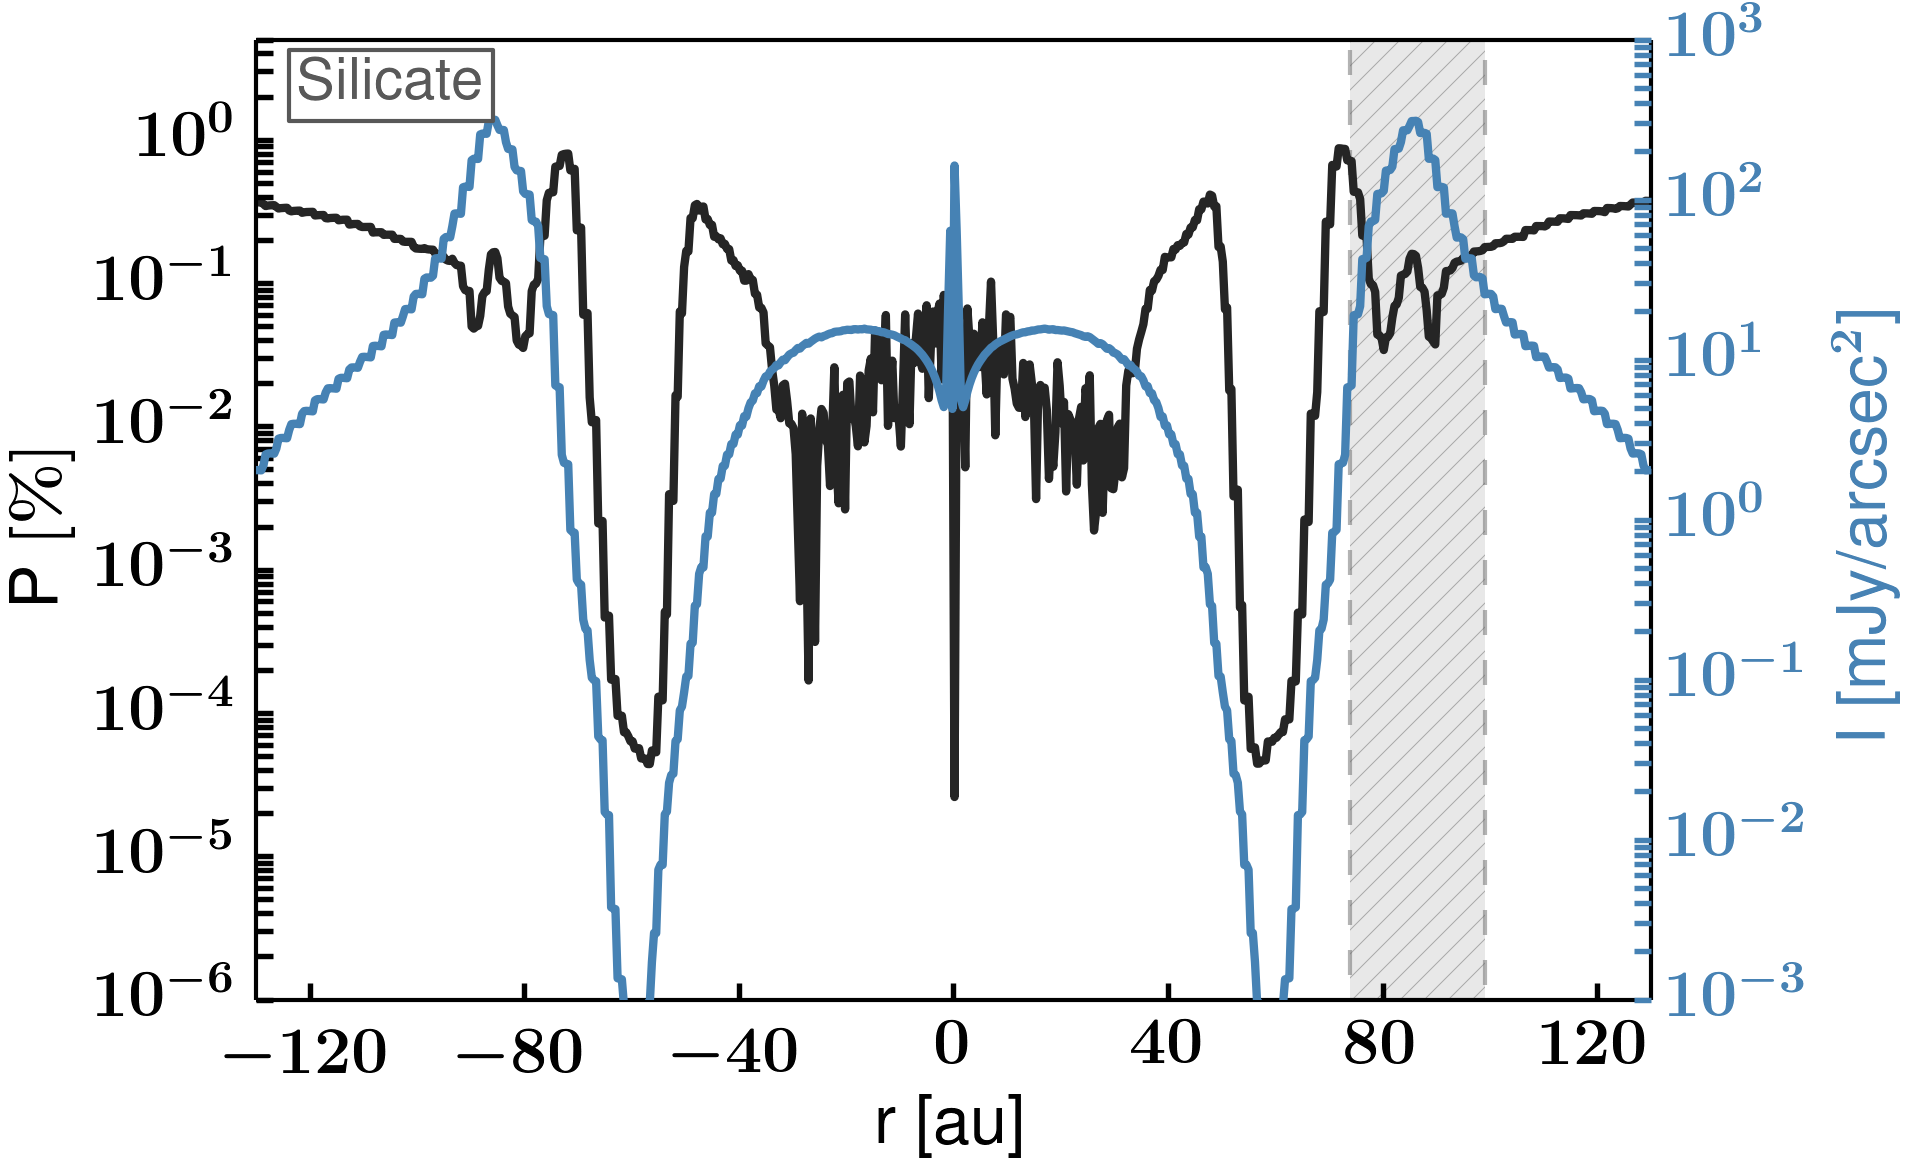
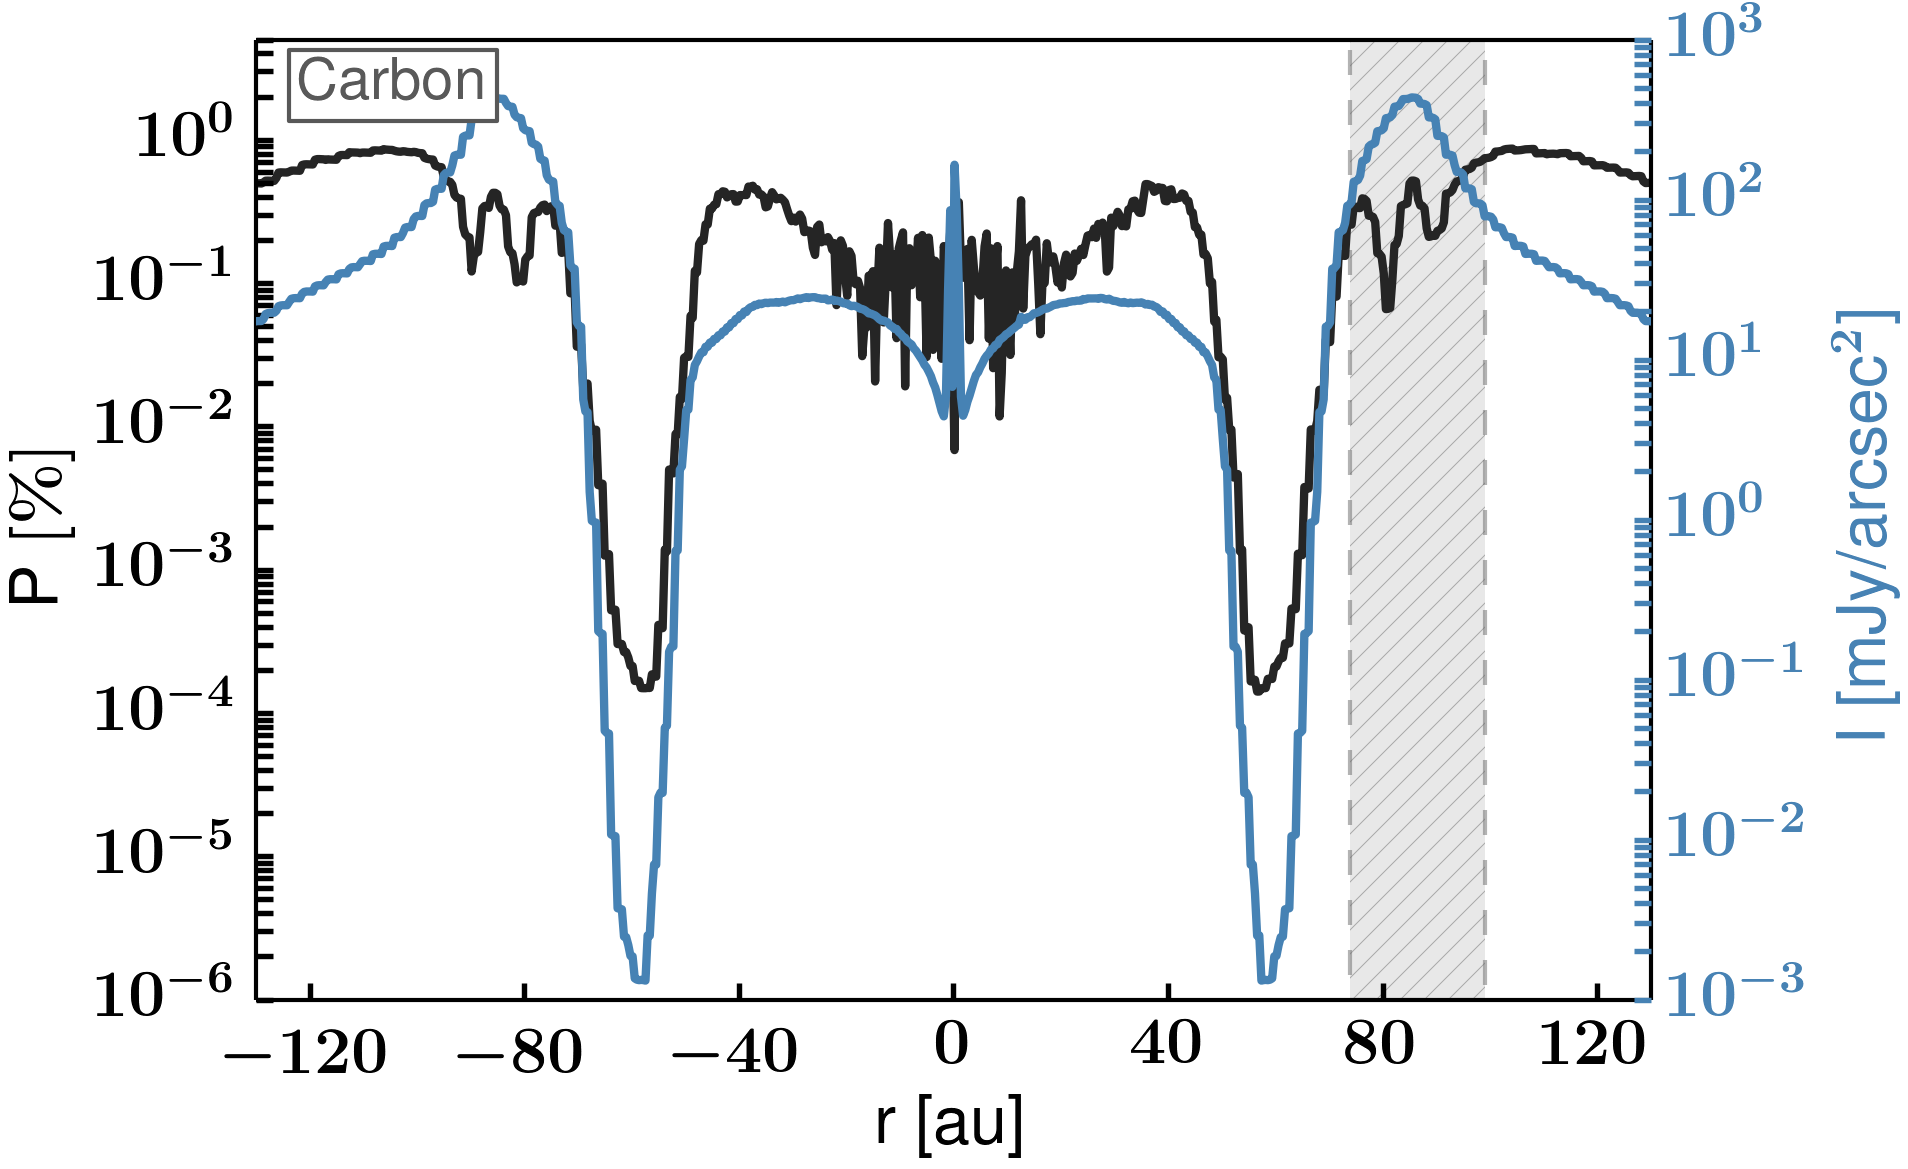
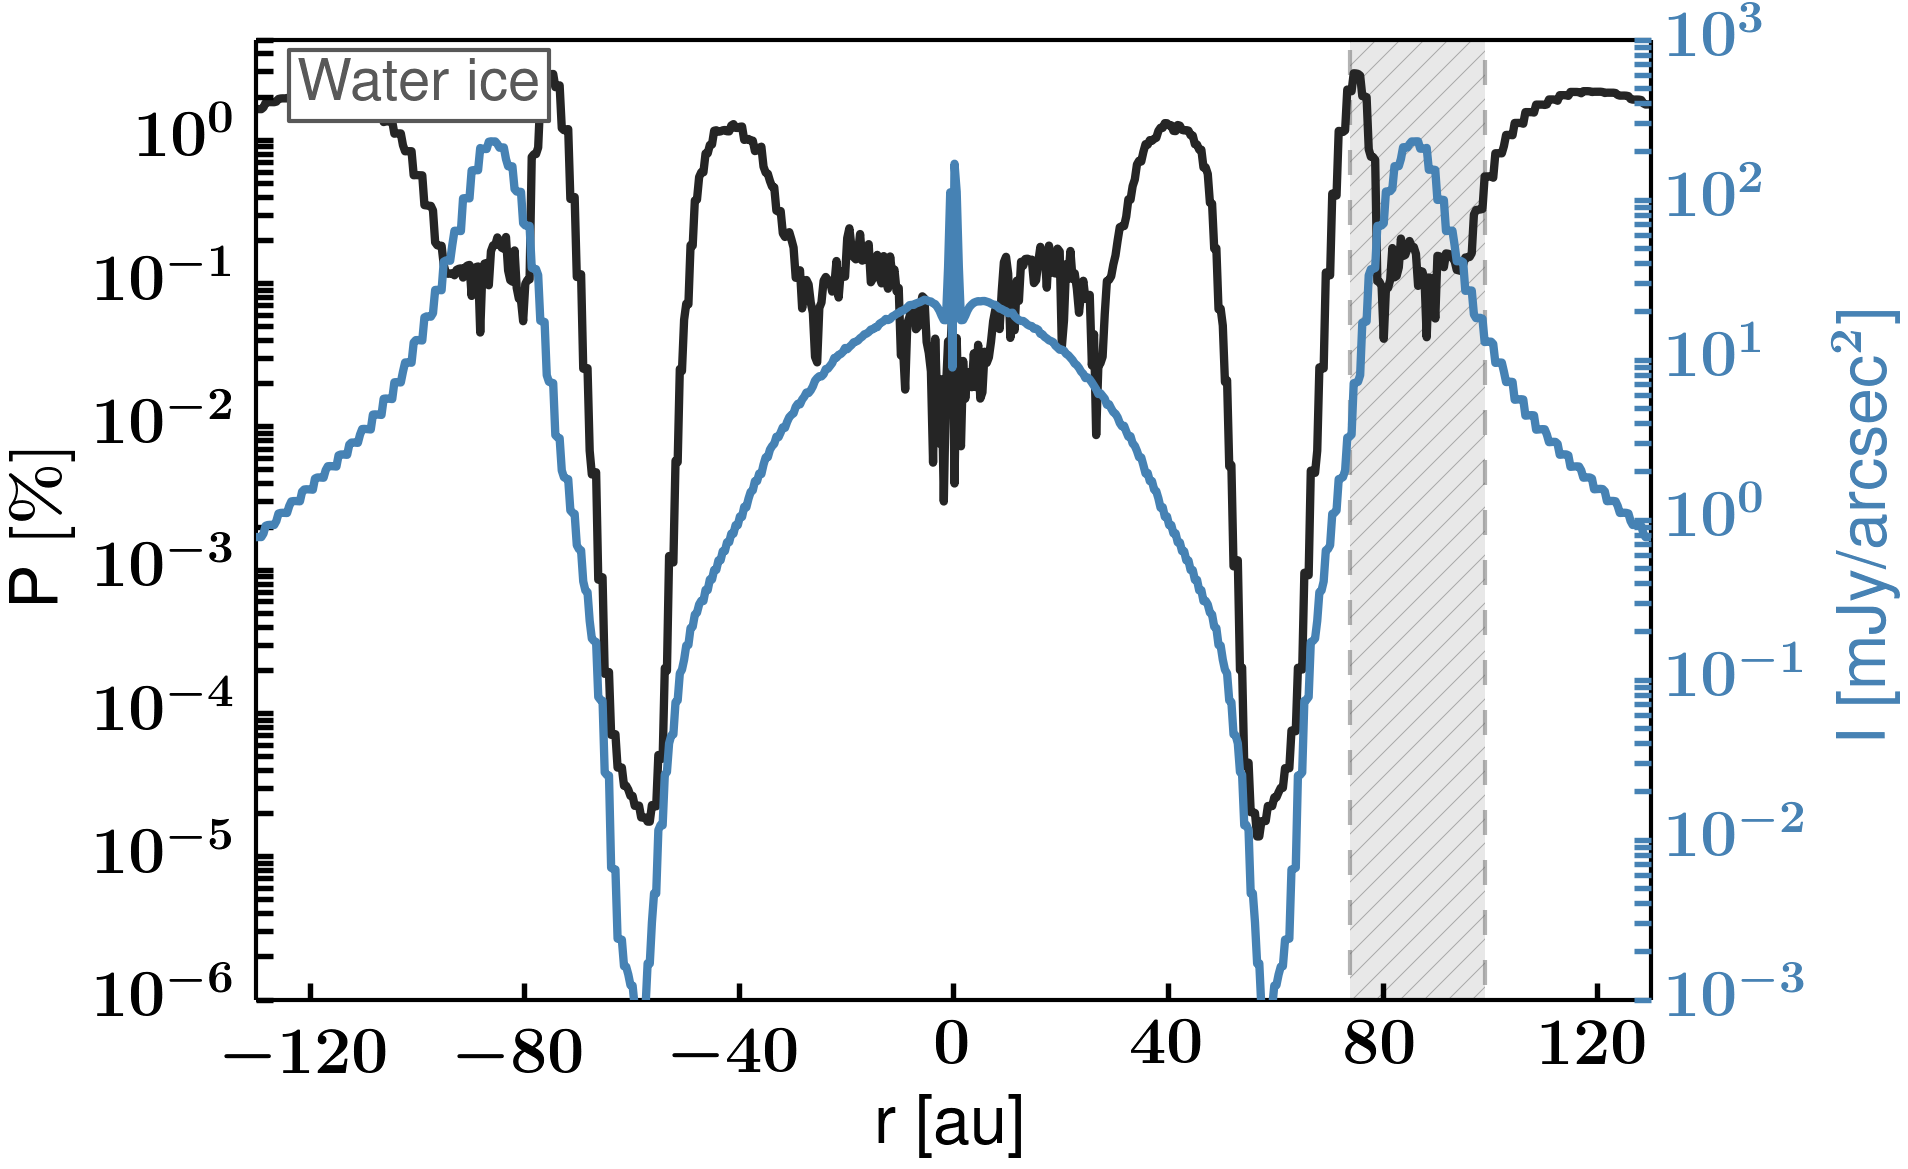
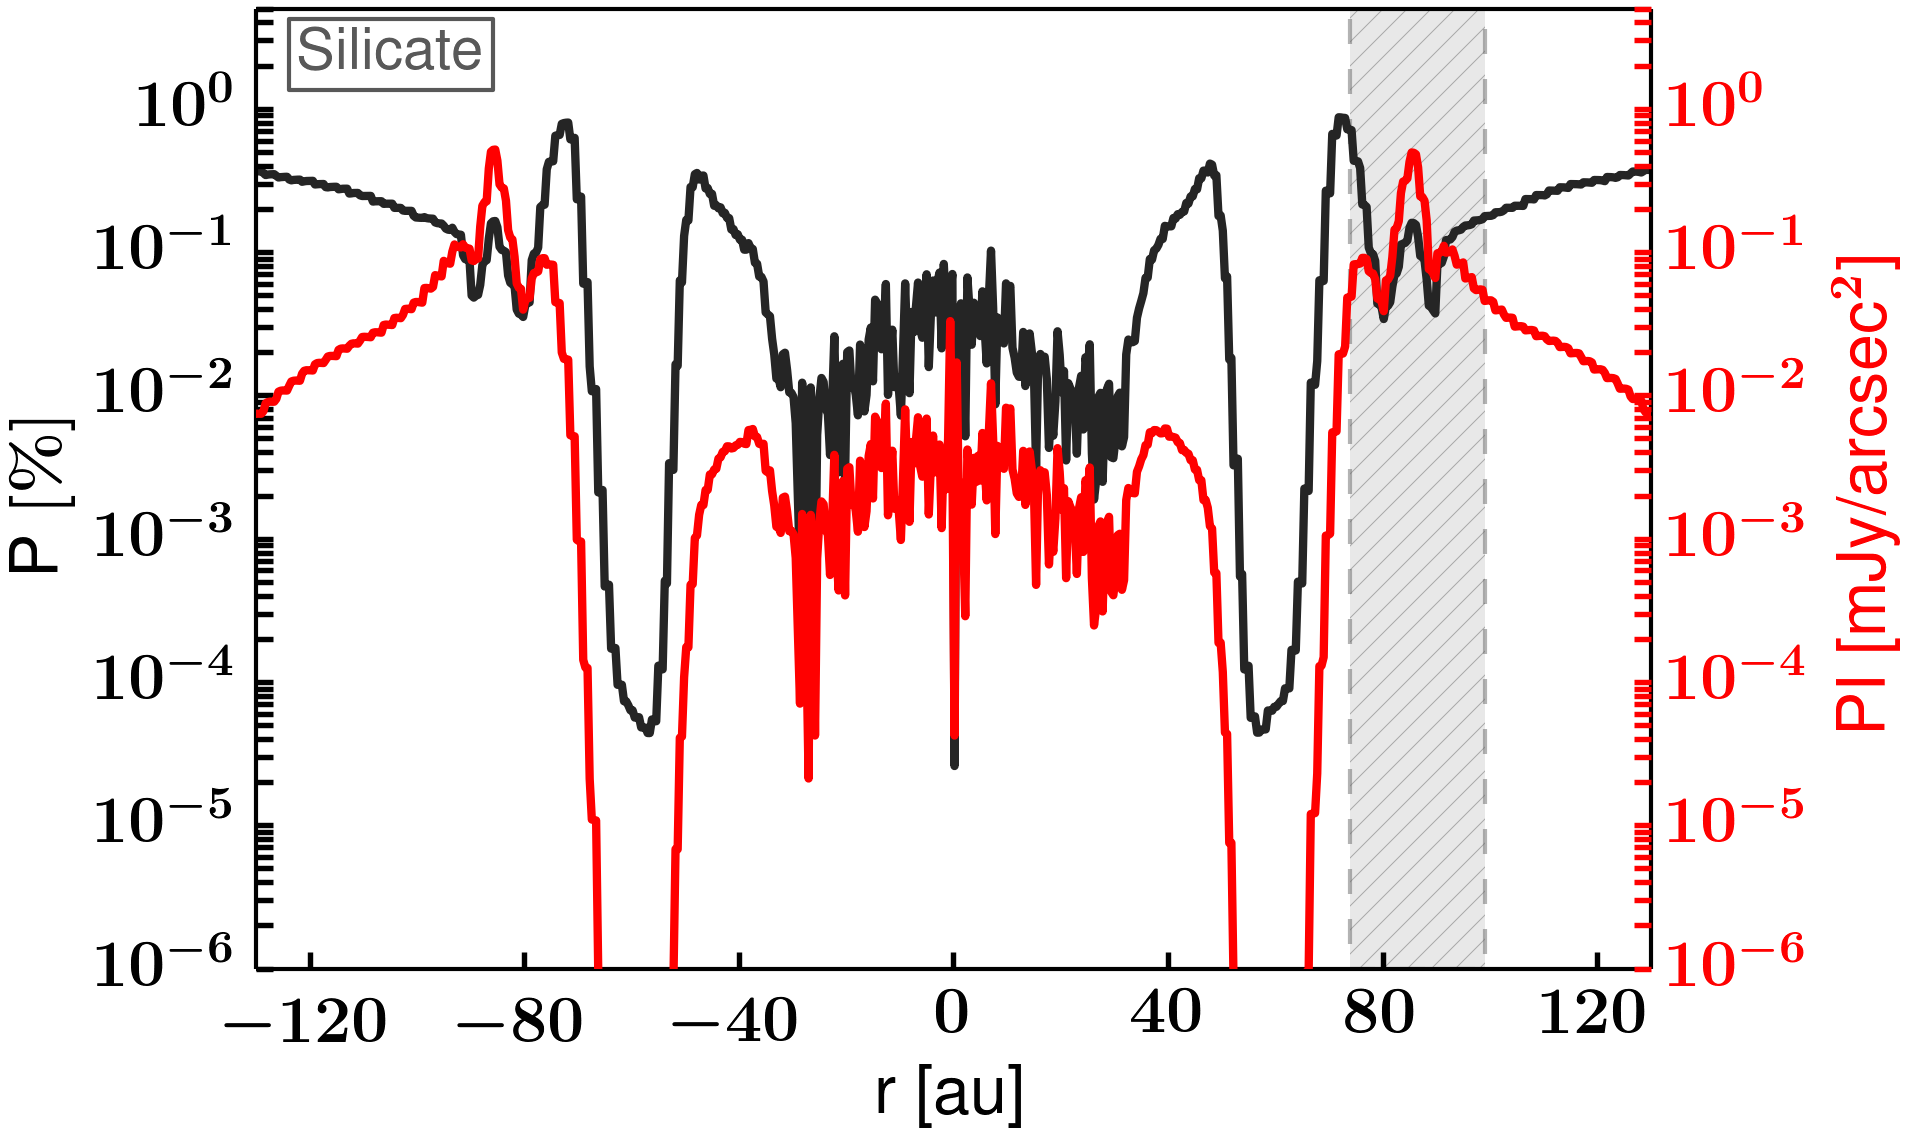
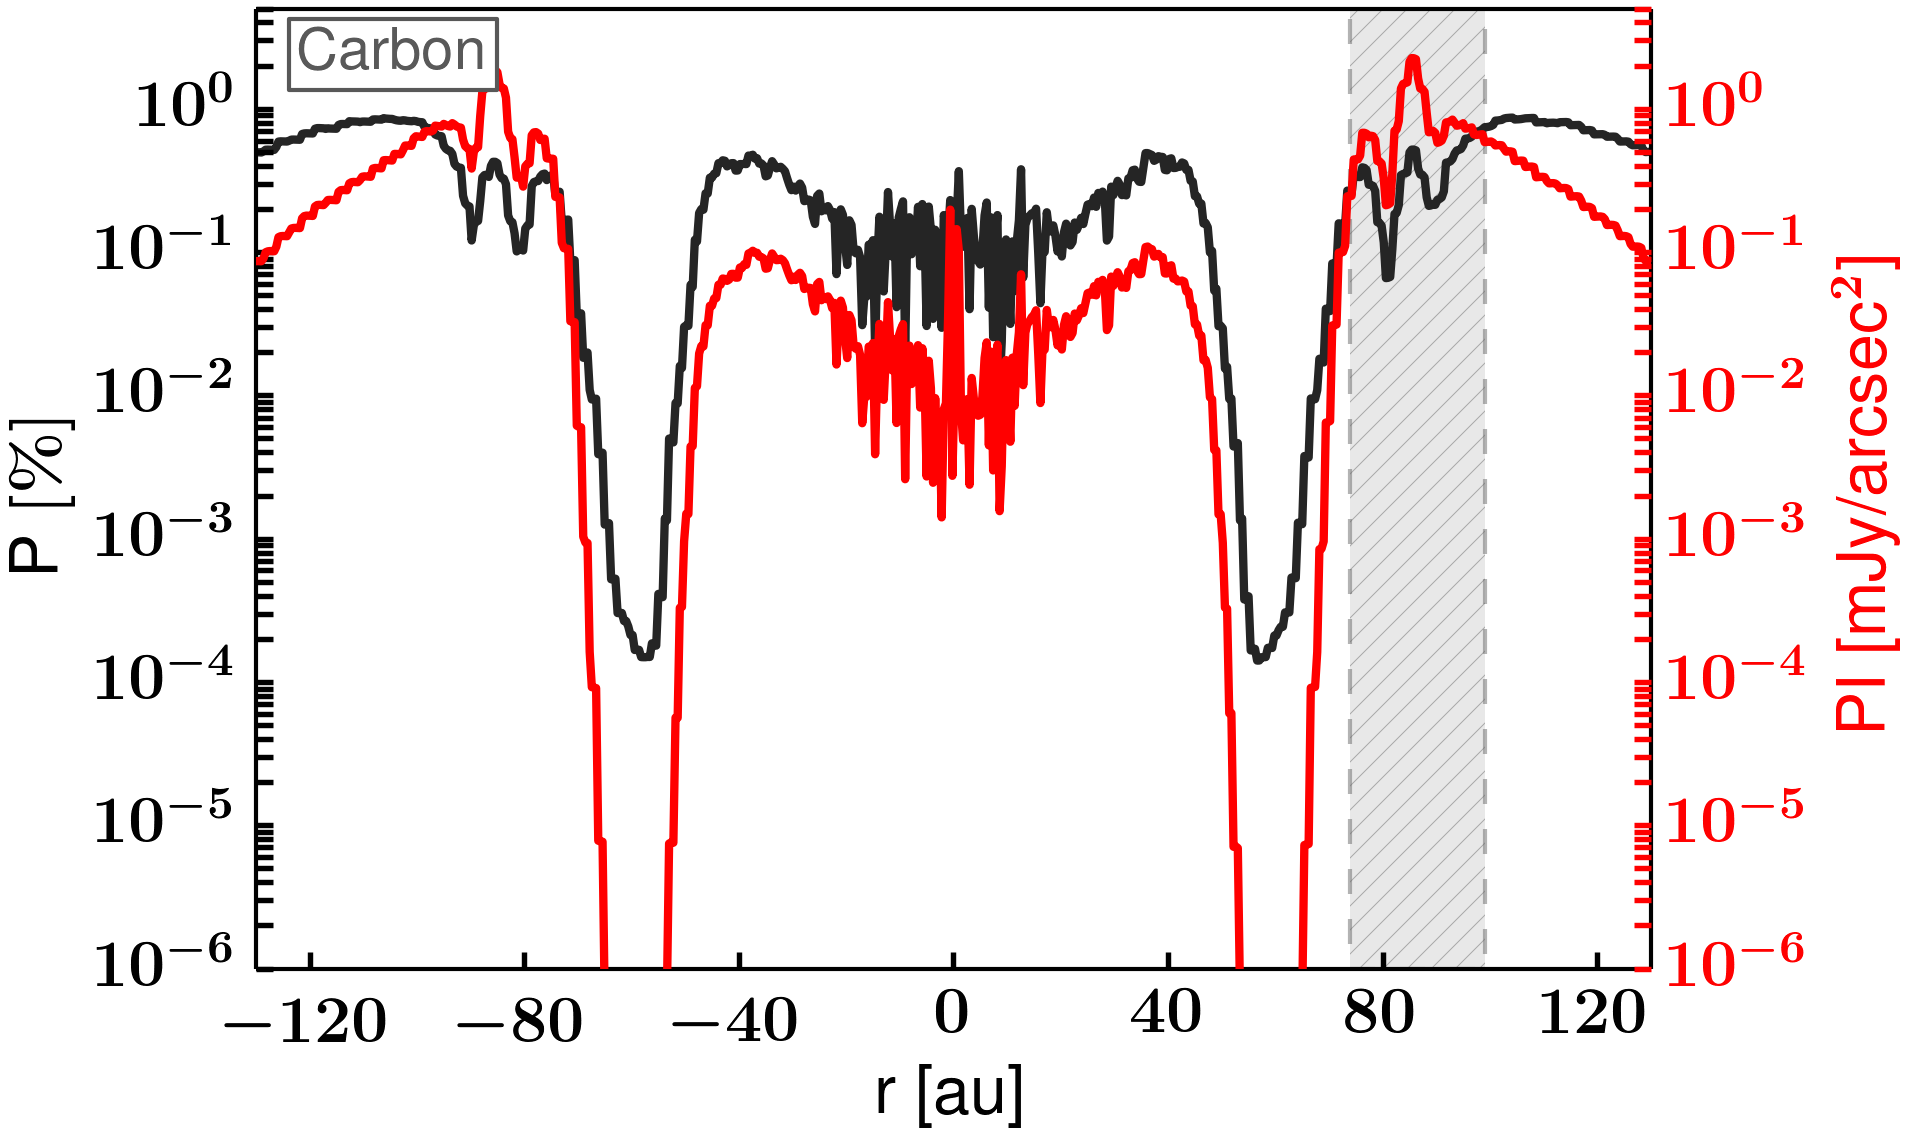
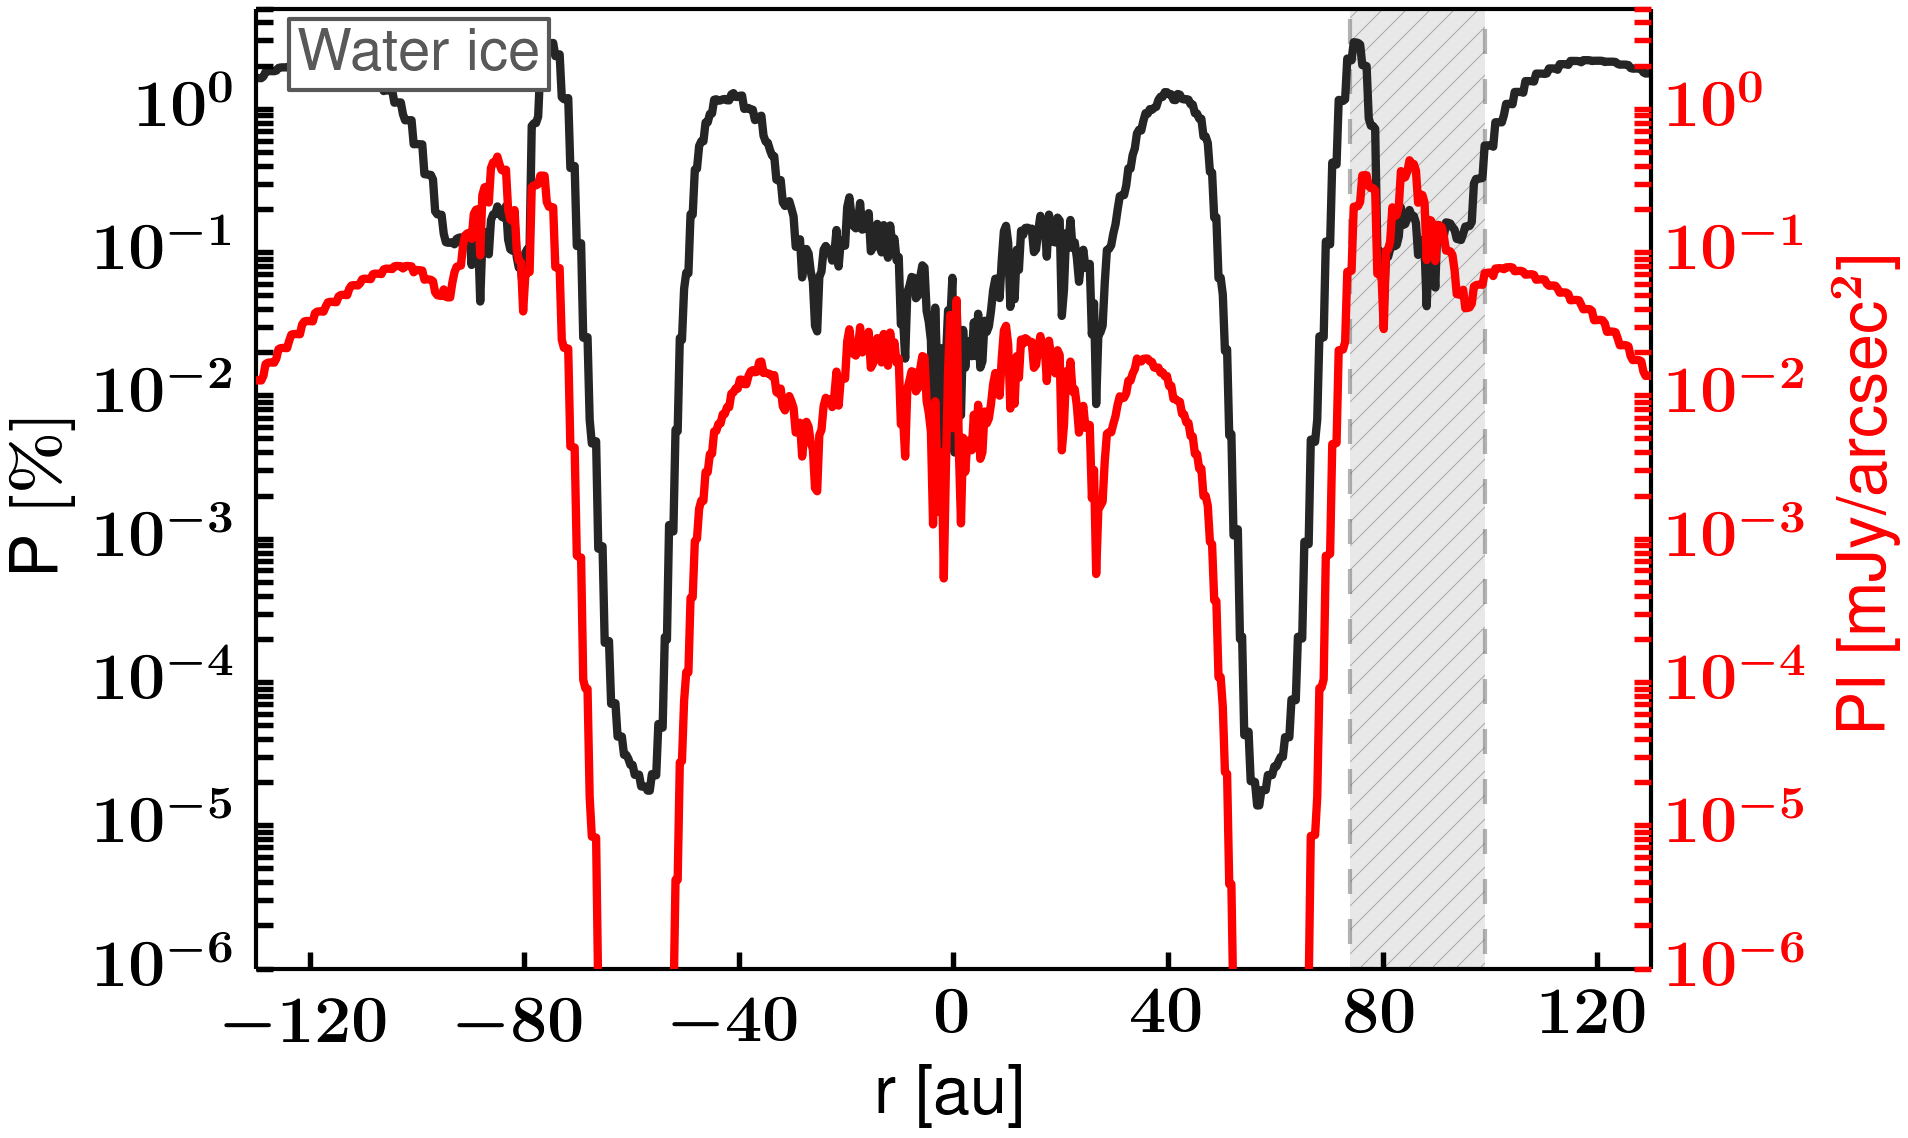
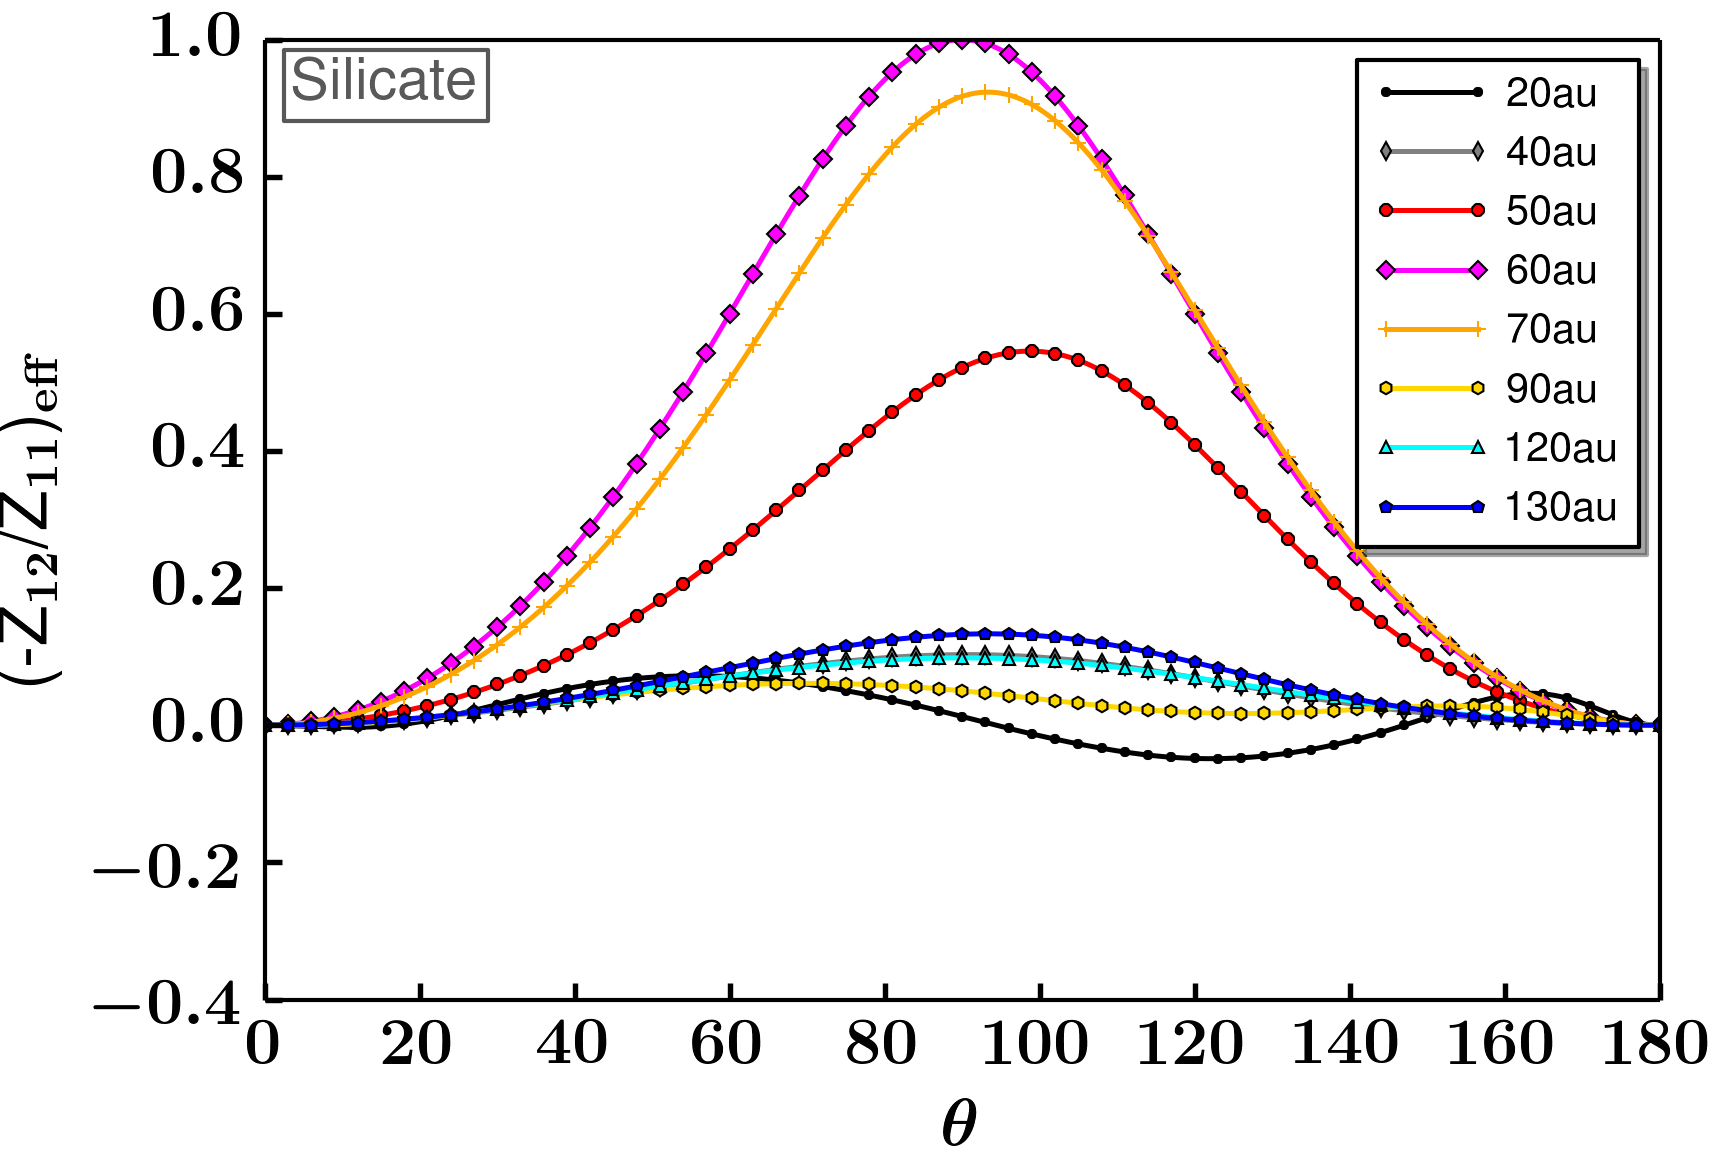
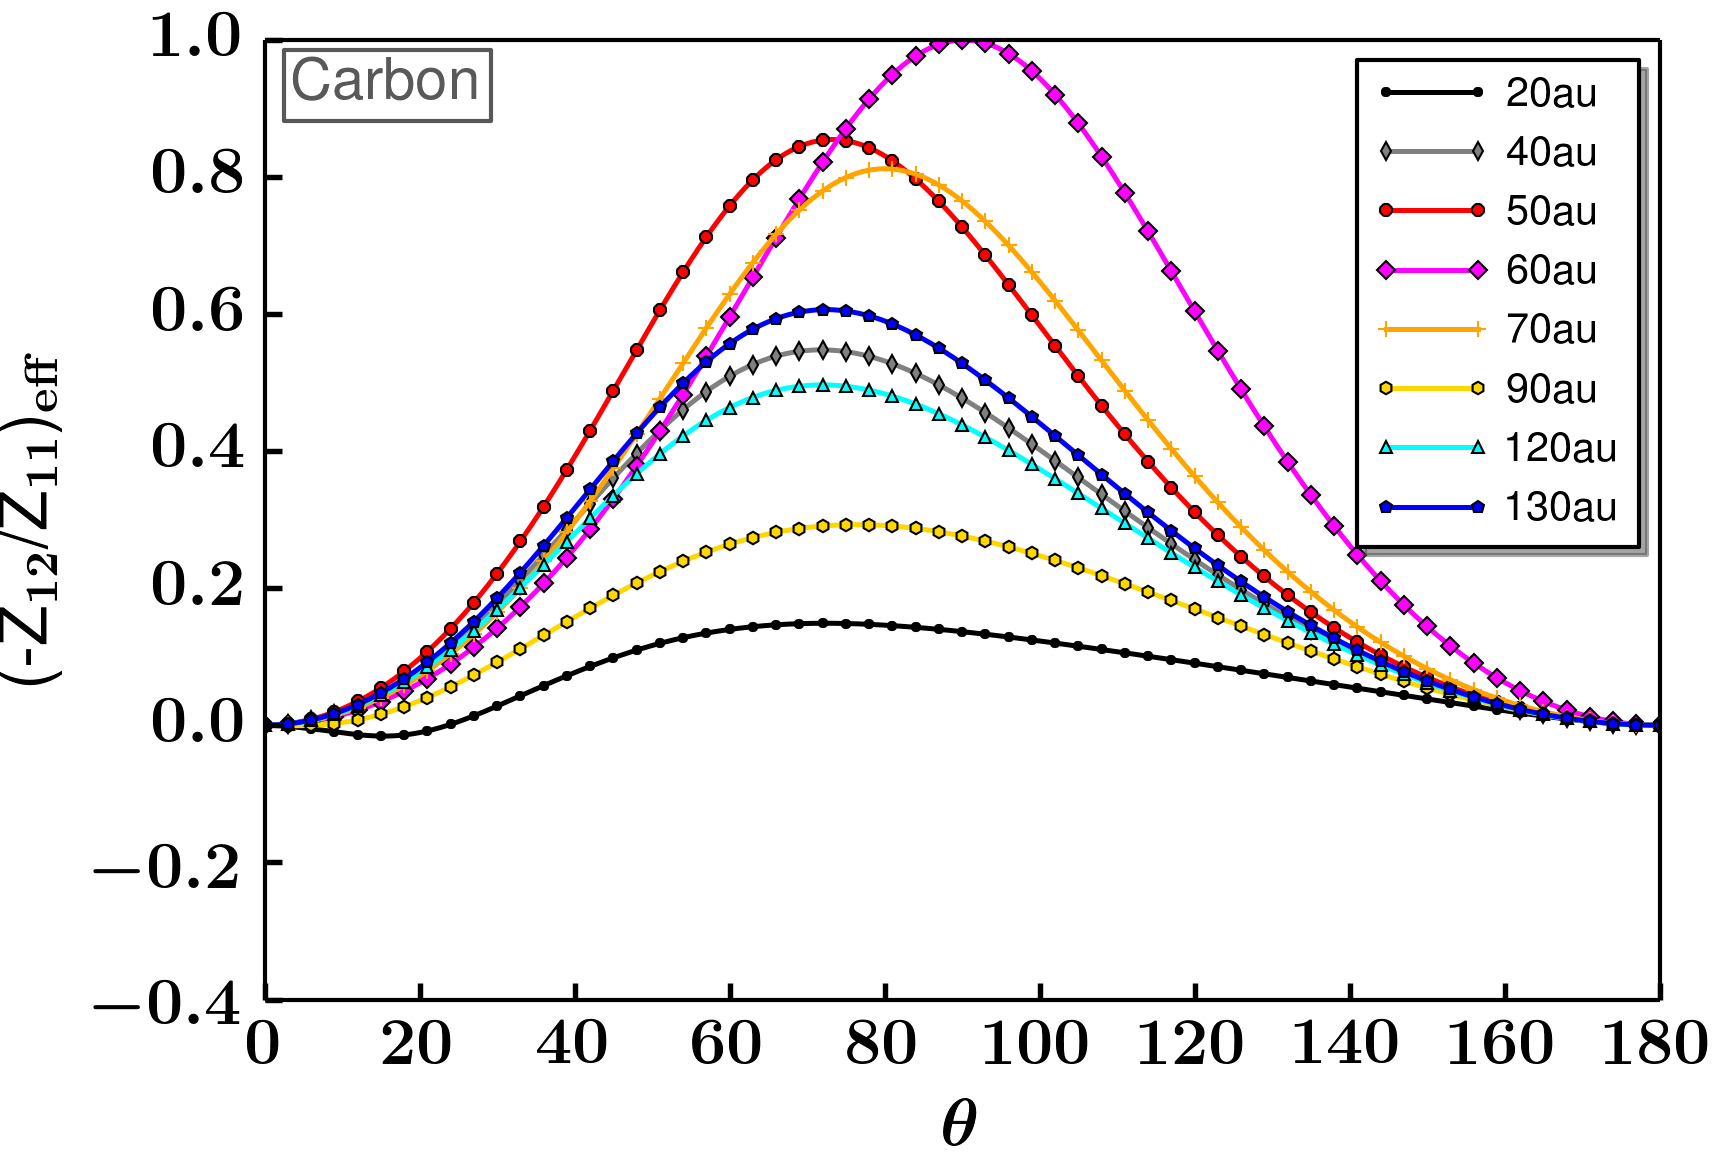
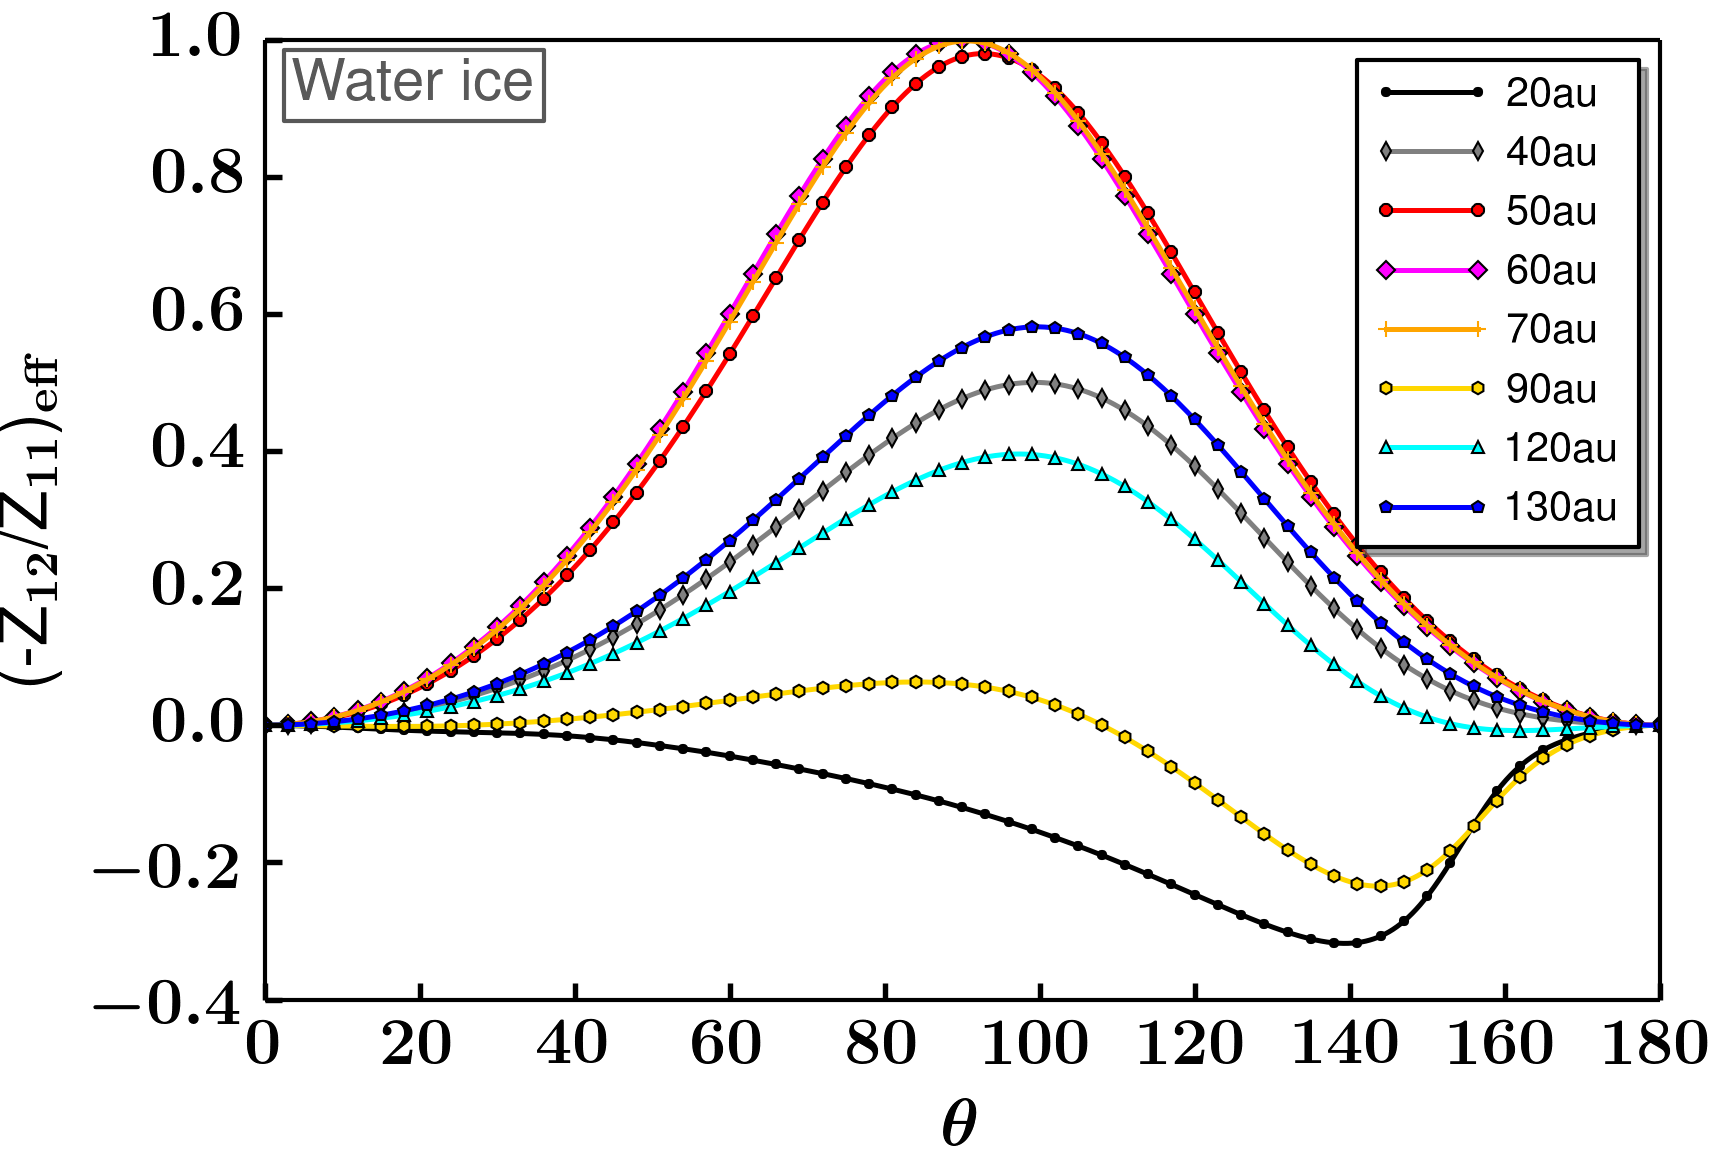
We study the effect of the dust composition on the polarization by considering three ‘extreme’ cases of pure silicate, pure carbon and pure water ice apart from our usual mixture (7% silicate, 21% carbon and 42% water ice). We find that the dust composition has no effect on the overall polarization ring structure. In all cases, three polarization rings are produced at the described locations. This is a large advantage of dust-scattering as a method to constrain the grain sizes in protoplanetary disks. For a more quantitative study, the net polarization for the models at 40∘ inclination is listed in Table 2. At first sight it is remarkable that the values for the mixture and the pure silicate case are almost equal. This is not surprising, since the refractive index of the mixture is dominated by silicates due to its high material density, even though its volume fraction is small. Hence, the polarization curves plotted in Fig. 14 for the silicate case and the ones for the dust mixture displayed in Fig. 6 are comparable. As a consequence, for any mixture including silicates the polarization degree hardly depends on the dust composition. The situation changes for pure carbon with its high net polarization, and the opposite case of pure water ice, for which the lowest net polarization is found. This is explained by Fig. 12 illustrating the Stokes and images. For carbon the negative values (brown color) clearly exceed the amount of positive (cyan color). Since the absolute value of is nearly two orders of magnitude higher than that for , the net polarization is determined by the Stokes component and ends up being larger than zero. For water ice the summed up value is dominating the component, however, it is still substantially lower than for carbon. These results are also supported by the polarized intensity profiles plotted in the bottom row of Fig. 13. The polarized intensity peaks are highest for carbon and lowest for water ice, silicate is situated in-between. Furthermore, Fig. 14 illustrates the effective degree of polarization. For carbon the polarization curves show the highest polarization degrees for all radii considered and no polarization reversal is detected between the relevant scattering angles of 50∘ and 130∘. Contrarily, the maxima for the polarization curves of pure water ice are lower and considerable negative polarization exists. Overall, these effects lead to the low net polarization of water ice compared to the mixture, the pure silicate and pure carbon case.

Apart from the net polarization there are also significant differences in the local polarization degree. We are again explaining the two limiting cases of pure carbon and water ice. Interestingly, the behavior of the net polarization calculations has turned. The polarization degree is plotted in Fig. 13 (black lines). It is basically determined by the flux gradients displayed in the radial intensity cuts in the top row of Fig. 4, and by the effective polarization curves in Fig. 14. From the former one can understand the differences in the polarization degree of the innermost and outermost peak. The gradient of the intensity curve is much steeper for water ice leading to a higher polarization degree. Although the difference in the flux gradient is also slightly seen for the second polarization peak, it is noticeable that optical depth effects also come into play. In Fig. 15 the optical depth in the vertical direction considering the vertically integrated dust density, , is plotted for mm. At the position of the second ring (au) the optical depth of carbon is larger than for water ice. Considering that we investigate inclined disks, which increases the optical depth, this means that the carbon model is marginally optically thick. Therefore, the corresponding radiation field is isotropic, so that we do not expect any polarization. Thus, the second peak in the polarization degree for water ice is also higher than the associated peak for the carbon case.
3.2.6 Effect of planet and its position

As discussed in Sect. 3.1 the presence of a planet triggers the trapping mechanism for mm-sized dust grains in the pressure bump outside of the planet orbit. Depending on whether the planet is embedded at 20 au or 60 au the gap width increases due to the radial density change and the pressure maximum is located at 30 au and 90 au, respectively. Figure 16 shows the polarization degree for the planet at 20 au and a comparison model without any planet, for both cases at mm. All other disk parameters are exactly the same as in the reference model. As mentioned before the two inner polarization rings are located just at the intensity gap edges. Hence, for the 20 au case those rings are situated further inside with a narrower separation. Without any giant planet embedded in the disk only the outermost polarization ring remains. This is obvious since a gap and pressure bump in the dust distribution are missing as seen in Fig. 3. There is only one crossing point between the horizontal lines and the maximum grain size layer. Therefore, polarization detection due to dust self-scattering can distinguish between transition disks hosting a gap and pressure bump on the one hand, and protoplanetary disks with a continuous surface density distribution on the other hand. We note that if the dust at the inside of the gap is depleted converting the gap into a complete cavity, the inner ring cannot be detected. Thus, in this case only the outer two rings are visible.
4 Summary and conclusions
We present a new technique to investigate the dust trapping scenario in transition disks hosting a pressure bump by means of mm-wave polarization of scattered thermal emission. More precisely, the continuum emission is polarized due to dust self-scattering of an anisotropic radiation field induced by disk inclination. For the mm-wave polarization to work the scattering grains must have grown to a maximum size of a few hundred microns. Additionally, further populations of either very small micron-sized or mm-/cm-sized grains need to be present in order to account for the large portion of unpolarized continuum emission. Our model predictions at different ALMA bands (bands 3, 6 and 7) are based on self-consistent dust growth models and radiative transfer calculations, which allows us to estimate the polarization degree in disks hosting a massive planet. The planet is considered to be located at 20 au and 60 au, respectively. Compared to previous studies a dust size distribution in radial direction is included in our model. Measuring the dust polarization degree is a direct and an unambiguous method to probe the location of large particles (a few hundred micron to mm sized particles, depending on the observing wavelength) when particle trapping occurs in the disk. We emphasize that the polarization technique presented can be applied to any disk with ring-like dust structures segregating the grain sizes, and is not limited to the gap opening scenario by planets. In this paper we focus on transition disks, because they are excellent candidates where planet formation may be ongoing. Thus, polarization observations are especially a unique tool to investigate the dust distribution when particle trapping is triggered by a planet embedded in the disk. The main findings of this paper are the following:
-
1.
The polarization pattern of a disk hosting a planetary gap after 1 Myr of dust evolution shows a characteristic three ring structure, where the two inner, narrow rings are located just at the gap edges. Additionally, there is a third polarization ring in the outer disk beyond 100 au with a larger radial extension. Detecting such a distinctive ring structure with polarization observations may represent the radial size distribution of dust grains and hint to regions with a specific grain size corresponding to the wavelength.
-
2.
For an inclined disk there is an interplay between polarization originating from a flux gradient and from an inclination-induced anisotropy. The fraction of scattered radiation polarized due to disk inclination increases with the inclination angle. For intermediate inclined transition disks the polarization degree at mm is as high as , which is well above the detection limit of future ALMA polarization observations. A spatial resolution as high as 02 is required to certainly resolve the ring structure in polarized intensity.
-
3.
The local degree of polarization is very sensitive to the maximum grain size at a certain location in the disk. Large cm and mm grains do not contribute to the polarization, which leads to a significant local reduction of the polarization degree, e.g. at the pressure bump region in our transition disk models. Hence, if the maximum grain size is larger than a few hundred microns, the polarization is not detectable, even if numerous small grains are present and contribute.
-
4.
For the face-on disks the polarization vectors are in azimuthal direction within the highest polarized intensity regions. For inclined disks the majority of the polarization vectors in the two inner rings are orientated along the minor axis. In the outer ring the gradient-induced polarization and, therefore, the azimuthal vector orientation still dominates.
-
5.
With increasing observing wavelengths the innermost and outermost polarization rings move inwards by a detectable distance, while the middle ring slightly moves radially outside. Hence, the positions of the two rings at the gap edges are shifted in opposite directions. For the outermost ring the moving distance is au comparing the results at 0.87 mm and 3.1 mm. Furthermore, without any giant planet embedded in the disk, this third ring reflects the only polarized region, even though the polarization degree is quite low.
-
6.
We find that the dust composition has no effect on the overall polarization ring structure. The presence of even a very small fraction of silicate in the dust mixture causes the local polarization degree and net polarization to be very similar to the case of pure silicate species. Silicate grains dominate the refractive index of the dust mixture, and the fractional abundances of carbonaceous material and water ice hardly affect the polarization pattern. A significant change of the local polarization degree with dust species can be led back to either optical depths effects or different flux gradients.
We showed that polarization due to dust self-scattering is a powerful tool in order to constrain the grain size in protoplanetary disks independent of the spectral index. Nevertheless, there are also other polarization mechanisms such as alignment of dust grains along the magnetic field vectors. A keystone to investigate in future work is how to distinguish between these two mechanisms. Further multi-wave and spatially resolved polarization observations of protoplanetary disks are necessary. The wavelength and grain size dependence of polarization are also the keypoints from the modeling side. Due to the self-scattering mechanism we expect the polarization degree to significantly change with the observing wavelength, while it is thought to be approximately constant due to magnetically aligned grains in a toroidal magnetic field (Cho & Lazarian 2007).
Acknowledgements.
A. P. is a member of the International Max Planck Research School for Astronomy and Cosmic Physics at Heidelberg University, IMPRS-HD, Germany. A. K. acknowledges financial support from JSPS KAKENHI No. 15K17606. P. P. is supported by Koninklijke Nederlandse Akademie van Wetenschappen (KNAW) professor prize to Ewine van Dishoeck.References
- Andrews & Williams (2005) Andrews, S. M. & Williams, J. P. 2005, ApJ, 631, 1134
- Beckwith & Sargent (1991) Beckwith, S. V. W. & Sargent, A. I. 1991, ApJ, 381, 250
- Birnstiel et al. (2010) Birnstiel, T., Dullemond, C. P., & Brauer, F. 2010, A&A, 513, A79
- Bohren & Huffman (1984) Bohren, C. F. & Huffman, D. R. 1984, Nature, 307, 575
- Casassus et al. (2015) Casassus, S., Marino, S., Pérez, S., et al. 2015, ApJ, 811, 92
- Cho & Lazarian (2007) Cho, J. & Lazarian, A. 2007, ApJ, 669, 1085
- D’Alessio et al. (2001) D’Alessio, P., Calvet, N., & Hartmann, L. 2001, ApJ, 553, 321
- Daniel (1980) Daniel, J.-Y. 1980, A&A, 87, 204
- de Juan Ovelar et al. (2013) de Juan Ovelar, M., Min, M., Dominik, C., et al. 2013, A&A, 560, A111
- de Juan Ovelar et al. (2016) de Juan Ovelar, M., Pinilla, P., Min, M., Dominik, C., & Birnstiel, T. 2016, ArXiv e-prints [arXiv:1603.09357]
- Draine (2003) Draine, B. T. 2003, ApJ, 598, 1026
- Fischer et al. (1994) Fischer, O., Henning, T., & Yorke, H. W. 1994, A&A, 284, 187
- Flock et al. (2015) Flock, M., Ruge, J. P., Dzyurkevich, N., et al. 2015, A&A, 574, A68
- Fromang & Nelson (2005) Fromang, S. & Nelson, R. P. 2005, MNRAS, 364, L81
- Guilloteau et al. (2011) Guilloteau, S., Dutrey, A., Piétu, V., & Boehler, Y. 2011, A&A, 529, A105
- Henning & Stognienko (1996) Henning, T. & Stognienko, R. 1996, A&A, 311, 291
- Hughes et al. (2013) Hughes, A. M., Hull, C. L. H., Wilner, D. J., & Plambeck, R. L. 2013, AJ, 145, 115
- Johansen et al. (2009) Johansen, A., Youdin, A., & Klahr, H. 2009, ApJ, 697, 1269
- Juhász et al. (2015) Juhász, A., Benisty, M., Pohl, A., et al. 2015, MNRAS, 451, 1147
- Kataoka et al. (2016) Kataoka, A., Muto, T., Momose, M., Tsukagoshi, T., & Dullemond, C. P. 2016, ApJ, 820, 54
- Kataoka et al. (2015) Kataoka, A., Muto, T., Momose, M., et al. 2015, ApJ, 809, 78
- Kataoka et al. (2014) Kataoka, A., Okuzumi, S., Tanaka, H., & Nomura, H. 2014, A&A, 568, A42
- Kirchschlager & Wolf (2014) Kirchschlager, F. & Wolf, S. 2014, A&A, 568, A103
- Klahr & Henning (1997) Klahr, H. H. & Henning, T. 1997, Icarus, 128, 213
- Lazarian (2007) Lazarian, A. 2007, J. Quant. Spec. Radiat. Transf., 106, 225
- Marino et al. (2015) Marino, S., Perez, S., & Casassus, S. 2015, ApJ, 798, L44
- Masset (2000) Masset, F. 2000, A&AS, 141, 165
- Mathis et al. (1977) Mathis, J. S., Rumpl, W., & Nordsieck, K. H. 1977, ApJ, 217, 425
- Pinilla et al. (2012a) Pinilla, P., Benisty, M., & Birnstiel, T. 2012a, A&A, 545, A81
- Pinilla et al. (2012b) Pinilla, P., Birnstiel, T., Ricci, L., et al. 2012b, A&A, 538, A114
- Pinte et al. (2009) Pinte, C., Harries, T. J., Min, M., et al. 2009, A&A, 498, 967
- Pohl et al. (2015) Pohl, A., Pinilla, P., Benisty, M., et al. 2015, MNRAS, 453, 1768
- Pollack et al. (1994) Pollack, J. B., Hollenbach, D., Beckwith, S., et al. 1994, ApJ, 421, 615
- Rao et al. (2014) Rao, R., Girart, J. M., Lai, S.-P., & Marrone, D. P. 2014, ApJ, 780, L6
- Ricci et al. (2011) Ricci, L., Mann, R. K., Testi, L., et al. 2011, A&A, 525, A81
- Ricci et al. (2010a) Ricci, L., Testi, L., Natta, A., & Brooks, K. J. 2010a, A&A, 521, A66
- Ricci et al. (2010b) Ricci, L., Testi, L., Natta, A., et al. 2010b, A&A, 512, A15
- Ricci et al. (2012) Ricci, L., Trotta, F., Testi, L., et al. 2012, A&A, 540, A6
- Rodmann et al. (2006) Rodmann, J., Henning, T., Chandler, C. J., Mundy, L. G., & Wilner, D. J. 2006, A&A, 446, 211
- Segura-Cox et al. (2015) Segura-Cox, D. M., Looney, L. W., Stephens, I. W., et al. 2015, ApJ, 798, L2
- Stephens et al. (2014) Stephens, I. W., Looney, L. W., Kwon, W., et al. 2014, Nature, 514, 597
- Tamura et al. (1999) Tamura, M., Hough, J. H., Greaves, J. S., et al. 1999, ApJ, 525, 832
- Tamura et al. (1995) Tamura, M., Hough, J. H., & Hayashi, S. S. 1995, ApJ, 448, 346
- Testi et al. (2001) Testi, L., Natta, A., Shepherd, D. S., & Wilner, D. J. 2001, ApJ, 554, 1087
- Warren & Brandt (2008) Warren, S. G. & Brandt, R. E. 2008, Journal of Geophysical Research (Atmospheres), 113, D14220
- Whipple (1972) Whipple, F. L. 1972, in From Plasma to Planet, ed. A. Elvius, 211
- Wilner et al. (2005) Wilner, D. J., D’Alessio, P., Calvet, N., Claussen, M. J., & Hartmann, L. 2005, ApJ, 626, L109
- Yang et al. (2016) Yang, H., Li, Z.-Y., Looney, L., & Stephens, I. 2016, MNRAS, 456, 2794
- Youdin & Lithwick (2007) Youdin, A. N. & Lithwick, Y. 2007, Icarus, 192, 588
- Zhu et al. (2012) Zhu, Z., Nelson, R. P., Dong, R., Espaillat, C., & Hartmann, L. 2012, ApJ, 755, 6
- Zubko et al. (1996) Zubko, V. G., Mennella, V., Colangeli, L., & Bussoletti, E. 1996, MNRAS, 282, 1321