CALET Upper Limits on X-ray and Gamma-ray Counterparts of GW 151226111Corresponding authors: T. Sakamoto, S. Nakahira and Y. Asaoka
Abstract
We present upper limits in the hard X-ray and gamma-ray bands at the time of the LIGO gravitational-wave event GW 151226 derived from the CALorimetric Electron Telescope (CALET) observation. The main instrument of CALET, CALorimeter (CAL), observes gamma-rays from 1 GeV up to 10 TeV with a field of view of 2 sr. The CALET gamma-ray burst monitor (CGBM) views 3 sr and 2 sr of the sky in the 7 keV - 1 MeV and the 40 keV - 20 MeV bands, respectively, by using two different scintillator-based instruments. The CGBM covered 32.5% and 49.1% of the GW 151226 sky localization probability in the 7 keV - 1 MeV and 40 keV - 20 MeV bands respectively. We place a 90% upper limit of erg cm-2 s-1 in the 1 - 100 GeV band where CAL reaches 15% of the integrated LIGO probability (1.1 sr). The CGBM 7 upper limits are erg cm-2 s-1 (7-500 keV) and erg cm-2 s-1 (50-1000 keV) for one second exposure. Those upper limits correspond to the luminosity of - erg s-1 which is significantly lower than typical short GRBs.
=1 \fullcollaborationNameThe Friends of AASTeX Collaboration
1 Introduction
The first gravitational-wave detection by the Laser Interferometer Gravitational-Wave Observatory (LIGO) on GW 150914 confirmed the existence not only of gravitational waves from astronomical objects but also of a binary black hole system with several tens of solar masses (Abbott et al., 2016a). Based solely on the gravitational-wave signals recorded by two LIGO detectors, the current hypothesis is that GW 150914 was the result of a merger of two black holes with initial masses of and at the luminosity distance of Mpc. The Fermi Gamma-ray Burst Monitor (Fermi-GBM) reported a possible weak gamma-ray transient source above 50 keV at 0.4 s after the GW 150914 trigger (Connaughton et al., 2016). However, the upper limit provided by the INTEGRAL ACS instrument in a gamma-ray energy band similar to the Fermi-GBM energy band is not consistent with a possible gamma-ray counterpart of GW 150914 suggested by the Fermi-GBM (Savchenko et al., 2016). No electromagnetic counterpart of GW 150914 was found in radio, optical, near-infrared, X-ray and high-energy gamma-ray (Abbott et al., 2016b).
GW 151226 (LIGO-Virgo trigger ID: G211117) is the 2nd gravitational-wave candidate identified by both LIGO Hanford Observatory and LIGO Livingston Observatory with a high significance (the false alarm rate of less than one per 1000 years by the on-line search) at 3:38:53.647 UT on December 26, 2015 (Abbott et al., 2016c). According to a Bayesian parameter estimation analysis, the event is very likely a binary black hole merger with initial black hole masses of and , and final black hole mass of (Abbott et al., 2016d). The luminosity distance of the source is estimated as Mpc which corresponds to a redshift of . As far as the electromagnetic counterpart search of GW 151226 in the gamma-ray regime is concerned, Fermi-GBM (Burns et al., 2015), Fermi Large Area Telescope (LAT) (Vianello et al., 2016), High-Altitude Water Cherenkov Observatory (HAWC) (Wood et al., 2016), and Astrosat-CZTI (Bhalerao et al., 2016) reported no detections around the GW trigger time. According to Racusin et al. (2016), the flux upper limit of Fermi-GBM is from 10-7 erg cm-2 s-1 to 10-7 erg cm-2 s-1 in the 10-1000 keV band. The Fermi-LAT flux upper limit using the first orbit data after the LIGO trigger is from erg cm-2 s-1 to erg cm-2 s-1 in the 0.1-1 GeV band.
The CALorimetric Electron Telescope (CALET; Torii et al. (2015); Asaoka et al. (2015)) mission, which was successfully launched and emplaced on the Japanese Experiment Module - Exposed Facility (JEM-EF) of the International Space Station (ISS) in August 2015, was fully operational at the time of GW 151226. CALET consists of two scientific instruments. The Calorimeter (CAL) is the main instrument which is capable of observing high energy electrons from 1 GeV to 20 TeV, protons, helium and heavy nuclei from 10 GeV to 1000 TeV, and gamma-rays from 1 GeV to 10 TeV. The field of view (FOV) of CAL is from the zenith direction. Another instrument, CALET Gamma-ray Burst Monitor (CGBM; Yamaoka et al. (2013)), is a gamma-ray burst (GRB) monitor using two different kind of scintillators (LaBr3(Ce) and BGO) to achieve a broad energy coverage. The Hard X-ray Monitor (HXM) using LaBr3(Ce) covers the energy range from 7 keV up to 1 MeV, and two identical modules are equipped in the same direction in CALET. The Soft Gamma-ray Monitor (SGM) based on BGO covers the energy range from 40 keV to 20 MeV. The FOV of HXM and SGM are and from the boresight respectively. The CGBM has been detecting GRBs at an average rate of 3-4 events per month.
Around the trigger time of GW 151226, CALET was performing regular scientific data collection. Between 3:30 and 3:43 UT, the CAL was operating in the low-energy gamma-ray mode, which is an operation mode with a lower energy threshold of 1 GeV. The high voltages of CGBM were set at the nominal values around 3:20 UT and turned off around 3:40 UT to avoid high background radiation area. There was no CGBM on-board trigger at the trigger time of GW 151226.
2 Observation
2.1 CGBM Data Analysis and Results
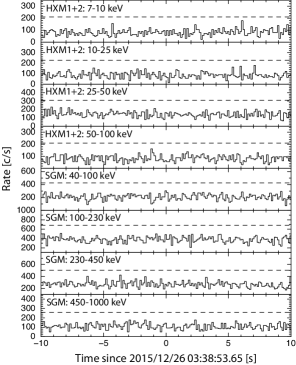
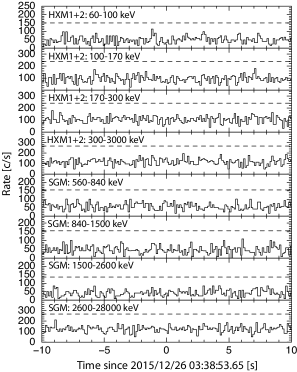
At 3:38 UT, the CGBM was operating in nominal operational mode in which continuous light curve data in 0.125 s time resolution were recorded at eight different energy bands for each instrument. The boresight directions of HXM and SGM were (R.A., Dec.) (J2000) = (35.6∘, ) and (43.5∘, ) at the onset of GW 151226. Around the GW 151226 event time, no CGBM on-board trigger occurred. Therefore, the available data to investigate the possible counterpart are the continuous light curves mentioned above. If there is the on-board trigger, the time-tagged event data with 62.5 s resolution will be generated. Figure 1 shows the light curves in the 0.125 s time bins in the time range between 10 s from the GW 151226 trigger time. As seen in the figure, no significant excess is seen in the CGBM data around the trigger time. We calculate the signal-to-noise ratio (SNR) in sliding the time bins of the light curves by selecting the background interval as 8 s, 16 s, 32 s and 64 s and the foreground interval as 0.125 s, 0.25 s, 0.5 s, 1 s and 4 s. The SNR is calculated as, where is the counts in the foreground interval, is the integration time of the foreground interval, is the counts in the background interval and is the integration time of the background interval. The background interval is always prior to the foreground interval and there is no time gap between the background and the foreground interval. We searched the light curve data for finding signals of individual instruments (HXM1, HXM2 and SGM) and the sum of the HXM1 and the HXM2. The searched energy bands are all the combinations of 7-10 keV, 10-25 keV, 25-50 keV, 50-100 keV for the high-gain data and 60-100 keV, 100-170 keV, 170-300 keV and 300-3000 keV for the low-gain data of the HXM. In the SGM, 40-100 keV, 100-230 keV, 230-450 keV and 450-1000 keV for the high-gain data and 560-840 keV, 840-1500 keV, 1.5-2.6 MeV and 2.6-28 MeV for the low-gain data are investigated. The highest SNR between 10 s window is 4.7 at 7.5 s after the LIGO trigger in the 7-10 keV band of the HXM1 (the 1 s foreground and the 16 s background interval). Using 38,900 trials the false-detection probability at the level of 4.7 was evaluated as 0.02 which is too high to claim a detection. In the HXM2 data, the SNR of the same time bin in which the highest SNR is found in HXM1 data is . The highest SNR is still found in the same time bin even if we extend the search window up to 60 s. Therefore, we concluded that there are no significant signals in the CGBM data associated with the gravitational-wave event. Note that, however, our search is limited by the available continuous light curve data in the 0.125 s time resolution and might not be sensitive to an event with duration shorter than 0.125 s.
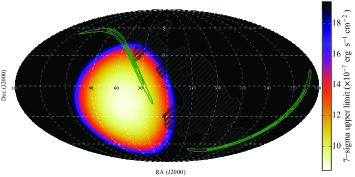
The flux upper limits of HXM and SGM are evaluated by using a CGBM Monte-Carlo simulator based on the GEANT4 software package. The simulations are performed by emitting the photons at incident angles from 0∘ to 110∘ in 1∘ steps with respect to the detector. The source spectrum assumes following two cases. The first case is a typical GRB spectrum for the BATSE short GRBs (s-GRBs). In this case, we use the averaged BATSE s-GRB spectral parameters in a cutoff power-law model222f(E) ) reported by Ghirlanda et al. (2009), with a photon index of and = 355 keV. The second case is the Crab-like spectrum: a power-law with a photon index of . The background spectrum is estimated using the real data over three days around the event in count space, normalized to the actual background level at the trigger time. The background variation was rather stable since the CGBM was not operated at the high background regions such as a high longitude and the South Atlantic Anomaly. The gain differences during those three days were less than 3% for both the HXM and the SGM data. The exposure time of the input and the background spectrum is one second. The source flux is evaluated to be in a range from to erg cm-2 s-1. The energy ranges for calculating the upper limits are determined as the best energy band to detect typical BATSE s-GRBs: 7-500 keV for HXM and 50-1000 keV for SGM. We also include the systematic uncertainties in the detector energy response function in the estimations of the upper limits of each detector. This systematic uncertainty is a correction factor of 2 in the effective area for taking into account the current calibration uncertainty at the incident angle between the on-axis and the far off-axis case. The sky maps of the 7 upper limit overlaid with the shadow of ISS are shown in figure 2. The 7 threshold is the same setup parameter as the on-board trigger system. The upper limits assuming the typical BATSE s-GRB spectrum for the HXM and the SGM are 1.0 erg cm-2 s-1 (7-500 keV) at the incident angle of 30∘ and 1.8 erg cm-2 s-1 (50-1000 keV) at the incident angle of 45∘, respectively. The incident angle of of HXM corresponds to a half angle of the FOV from the boresight. Whereas, SGM reaches to its maximum effective area at the incident angle of . In the case of the Crab-like spectrum, the 7 upper limits of the HXM and the SGM are 5.1 erg cm-2 s-1 (7-500 keV) at 30∘ off-axis and 1.4 erg cm-2 s-1 (50-1000 keV) at 45∘ off-axis.
Our upper limits correspond to the k-corrected luminosity of erg s-1 for HXM and erg s-1 for SGM in the 1 keV - 10 MeV band at the rest frame using the luminosity distance of 440 Mpc and assuming a typical BATSE s-GRB spectrum. The isotropic-equivalent luminosity of s-GRBs is in the range from erg s-1 to erg s-1 with the mean of erg s-1 (Berger, 2014). Therefore, if s-GRBs occur within 440 Mpc, CGBM could detect a signal from a majority of s-GRBs.
The CGBM coverage of the LIGO sky probability is estimated as follows. First, we define the sky region by adding the probability of each pixel of the LIGO probability map (LALInference_skymap_2.fits) from the highest pixel until the summed probability reaches a 90% level. Then, the pixel values inside the overlapping region between this 90% LIGO probability map and the FOV of CGBM are integrated to estimate the LIGO summed probabilities. Furthermore, the shadow due to the ISS structure is taken into account for the estimation of SGM. The coverages of the summed LIGO probability are estimated as 32.5% for HXM and 49.1% for SGM.
| HXM (7-500 keV; 30∘ off-axis) | SGM (50-1000 keV; 45∘ off-axis) | |
|---|---|---|
| s-GRB | erg cm-2 s-1 | erg cm-2 s-1 |
| Crab-like | erg cm-2 s-1 | erg cm-2 s-1 |
2.2 CAL Data Analysis and Results
A search for gamma-ray events associated with GW 151226 was carried out using the CAL data in the time interval from s to s around the LIGO trigger. The CAL was operational in low-energy gamma-ray mode in which the energy threshold is 1 GeV (compared to 10 GeV in high-energy mode) in this time period. We apply a gamma-ray selection by tracking pair creation events in the imaging calorimeter (Mori et al., 2013). The gamma-ray event selection used in this analysis is basically the same as the one of Mori et al. (2013) although a stronger cut was applied by requiring three or more hits for track reconstruction. This ensures a higher tracking quality in exchange for a reduction of 1 radiation-length in conversion materials (Tungsten) usable for pair creation in the imaging calorimeter. According to the simulation study which is generated events around the instrument isotropically, we estimate the highest gamma-ray efficiency is achieved around 10 GeV with an efficiency of 50% relative to a geometrical factor of 420 cm2 sr, which is the 100% efficiency case, by applying the event selections described above. The effective areas for incident angles of 0∘, 20∘ and 30∘ are 74 cm2, 44 cm2, and 17 cm2 at 1 GeV, respectively. The effective areas are increasing with energy and reach around 10 GeV their maxima of 260 cm2, 180 cm2 and 80 cm2 for incident angles of 0∘, 20∘ and 30∘, respectively. Our long-term CAL observation of galactic diffuse gamma-rays in the low-energy gamma-ray mode clearly identified a peak at the galactic equator on the count map as a function of the galactic latitude. This matches the expectation estimated based on a galactic diffuse radiation model (Acero et al., 2016) when considering above mentioned effective areas and observation exposure. As a result, it was proven that the CALET observation in low-energy gamma-ray mode has achieved detection of the galactic diffuse gamma-rays. Since the searched location for the GW 151226 counterpart is significantly far from the galactic plane, the number of background gamma-rays is negligibly small, 0.0024 events according to the calculation based on the model of Acero et al. (2016). Another expected background might, however, result from misidentification of cosmic-ray events at lower energies. The number of such events in the time-window of the GW 151226 counterpart search is also estimated using the diffuse gamma-ray model in comparison with the observed data. A conservative upper limit of this background is obtained by the assumption that all of the excess in observed data to the model originates from the background. Then, the possibility of such a misidentification is confirmed to be less than 0.035 events. Therefore, the CAL observation is virtually background free in such a short time window. We found no gamma-ray candidate inside this time window with negligible contamination from other events.
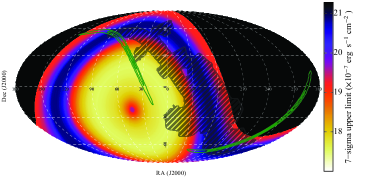
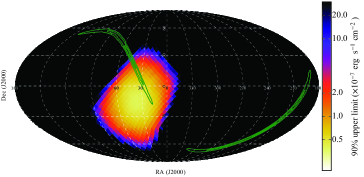
The upper limit of the CAL observation in this 736 s long period is estimated as follows. First, we calculated the effective area and the resultant exposure map in the time window for the 1-100 GeV band. At lower energies, the effective area gradually decreases below 10 GeV and reaches zero around 500 MeV. Next, we estimated the limiting flux corresponding to 2.44 events, which is the 90% confidence limit for null observation, assuming a single power-law model with a photon index of by applying the estimated exposure map. The assumed photon index of is a typical photon index of the Fermi-LAT GRBs in the GeV energy range (Ackermann et al., 2013). Figure 3 shows the sky map of the flux upper limit at 90% confidence level. The estimated 90% upper limit is erg cm-2 s-1 in the 1 - 100 GeV band where CAL reaches 15% of the integrated LIGO probability (1.1 sr). The CAL upper limit in luminosity is estimated as erg s-1 for a source distance of 440 Mpc. The flux upper limit in the same energy band as reported by Fermi-LAT of 0.1-1 GeV (Racusin et al., 2016) is calculated to be erg cm-2 s-1 extrapolating a single power-law spectrum with a photon index of .
We would like to thank the anonymous referee for comments and suggestions that materially improved the paper. We gratefully acknowledge JAXA’s contributions for CALET development and operation on ISS. We express our sincere thanks to ASI and NASA for their support to the CALET project. This work is partially supported by JSPS Grant-in-Aid for Scientific Research (S) Number 26220708 and MEXT-Supported Program for the Strategic Research Foundation at Private Universities (2011-2015) S1101021 in Waseda University. This work is also supported in part by MEXT Grant-in-Aid for Scientific Research on Innovative Areas Number 24103002. US CALET work is supported by NASA under RTOP 14-APRA14-0075 (GSFC) and grants NNX16AC02G (WUSL), NNX16AB99G (LSU), and NNX11AE06G (Denver).
References
- Abbott et al. (2016a) Abbott, B.P., Abbott, R., Abbott, T.D., et al. 2016a, PhRvL, 116, 061102
- Abbott et al. (2016b) Abbott, B.P., Abbott, R., Abbott, T.D., et al. 2016b, ApJL in press
- Abbott et al. (2016c) Abbott, B.P., Abbott, R., Abbott, T.D., et al. 2016c, PhRvL, 116, 241103
- Abbott et al. (2016d) Abbott, B.P., Abbott, R., Abbott, T.D., et al. 2016d, arXiv:1606.04856
- Acero et al. (2016) Acero, F., Ackermann, M., Ajello, M., et al. 2016, ApJS, 223, 26
- Ackermann et al. (2013) Ackermann, M., Ajello, M., Asano, K., et al. 2013, ApJS, 209, 11
- Asaoka et al. (2015) Asaoka, Y., the CALET Collaboration, PoS (ICRC2015) 603
- Berger (2014) Berger, E., 2014, Annual Review of Astronomy and Astrophysics, 52, 43
- Bhalerao et al. (2016) Bhalerao, V., Bhattacharya, D., Vibhute, A., et al. 2016, GCN Circ. 19401
- Burns et al. (2015) Burns, E., Blackburn, L., Briggs, M. S., et al. 2015, GCN Circ. 18741
- Connaughton et al. (2016) Connaughton, V., Burns, E., Goldstein, A., et al. 2016, arXiv:1602.03920
- Ghirlanda et al. (2009) Ghirlanda, G., Nava, L., Ghisellini, G., Celotti, A., Firmani, C., 2009, A&A, 496, 585
- Mori et al. (2013) Mori, M., the CALET Collaboration, 33rd International Cosmic Ray Conference (Rio de Janeiro, Brasil), 2013
- Racusin et al. (2016) Racusin, J.L., Burns, E., Goldstein, A., et al. 2016, arXiv:160604901
- Savchenko et al. (2016) Savchenko, V., Ferrigno, C., Mereghetti, S., et al. 2016, ApJ, 820, 36
- Torii et al. (2015) Torii, S., the CALET Collaboration, PoS (ICRC2015) 581
- Vianello et al. (2016) Vianello, G., Razzano, M., Omodei, N., et al. 2016, GCN Circ. 18813
- Wood et al. (2016) Wood, J., et al. 2016, GCN Circ. 19156
- Yamaoka et al. (2013) Yamaoka K., Yoshida, A., Sakamoto, T. et al. 2013, 7th Huntsville Gamma-Ray Burst Symposium, GRB 2013: paper 41 in eConf Proceedings C1304143