Oxygen, -element and iron abundance distributions in the inner part of the Galactic thin disc. II ††thanks: Based on observations obtained at the Canada-France-Hawaii Telescope (CFHT), which is operated by the National Research Council of Canada, the Institut National des Sciences de l’Univers of the Centre National de la Recherche Scientifique of France, and the University of Hawaii.
Abstract
We have derived the abundances of 36 chemical elements in one Cepheid star, ASAS 181024–2049.6, located R kpc from the Galactic center. This star falls within a region of the inner thin disc poorly sampled in Cepheids. Our spectral analysis shows that iron, magnesium, silicon, calcium and titanium LTE abundances in that star support the presence of a plateau-like abundance distribution in the thin disc within 5 kpc of the Galactic center, as previously suggested by Martin et al. (2015). If confirmed, the flattening of the abundance gradient within that region could be the result of a decrease in the star formation rate due to dynamic effects, possibly from the central Galactic bar.
keywords:
stars: abundances – stars: Cepheids – Galaxy: evolution1 Introduction
In our recent paper on oxygen and -element abundances derived from the spectra of Cepheids situated in the vicinity of the Galactic center (Martin et al., 2015), we showed that the abundance distribution across the Galaxy is complex. Globally, chemical abundances increase from the outer part of the Galactic disc towards the Galactic center. However, the distribution reaches an apparent maximum at about RG 5 kpc, forming a kind of plateau-like structure, and with a possible gradual decrease of abundances toward the inner central zone. Nevertheless, this flattening in the abundance distribution in the inner Galactic disc has not been firmly demonstrated yet since our study was incomplete to some extent: in that earlier paper, no Cepheids were studied between the Galactic center and a distance of RG 3 kpc. We also relied on other spectral data from the literature to assess the abundances at the very center of the Galaxy.
It is difficult to find Cepheid stars in the inner disc for conducting our spectroscopic
analysis. But, after a careful inspection of the literature data on new Cepheid candidates situated toward
the Galactic center, we have selected four possible stars listed in Table 1.
| ASAS Star | P, d | RA | DEC | RG [kpc] | |
|---|---|---|---|---|---|
| 175621-2738.0 | 16.33 | 11.69 | 17 56 21.4 | -27 37 55 | 1.93 |
| 181024-2049.6 | 24.43 | 13.52 | 18 10 23.7 | -20 49 28 | 2.53 |
| 183406-1519.1 | 9.22 | 9.24 | 18 34 05.4 | -15 19 10 | 2.70 |
| 193435-1921.7 | 2.12 | 13.02 | 19 34 34.6 | -19 21 40 | 2.93 |
2 Observations and data reduction
We observed our stars with the 3.6-m Canada–France–Hawaii Telescope (CFHT), on July 6, 2015. The observations were carried out under the queue observing mode using the fiber-fed ESPaDOnS echelle spectrograph equipped with an e2v 2048 x 4608 CCD (binned 1 x 1). The resolving power provided by this combination was about 80000 and the spectral range extended from 3700 to 10500 Å. The spectra were processed by the CFHT ESPaDOnS pipeline. The estimated S/N ratio at the continuum level depends upon the wavelength interval; typically this value is close to 100. Exposure times varied from 160, 1700 to 2400 seconds, from the brightest to faintest targets.
The processing of the spectra (continuum level determination, equivalent width measurements etc.) was carried out by using the DECH20 software package (Galazutdinov, 1992). The list of spectral lines is the same as used in our previous studies (see Kovtyukh & Andrievsky 1999).
After the preliminary spectra processing, we discovered that three of our program stars (ASAS 175621-2738.0, ASAS 183406-1519.1 and ASAS 193435-1921.7) showed a very strong emission feature in their H absorption profiles. This characteristic is considered to be a sure sign of W Vir variable type stars (see, e.g. Schmidtet al. 2004). Thus these three stars were discarded from this study; they will be analysed in another paper. The H profile for ASAS 181024–2049.6 is free of this type of emission and the light curve of this star in V band is typical of classic Cep type stars (868 data points with a good phase coverage, see ASAS database). Additional support for this classification is ASAS 181024-2049.6’s small Galactic latitude ().
3 Stellar atmosphere parameters
The effective temperature (Teff) of ASAS 181024–2049.6 was estimated by calibrating the ratios of the central depths of the lines with different potentials at the lower levels (see Kovtyukh 2007). This method gives an error in the temperature of about K (error of the mean is 20 K with 50 calibrating relations used). The surface gravity was computed using the iron ionization balance. It produces uncertainty in the gravity measurement of about dex. The microturbulent velocity was found by avoiding any dependence between the iron abundance as produced by individual Fe II lines and their equivalent widths. Error in the Vt value is about km s-1. The resulting atmosphere parameters for ASAS 181024–2049.6 are listed in Table 2.
It should be noted that ASAS lists period of this star P= 24.43288 d and epoch of Max = 2029.5 that leads to estimated phase of 0.026 at the date of observation, but this is in conflict with our spectroscopic estimate of Teff = 5100 K, which is apparently too low for the phase near the maximum light. The reason for this discrepancy could be the wrong light elements for this star in ASAS database, or pulsation period change. No information about the possible period change for this stars is available in the literature.
| Star | JD | V (ASAS) | Teff [K] | Vkm s | E(B–V) | RG [kpc] | |
|---|---|---|---|---|---|---|---|
| ASAS 181024–2049.6 | 2457209.9111 | 13.525 | 5113 | 1.4 | 3.1 | 1.41 | 2.53 |
Remark: the reddening value was found using a special method (see Sect. 5).
4 Spectroscopic analysis
All abundances listed in Table 3 (with the exception of oxygen, sulfur and barium) were derived in the LTE approximation in order to be consistent with our previous abundance determinations in Cepheids. For this we used the ATLAS9 code (Kurucz, 1992) to generate the appropriate atmosphere models, and Kurucz’s WITH9 code to analyze the equivalent widths. For comparison we used the solar chemical composition from Grevesse et al. (1996).
In Martin et al. (2015) we derived the NLTE abundance distributions for O, S and Ba for all our program Cepheids (new stars and those previously investigated by Luck et al. 2013, Andrievsky et al. 2013, Korotin et al. 2014, Andrievsky et al. 2014). All the details concerning the calculation method of the NLTE calculations and the atomic models as applied for oxygen, sulfur and barium can be found in those papers.
| Ion | [A/H] | NoL | (A/H) | |
|---|---|---|---|---|
| 6.00 | 0.02 | 0.02 | 2 | 8.57 |
| 7.00 | 0.66 | 0.03 | 2 | 8.63 |
| 8.00* | 0.46 | 0.12 | 5 | 9.17 |
| 11.00 | 0.93 | 0.00 | 1 | 7.26 |
| 12.00 | 0.49 | 0.11 | 3 | 8.07 |
| 13.00 | 0.60 | 0.04 | 4 | 7.07 |
| 14.00 | 0.46 | 0.07 | 29 | 8.01 |
| 14.01 | 0.45 | 0.08 | 2 | 8.00 |
| 16.00* | 0.44 | 0.15 | 8 | 7.60 |
| 20.00 | 0.34 | 0.16 | 4 | 6.70 |
| 21.00 | 0.35 | 0.11 | 4 | 3.52 |
| 21.01 | 0.39 | 0.09 | 5 | 3.56 |
| 22.00 | 0.39 | 0.10 | 52 | 5.41 |
| 22.01 | 0.47 | 0.11 | 2 | 5.49 |
| 23.00 | 0.46 | 0.07 | 28 | 4.46 |
| 23.01 | 0.37 | 0.07 | 4 | 4.37 |
| 24.00 | 0.41 | 0.09 | 28 | 6.08 |
| 24.01 | 0.16 | 0.13 | 6 | 5.83 |
| 25.00 | 0.54 | 0.15 | 8 | 5.93 |
| 26.00 | 0.44 | 0.07 | 202 | 7.94 |
| 26.01 | 0.44 | 0.08 | 29 | 7.94 |
| 27.00 | 0.43 | 0.11 | 32 | 5.35 |
| 28.00 | 0.35 | 0.04 | 26 | 6.60 |
| 29.00 | 0.57 | 0.00 | 1 | 4.78 |
| 37.00 | 0.38 | 0.00 | 1 | 2.98 |
| 38.00 | 0.54 | 0.00 | 1 | 3.44 |
| 39.01 | 0.30 | 0.24 | 6 | 2.54 |
| 40.00 | 0.31 | 0.09 | 3 | 2.91 |
| 40.01 | 0.33 | 0.11 | 4 | 2.93 |
| 56.01* | 0.70 | 0.15 | 3 | 2.87 |
| 57.01 | 0.29 | 0.17 | 3 | 1.51 |
| 58.01 | 0.16 | 0.06 | 7 | 1.71 |
| 59.01 | 0.19 | 0.18 | 3 | 0.90 |
| 60.01 | 0.15 | 0.09 | 6 | 1.65 |
| 63.01 | 0.53 | 0.00 | 1 | 1.04 |
| 64.01 | 0.33 | 0.00 | 1 | 1.45 |
Remarks:
– NLTE abundances,
A/H – relative-to-solar abundance of element,
NoL – number of lines,
(A/H) – absolute abundance of element with respect to A(H)=12.00
.
5 Results and discussion
In Fig. 1 we show the iron abundance distribution of Galactic Cepheids from all of our previous studies together with the Galactic center abundances as described in Martin et al. (2015). In order to include ASAS 181024-2049.6 in this plot, we first need its heliocentric distance. Unfortunately, the E(B–V) value for this star is currently unknown. To overcome this problem we applied the method of the colour excess determination based on the use of the E(B–V) – EW(DIB) calibrating relation from Friedman (2011). Here EW(DIB) is the equivalent width of the 6613 Å diffuse interstellar band (DIB), which is also seen in Cepheid spectra. Using this relation, we find that the E(B–V) value for ASAS 181024-2049.6 is equal to 1.41. Combining the approximate relation Av = E(B–V)/3.2, the ”absolute magnitude–pulsational period” relation of Gieren et al. (1998), and the mean V magnitude from Table 2, we find a heliocentric distance pc, and Galactocentric distance R kpc.
With this Galactocentric distance, our program star falls within a very critical, under-sampled region of the inner disc of the Milky Way. Using that star and our Cepheid spectral analysis, we can better assess the distribution of abundances within the inner 3 kpc, as first explored by Martin et al. (2015). As one can infer from the plot, at Galactocentric distances less than 5–6 kpc, the iron abundance distribution seems to form a plateau-like structure. From our restricted data one can conclude that the maximal iron abundance in the thin disc perhaps reaches about +0.4 dex. New data could change this value, but the global behavior of the iron distribution in the disc is unlikely to be affected very much.
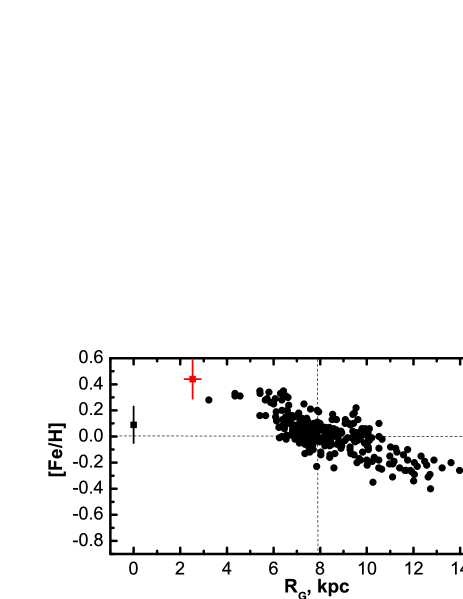

: The same as in the upper plot but for binned data for the radial extent of the disc containing the bulk of the Cepheids. Our program star and the black circle at the center of the Galaxy were simply connected with a dashed line.
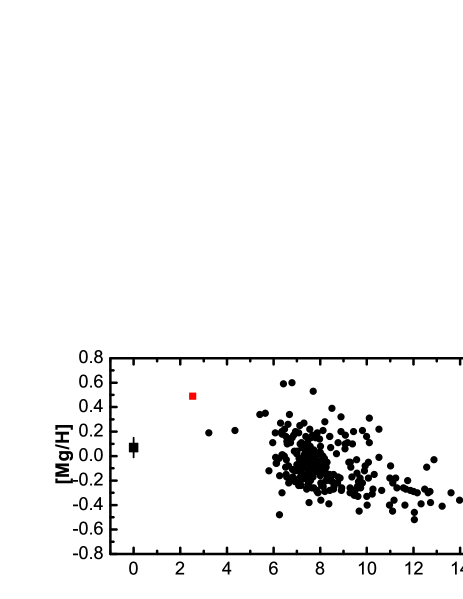
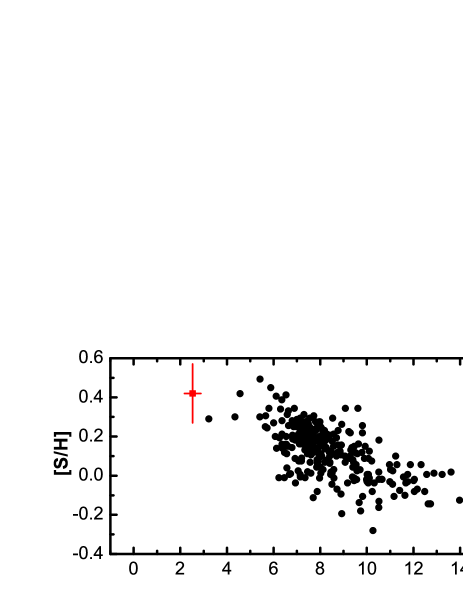
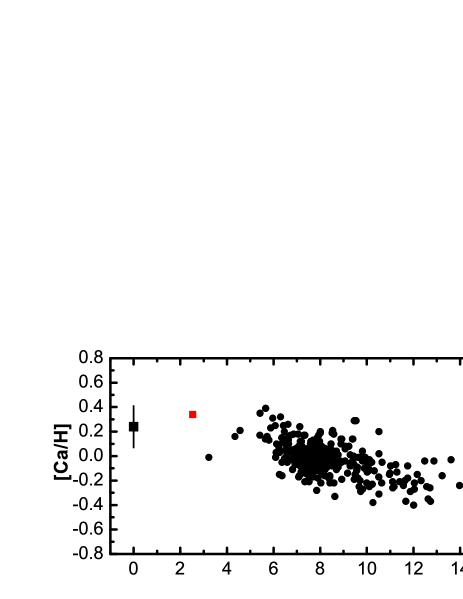
The same conclusion can also be made for other elements such as oxygen, magnesium, silicon, sulfur, calcium and titanium (see Fig. 2 and 3).


The fact that the metallicity flattens or decreases when moving from a radius of 5 kpc to the inner region should not be a surprise, although it does not fit a simple extrapolation of the gradient seen in the the 5-9 kpc range. All the chemical evolution models (see eg. Lacey & Fall 1985, Chiappini, Matteucci & Gratton 1997, Matteucci 2008) state that for a given Galactocentric radius, the rate of enrichment of metallicity is proportional to the star formation rate, (t). The reason is that the chemical enrichment is due to the material restituted by the stars to the Interstellar Medium (ISM) at the end of their lives. More massive stars have shorter lives and provide the most efficient contribution. If is large, the number of massive stars formed per unit time is large, keeping the mass function constant, and the amount of enriched matter restituted to the ISM is large.
In addition to the metallicity enrichment, controls the number of existing stars in the thin disc. The stellar density is the result of the integration of the star formation rate over the lifetime of the disc. Of course, the most massive stars disappear along this process, but the less massive ones, which are the majority, remain there. Consequently, in a first approximation, ignoring the merging of dwarf galaxies for instance, the stellar density and metallicity remain proportional. We argue that the metallicity decreases towards the center for the same reason that the stellar density is smaller, that is because is smaller in that region than at larger radii along the history of disc formation.
In the past, models of the stellar density along the disc assumed a simple exponential decrease of the stellar density along the disc, with scale-lengths of 2-4 kpc. Inversely, this would imply quite a large density in the central regions. However, the large density of stars in the central region is due to another Galactic component, the bulge. The component that interests us here is the thin (or young) disc, to which the Cepheids belong. Several decades ago, mathematical expressions based on fitting brightness profiles of external galaxies were proposed for instance by Freeman (1970) and Kormendy (1977). These expressions describe galactic discs in which the disc component decreases both towards the center and towards the outer regions, presenting a maximum at an intermediate radius. A recent star count model by Polidoet al. (2013) of our Galaxy was extensively verified by comparisons with the 2MASS catalogue. In this model the thin disc is represented by a modified exponential as suggested by Kormendy, with a decrease of density towards the center.
Why has the star formation rate been smaller in the inner kpc of the Galaxy thin disc? One possible reason is the lower density of gas available. In the CO survey of the Galactic disc by Dame et al. (1987), the authors show the profile of column density as a function of the galactic longitude, which presents peaks at longitudes 30∘ and 330∘ approximately (see their Figure 6). These longitudes correspond to tangential directions of a circle of 4 kpc from the center (8()). Inside this circle there is a minimum at about . This is interpreted as a molecular ring of maximum gas density, which extends to longitude 320∘ (radius 5 kpc)(see Dame et al. 1987, Figure 6). Although this is not strictly a ring, it is a clear indication that there is a maximum density of gas at about 4–5 kpc and then a lower density inside this region. The lower gas density in the inner region is probably connected to the presence of the bar, a structure that possibly produces a flow of gas towards the Galactic center.
Acknowledgements
SMA and SAK acknowledge the SCOPES grant No. IZ73Z0–152485 for financial support. We acknowledge the discretionary time allocated by Director D. Simons and the queue observing team at CFHT. Authors are also thankful to the anonymous referee for his/her valuable comments.
References
- Andrievsky et al. (2013) Andrievsky, S.M., Lépine, J.R.D., Korotin, S.A., Luck, R.E., Kovtyukh, V.V., & Maciel, W.J., 2013, MNRAS, 428, 3252
- Andrievsky et al. (2014) Andrievsky, S.M., Luck, R.E., & Korotin, S.A., 2014, MNRAS, 437, 2106
- Chiappini, Matteucci & Gratton (1997) Chiappini, C.; Matteucci, F.; Gratton, R., 1997, ApJ, 477, 765
- Dame et al. (1987) Dame, T. M.; Ungerechts, H.; Cohen, R. S.; de Geus, E. J.; Grenier, I. A.; May, J.; Murphy, D. C.; Nyman, L.-A.; Thaddeus, P., 1987, ApJ, 322, 706
- Freeman (1970) Freeman K. C., 1970, ApJ, 160, 811
- Friedman (2011) Friedman, Scott D.; York, Donald G.; McCall, Benjamin J.; Dahlstrom, Julie; Sonnentrucker, Paule; Welty, Daniel E.; Drosback, Meredith M.; Hobbs, L. M.; Rachford, Brian L.; Snow, Theodore P., 2011, ApJ 727, 33
- Galazutdinov (1992) Galazutdinov, G. A., 1992, Preprint SAO RAS, No. 92
- Gieren et al. (1998) Gieren, W. P., Fouqué, P., Gómez, M. 1998, ApJ, 496, 17
- Grevesse et al. (1996) Grevesse N., Noels A., Sauval J., 1996, ASP Conf. Ser. 99, 117
- Kashuba (2016) Kashuba, S.V., Andrievsky, S.M., Chekhonadskikh, F.A., Luck, R.E., Kovtyukh, V.V., Korotin, S.A., Krelowski J., 2016, in preparation
- Kormendy (1977) Kormendy J., 1977, ApJ, 217, 406
- Korotin et al. (2014) Korotin, S.A., Andrievsky, S.M., Luck, R.E., et al., 2014, MNRAS, 444, 3301
- Kovtyukh (2007) Kovtyukh, V.V., 2007, MNRAS, 378, 617
- Kovtyukh & Andrievsky (1999) Kovtyukh, V.V., & Andrievsky, S.M., 1999, A&A, 351, 597
- Kurucz (1992) Kurucz, R. L. 1992, in The Stellar Populations of Galaxies, ed. B. Barbuy, & A. Renzini, IAU Symp. 149, 225
- Lacey & Fall (1985) Lacey, C.G., Fall, S.M., 1985, ApJ 290, 154
- Luck et al. (2013) Luck, R.E., Andrievsky, S.M., Korotin, S.N., & Kovtyukh, V.V., 2013, AJ, 146, 18
- Martin et al. (2015) Martin R.P., Andrievsky S.M., Kovtyukh V.V., Korotin S.A., Yegorova I.A., Saviane Ivo, 2015, MNRAS 449, 4071
- Matteucci (2008) Matteucci, F., 2008, IAUS 250, 391
- Polidoet al. (2013) Polido, P., Jablonski, F., Lépine, J. R. D., 2013, ApJ, 778, 32
- Schmidtet al. (2004) Schmidt E.G., Johnston D., Lee K.M., Langan S., Newman P.R., Snedden S.A., 2004, ApJ 128, 2988