Probing the interstellar medium and star formation of the Most Luminous Quasar at z=6.3
Abstract
We report new IRAM/PdBI, JCMT/SCUBA-2, and VLA observations of the ultraluminous quasar SDSSJ010013.02+280225.8 (hereafter, J0100+2802) at z=6.3, which hosts the most massive supermassive black hole (SMBH) of known at z6. We detect the [C II] 158m fine structure line and molecular CO(6-5) line and continuum emission at 353 GHz, 260 GHz, and 3 GHz from this quasar. The CO(2-1) line and the underlying continuum at 32 GHz are also marginally detected. The [C II] and CO detections suggest active star formation and highly excited molecular gas in the quasar host galaxy. The redshift determined with the [C II] and CO lines shows a velocity offset of from that measured with the quasar Mg II line. The CO (2-1) line luminosity provides direct constraint on the molecular gas mass which is about . We estimate the FIR luminosity to be , and the UV-to-FIR spectral energy distribution of J0100+2802 is consistent with the templates of the local optically luminous quasars. The derived [C II]-to-FIR luminosity ratio of J0100+2802 is 0.00100.0002, which is slightly higher than the values of the most FIR luminous quasars at z6. We investigate the constraint on the host galaxy dynamical mass of J0100+2802 based on the [C II] line spectrum. It is likely that this ultraluminous quasar lies above the local SMBH-galaxy mass relationship, unless we are viewing the system at a small inclination angle.
1 Introduction
An ultraluminous quasar, SDSS J010013.02+280225.8 (hereafter, J0100+2802) with a bolometric luminosity of and a supermassive black hole (SMBH) mass of , was discovered at z=6.3 (Wu et al., 2015). This is by far the most optically luminous object, with the most massive SMBH, among the 50 quasars known at z6 (Fan et al., 2006; Willott et al., 2010; Jiang et al., 2015; Venemans et al., 2015; Bañados et al., 2014; Matsuoka et al., 2016), and the SMBH mass is also comparable to the highest value found in the local universe (McConnell et al., 2011; Thomas et al., 2016). It demonstrates that such a rare, SMBH can be formed as early as z6.3, when the age of the universe was only 890 Myr.
Recent submillimeter and millimeter [(sub)mm] surveys detected strong far-infrared (FIR) continuum, molecular CO, and [C II] 158m fine structure line emission in the host galaxies of a number of quasars at z5.7 (e.g., Bertoldi et al., 2003; Priddey et al., 2003; Robson et al., 2004; Walter et al., 2004; Carilli et al., 2007; Wang et al., 2010, 2013; Omont et al., 2013; Willott et al., 2015; Venemans et al., 2016). The results argue for significant host galaxy evolution with active star formation in these young quasars in the early universe, and the [C II] line images at sub-second resolution constrain radius of the nuclear starburst region to be a few kpc (Leipski et al., 2013; Wang et al., 2013; Venemans et al., 2016). The gas dynamics measured with the CO and [C II] observations suggest SMBH-host mass ratios a factor of a few to one order of magnitude higher than the present-day value (Walter et al., 2004; Wang et al., 2013; Willott et al., 2015; Venemans et al., 2016).
The most massive z6 quasar-galaxy systems studied in previous millimeter and radio observations are objects with SMBH masses of a few and (e.g., Wang et al., 2013; Willott et al., 2015; Venemans et al., 2016). The discovery of J0100+2802 provides a unique chance to study the quasar-galaxy co-evolution in the system that hosts the most massive known SMBH at the earliest epoch. In this work, we report our new observations of the (sub)mm and radio continuum, [C II] 158m, and molecular CO lines from the host galaxy of J0100+2802. The observations are described in Section 2, the results are presented in Section 3. We discuss the quasar spectral energy distribution (SED), FIR continuum, [C II], and CO line ratios, and constraints of the host galaxy dynamical mass in Section 4, and summarize the results in Section 5. A -CDM cosmology with , and is adopted throughout this paper (Spergel et al., 2007).
2 Observations
2.1 PdBI observations
We observed the [C II] 158m () and molecular CO(6-5) line emission from J0100+2802 using the Plateau de Bure interferometer (PdBI). The observations were carried out in Summer 2014 in D-configuration using five antennas. We used the WideX wide-band correlator in dual polarization with a total bandwidth of 3.6GHz. We set up the correlator centered at the frequency of 260.35 GHz for the [C II] line and 94.72 GHz for the CO(6-5) line. This corresponds to the quasar Mg II line redshift of z=6.30 (Wu et al., 2015). The flux density scale was determined based on observations of the standard flux density calibrator MWC349, and the typical calibration uncertainties are 10% at 3 mm and 20% at 1 mm. The phase was checked about every 22min by observing a nearby phase calibrator, J0112+321. We reduced the data using the Grenoble Image and Line Data Analysis System (GILDAS) software (Guilloteau & Lucas, 2000). The maps were made using natral weighting. The FWHM synthesized beam sizes are and at the [C II] and CO(6-5) frequencies, respectively. The final rms sensitivity of the [C II] line observation is 2.3 per 46 channel with a total on-source integration time of 4.5 hours, and the rms of the CO(6-5) observation is 0.42 per 63 channel in 13.2 hours.
2.2 VLA observations
We observed the CO(2-1) line emission with the Karl G. Jansky Very Large Array (VLA) in Ka-Band ( GHz) in C-configuration in Oct-Nov 2014, and the 3 GHz radio continuum in S-band in A-configuration in June 2015. The observations were performed using the WIDAR correlator with the 8-bit sampler in dual polarization. The setup covers a total bandwidth of 2 GHz with sixteen 128 MHz spectral windows and the channel width in each spectral window is 2 MHz. We have spent a total on-source observing time of 7.2 hours for the CO(2-1) line observation and 2.1 hours for the 3 GHz continuum. The flux density calibration was carried out using the standard VLA calibrator 3C48 with typical calibration uncertainties better than 5%. The phases were checked with nearby point sources.
We reduced the data using the Common Astronomy Software Applications package (CASA v4.4) and the VLA calibration pipeline version 1.3.4. The FWHM synthesized beam size is at 32 GHz and at 3 GHz, using robust weighting. For the CO(2-1) line observations, we binned the data to a channel width of 57 , and obtained a typical 1 rms noise of 0.067 per channel. The channels affected by radio frequency interference were removed in the S-Band observations, resulting in a useful frequency range of 2.4 to 4 GHz and bandwidth of about 1.6 GHz. The final continuum sensitivity at 3 GHz was 3.1 .
2.3 SCUBA-2 observations
We observed the 450m (666 GHz) and 850m (353 GHz) dust continuum from J0100+2802 using the Submillimetre Common-User Bolometer Array 2 (SCUBA-2, Holland et al., 2013) on the James Clerk Maxwell Telescope (JCMT) in Nov 2015. The observations were carried out in Band 2 weather conditions (i.e. ), and in ’CV DAISY’ mode which is designed for point/compact source observations. The beam size of SCUBA-2 is 7.9′′ at 666 GHz and 13′′ at 353 GHz. We observed the target in four 30min scans with a total on-source time of 2 hours. The data was reduced using the STARLINK SCUBA-2 pipeline for faint point sources (Chapin et al., 2013), and we obtained a 1 point-source sensitivity of 1.2 mJy at 353 GHz and 10 mJy at 666 GHz.
3 Results
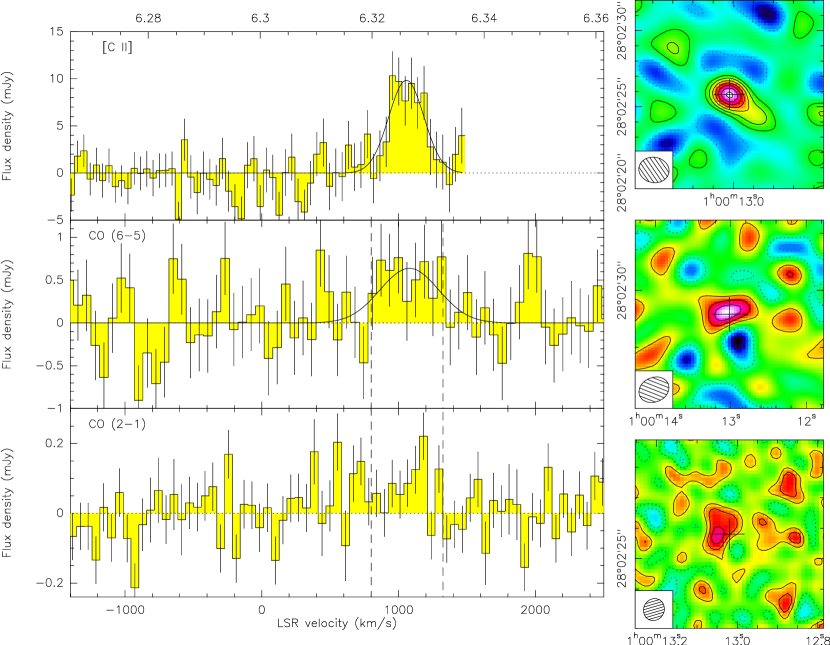
We summarize the measurements of redshift, line flux, FWHM line width, and luminosity of the [C II], CO(6-5), and CO(2-1) lines, as well as the continuum in Table 1. The [C II] and CO(6-5) lines are clearly detected (Figure 1), as well as the continuum emission at 353 GHz, 260 GHz, and 3 GHz. We fit a Gaussian line profile to the [C II] and CO(6-5) line spectra to determine the redshifts and line widths, and integrate the continuum-subtracted data over the line-emitting channels to get the line flux. The redshifts and line widths measured on the [C II] and CO(6-5) lines are consistent with each other within the errors, and we adopt as the redshift of the quasar host galaxy. We obtain tentative detections for the CO(2-1) line and the 32 GHz continuum. The central frequency and width of the CO(2-1) line are difficult to constrain due to the poor signal to noise ratio (SNR) of the spectrum. We integrate the visibility data over the velocity range of the CO(6-5) line emission (i.e., 800 to 1300 in Figure 1), and the intensity map shows a 3.6 peak about 0.27′′ away from the optical quasar position. Considering the measurement uncertainties and the astrometric mismatch between radio and optical frame, this is consistent with the quasar optical position. We also measure the 32 GHz continuum emission to be by averaging all the line-free spectral windows. We subtract the continuum from the line-emitting channels, resulting in a CO(2-1) line flux of at the peak position. Due to the poor SNR of the intensity map, we cannot obtain reliable measurement of the source size, or address if there are more extended components with lower surface brightness.
The quasar Mg II line emission from J0100+2802 measures a redshift of (Figure 3 inWu et al., 2015), which is blueshifted by compared to . Similar blueshifted Mg II lines with velocity offsets of a few hundred to 1700 are also detected in several other z6 quasars (Willott et al., 2015; Venemans et al., 2016). Such large Mg II line velocity offsets with respect to the quasar host galaxy redshift are rare at low redshift (Richards et al., 2002), and may suggest outflowing gas in the broad line region at an early evolutionary phase. A larger sample of high-z quasars with and measurements is required to investigate the relationship between MgII velocity offset and quasar luminosities (Venemans et al., 2016) and address the origin of the blushifted quasar Mg II line.
4 Discussion
4.1 Continuum emission and spectral energy distribution
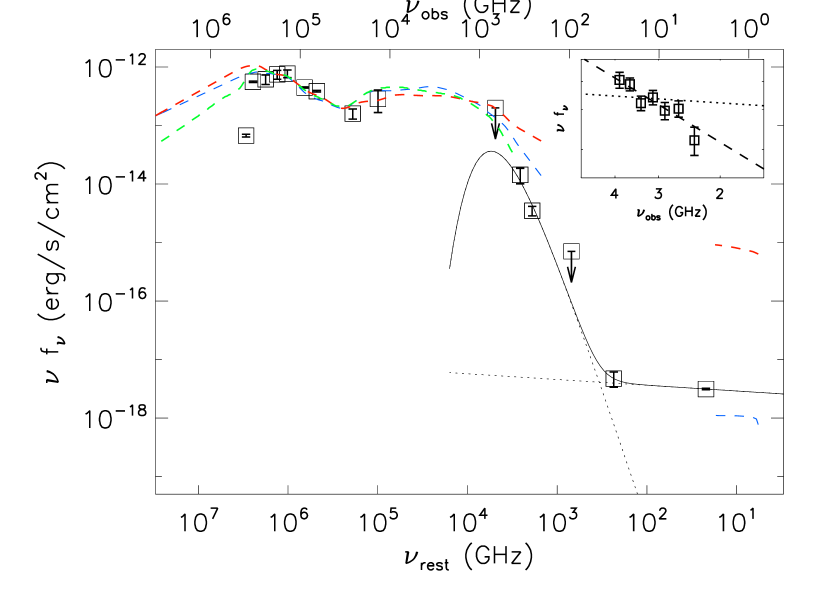
The new observations we present here measure the rest-frame FIR to radio continuum emission from J0100+2802. We plot the SED of J0100+2802 in Figure 2 (Wu et al., 2015), together with the data from SDSS, the Two Micron All Sky Survey (2MASS), and the Wide-field Infrared Survey Explorer (WISE). The templates of optically luminous quasars from Elvis et al. (1994) and Richards et al. (2006) are also plotted for comparison. We scale the templates to the 2MASS H-band flux, and the (sub)mm measurements show no excess compared to the FIR emission of the scaled templates. We cannot rule out that the FIR continuum emission from J0100+2802 is dominated by thermal emission from the AGN-heated dust. However, the detections of [C II] and CO line emission do argue for star forming interstellar medium (ISM) in the nuclear region (see Section 4.2). We fit the (sub)mm flux densities to an optically thin graybody model with a dust temperature of K and an emissivity index of from the (sub)mm-detected quasars at z1.7 (Beelen et al., 2006). This results in a FIR (42.5m-122.5m) luminosity of , and a 8m-1000m IR luminosity of . The star formation rate (SFR) estimated with the IR luminosity using the relation in Kennicutt (1998) is . As the fraction contributed from the torus is unknown, this constrains the upper limits of the star formation-powered FIR emission and SFR in the host galaxy. The dust mass calculated based on the above dust temperature and emissivity index assumption is . We adopt a dust absorption coefficient of and (Hildebrand, 1983) in the caluclation. If a higher dust temperature of 60 K is adopted (i.e., the highest temperature seen among the submillimeter/millimeter-detected z6 quasars, Leipski et al., 2013), the FIR luminosity and SFR increase by a factor of 1.7, and the dust mass will decrease by a factor of 1.8. If we adopt the lowest dust temperature of 40 K found by Leipski et al. (2013), the FIR and SFR with decrease by a factor of 1.5, and the dust mass increases by a factor of 1.6 (Table 1).
The VLA Ka and S-band observations measure the rest-frame 234 GHz and 22 GHz continuum emission, respectively. The corresponding continuum luminosities are and . We calculate the radio loudness of this object adopting the definition of (Kellermann et al., 1989). The rest-frame 4400 flux density () is interpolated using the scaled Richards et al. (2006) optically luminous quasar template (Figure 1), and the rest-frame 5 GHz flux density () is extrapolated from 22 GHz data assuming a power-law radio continuum of . This constrains the radio loudness to be for a steep spectrum of , or for a flat spectrum of (see below for the discussion of spectral index), indicating that this object is radio quiet. However, the 234 GHz and 22 GHz luminosities are more than an order of magnitude higher than the thermal bremsstrahlung or nonthermal synchrotron continuum expected from star forming activities (e.g., Condon 1992; Yun et al. 2000; Yun & Carilli 2002; Zakamska et al. 2016). For instance, the thermal bremsstrahlung or nonthermal synchrotron continuum estimated with a SFR of using the formulae in Yun & Carilli (2002) contributes 5% of the detected continuum emission at both frequencies. Additionally, the thermal dust emission has only a minor contribution of 12% to 21% to the 234 GHz flux density based on the graybody models with to 40 K described above. Thus, the continuum emission in J0100+2802 at frequencies of 234 GHz and lower is dominated by the radio activity of the central AGN.
In Figure 1, we adopt the graybody model with to remove the dust continuum at 234 GHz and fit a power-law () to the remaining 234 GHz flux density and the 22 GHz data. This estimates the 234-to-22 GHz two-point spectral index to be . We also measure the spectral index within the S-band by averaging the data in every two 128MHz spectral windows from the observed frequencies of 2.4 GHz to 4 GHz. In contrast to the steep spectrum indicate by , the best result fit to the seven data points in S-band yield a flat spectrum with . J0100+2802 provides a great example to study the radio activity in the most optically luminous and radio quiet nucleus at the earliest epoch. We will need further observations at multiple radio frequencies to check if the radio continuum is indeed flattened or inverse around 22 GHz. Additionally, milli-arcsecond resolution observations through Very Long Baseline Interferometry are needed to measure the spatial extent of the radio source in this object and address if there are multiple components contribute to the detected radio continuum as was widely discussed in the radio quiet quasars at lower redshift (e.g., Ulvestad et al. 1999, 2005)
4.2 Luminosity ratios and gas masses
Based on the FIR luminosity drived in the previous section, we constrain the [C II]-to-FIR luminosity ratio to be . This is comparable to the values found in other [C II]-detected z5.7 quasars that have similar moderate FIR luminosities of to , and higher than that from the more FIR luminous objects (, Wang et al., 2013), i.e., following the trend of decreasing FIR luminosity with increasing [C II]-to-FIR luminosity ratios defined by the high-redshift quasars and starburst galaxies (Maiolino et al., 2009; Riechers et al., 2013; De Breuck et al., 2014; Willott et al., 2015; Gullberg et al., 2015; Venemans et al., 2016; Muñoz & Oh, 2015; Narayanan & Krumholz, 2016). The SFR estimated with the [C II] luminosity is , adopting the SFR-[C II] luminosity relation for high-redshift galaxies in De Looze et al. (2014). This is consistent with the SFR estimates based-on the dust continuum.
The CO observations measure a CO (6-5)-to-(2-1) line flux ratio of and a line luminosity ratio of . This is consistent with the ratios found in other CO-detected z5.7 quasars within the errors (Wang et al., 2011; Stefan et al., 2015), suggesting that the detected CO emisison is likely from a highly-excited molecular gas component peaked at J=6 or higher (Riechers et al., 2009; Gallerani et al., 2014; Stefan et al., 2015). If we assume that the low-J CO transitions are thermalized, i.e., (e.g., Carilli & Walter, 2013), and adopt a luminosity-to-mass conversion factor of from the local ultraluminous infrared galaxies (Downes & Solomon, 1998), the detected CO(2-1) line flux yields a molecular gas mass of . However, the total molecular gas mass in the quasar host could be larger considering that some of the CO (2-1) line flux from the low surface brightness region and the line wings might be missing due to the poor SNR of the observation.
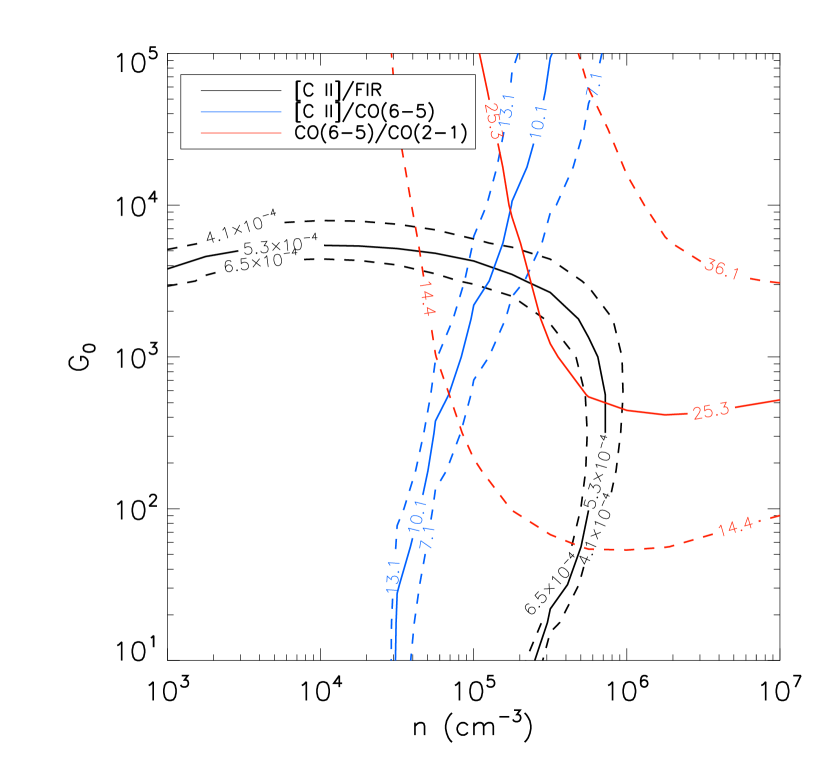
We compare the luminosity ratios of the FIR continuum, [C II], and CO lines from J0100+2802 to the models of Photo dissociation region (PDR111The line and FIR ratio models are taken from the Photo Dissociation Region Toolbox (http://dustem.astro.umd.edu/pdrt/)., Kaufman et al., 1999, 2006; Pound & Wolfire, 2008) in Figure 3, to investigate the gas density n and the incident far-ultraviolet radiation field (in units of the Habing Field, ) of the interstellar medium in the quasar host galaxy. As a one-side illuminated slab geometry was adopted in the model, we here devide the optically thin FIR222The FIR luminosity is re-calculated in the range of 30m to 1000m to match the definition in the models. and [C II] line emission by a factor of 2 to match the condition in the model. We also multiply by a factor of 0.7 to estimate and exclude the [C II] emission from the diffuse region (Stacey et al., 1991; Colbert et al., 1999). According to Figure 3, the overlap region of the three luminosity ratios suggests of a few thousand and n. These are only preliminary constraints on the physical condition of the star forming region in the host galaxy of J0100+2802. There are still large uncertainties in the calculation of FIR luminosity. The fractions of [C II] and CO emission from the PDR region are also not well determined. A larger FIR luminosity with a higher will result in a higher , and any contribution from the X-ray dominated regions (XDR) to the detected CO (6-5) line emission (e.g., Gallerani et al., 2014) will result in a higher and a lower from the PDR region and move the best-fit gas density to .
We estimate the atomic gas mass within the PDR region from the [C II] line luminosity using Equation (1) in Hailey-Dunsheath et al. (2010), adopting the best fit parameters indicated in Figure 3 (i.e., , , and a corresponding PDR surface temperature of , Kaufman et al., 1999), a C+ abundance of , and a critical density of . The derived atomic gas mass in the PdR region is , which is about 30% of the molecular gas mass estimated with the CO (2-1) line. The mass ratio associated with the detected CO, [C II], and FIR dust emission is . This is comparable to the mass ratios of other CO-detected quasars and dusty starburst galaxies at high-z (Wang et al., 2010; Michalowski et al., 2010; Riechers et al., 2013).
4.3 Constraint on host galaxy dynamical mass
Among the quasars known at z6, J0100+2802 has the most massive SMBH with a mass of (Wu et al., 2015; De Rosa et al., 2011). We use the [C II] line width () to present a preliminary estimate of the host galaxy mass for this object. We assume that the line is from a rotating gas disk and the circular velocity can be estimated as , where i is the inclination angle between the rotation axis of the disk and the line of sight. The [C II] line emission from J0100+2802 is unresolved in our PdBI observation at 2′′ resolution. According to the recent [C II] observations of other z6 quasars at sub-arcsecond resolution, the typical FWHM major axis sizes of the [C II] emission are about 24 kpc (Wang et al., 2013; Willott et al., 2013, 2015; Venemans et al., 2016). Thus, we here estimate the FWHM [C II] source size for J0100+2802 to be kpc (see also Willott et al., 2015; Venemans et al., 2016) and set the diameter of the gas disk D as 1.5 the FWHM [C II] source size, i.e., kpc. The host galaxy dynamical mass is then . The error inlcudes the unceratainties from both the line width and the assumed disk size.
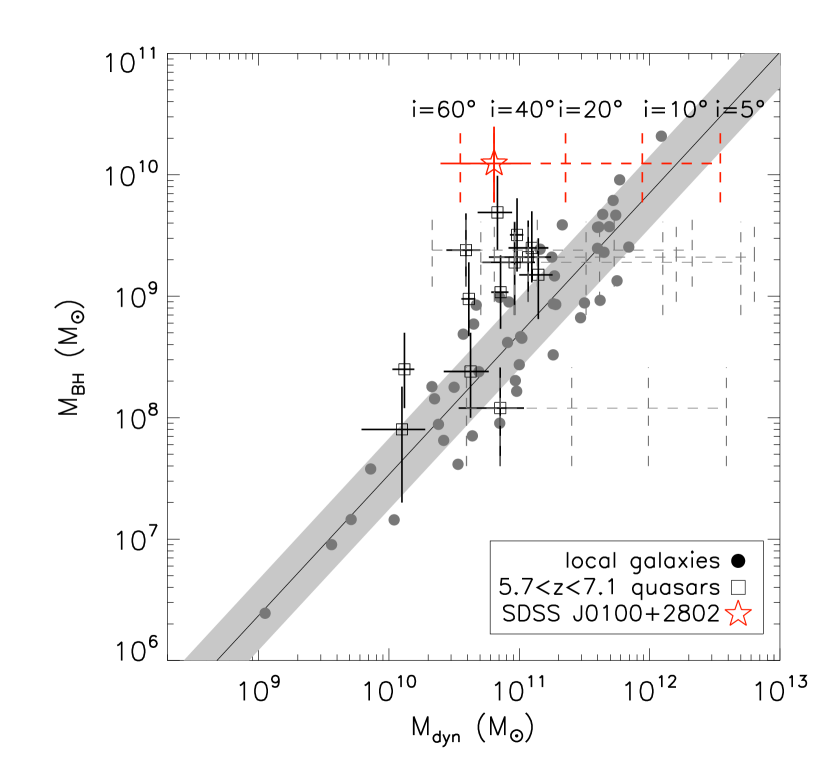
We plot vs. for J0100+2802 and other z5.7 quasars in Figure 4 (Wang et al., 2013; Willott et al., 2013, 2015; Bañados et al., 2015; Venemans et al., 2016), comparing to the SMBH-to-bulge mass relation of local galaxies from Kormendy & Ho (2013), i.e., . For J0100+2802 as well as other z5.7 quasars that have SMBH mass measurements based on the quasar Mg II line emisison (De Rosa et al., 2011, 2014; Willott et al., 2013, 2015), we follow Willott et al. (2015) and add a 0.3 dex uncertainty to the error bar of the SMBH mass to account for the scatter of the calibration (Shen et al., 2008). For the sample from Wang et al. (2013) which do not have SMBH mass measurements, we adopt the relationship between the 1450 luminosity and the quasar bolometric luminosity from Venemans et al. (2016), and calculate the Eddington luminosities and SMBH masses assuming a typical Eddington ratio and a scatter of from De Rosa et al. (2011). The for most of the z5.7 quasars are estimated based on [C II] observations (Wang et al., 2013; Willott et al., 2013, 2015; Bañados et al., 2015; Venemans et al., 2016). The only exception is the z=6.42 quasar SDSS J114816.64+525150.3, in which the [C II]-emitting gas at 1.5 kpc scale is turbulent (Cicone et al., 2015) and the CO size is used (Riechers et al., 2009; Stefan et al., 2015) in the calculation. According to Figure 4, for any inclination angle of , J0100+2802 is above the local relation and the 0.3 dex area of the intrinsic scatter (i.e. the gray area in Figure 3). As was discussed in Willott et al. (2015), most of the z6 quasars with SMBH masses on order of are close to the trend of local galaxies, while the more luminous and massive objects tend to be above this trend (see also Venemans et al., 2016). This suggests that the SMBH grows faster than the quasar host galaxies in these most massive systems at the earliest epoch, unless all these quasars are close to face-on. However, as there is no resolved image for J0100+2802 yet, we does not rule out the possibility that the gas is unvirialized and the [C II] line width cannot probe the disk circular velocity.
5 Summary
We detected [C II], CO, and (sub)mm and radio continuum emission in the host galaxy of the quasar J0100+2802 which hosts the most massive SMBH known at z6. The detections probe the properties of the young quasar host at an early evolutionary stage: The (sub)mm continuum indicates moderate FIR emission and constrains the SFR to be . The CO and [C II] lines estimate the gas mass and gas-to-dust mass ratio that are within the range of other millimeter-detected quasars at z6. The [C II]-to-FIR luminosity ratio J0100+2802 is higher than that of the most FIR luminous quasars at z5.7, i.e., following the trend of increasing with decreasing found with the high-z quasars and star forming systems. The quasar Mg II line emission detected in previous near-infrared spectroscopic observation (Wu et al., 2015) is blueshifted by about 1000 compared to the host galaxy redshift measured by the [C II] and CO lines. The host dynamical mass estimated with the [C II] line width suggest that the SMBH is likely to be overmassive, compared to the local relation, though furhter constraints on the gas kinematics and disk inclination angle are still required.
References
- Bañados et al. (2014) Bañados, E., Venemans, B. P., Morganson, E. et al. 2014, AJ, 148, 14
- Bañados et al. (2015) Bañados, E., Decarli, R., Walter, F., et al. 2015, ApJL, 805, 8
- Beelen et al. (2006) Beelen, A., Cox, P., Bertoldi, F. et al. 2006, ApJ, 642, 694
- Bertoldi et al. (2003) Bertoldi, F., Cox, P., Neri, R. et al. 2003, A&A, 409, L47
- Carilli et al. (2007) Carilli, C. L., Neri, R., Wang, R. et al. 2007, ApJ, 666, L9
- Carilli & Walter (2013) Carilli, C. L. & Walter, F. 2013, ARA&A, 51, 105
- Cicone et al. (2015) Cicone, C., Maiolino, R., Gallerani, S., et al. 2015, A&A, 574, 14
- Chapin et al. (2013) Chapin, E. L., Berry, D. S., Gibb, A. G. et al. 2013, MNRAS, 430, 2545
- Colbert et al. (1999) Colbert, J. W., et al. 1999, ApJ, 511, 721
- Condon (1992) Condon, J. J. 1992, ARA&A, 30, 575
- De Breuck et al. (2014) De Breuck, C., Williams, R. J., Swinbank, M. et al. 2014, A&A, 565, 59
- De Looze et al. (2014) De Looze, I., Cormier, D., Lebouteiller, V. et al. 2014, A&A, 568, 62
- De Rosa et al. (2014) De Rosa, G., Venemans, B. P., Decarli, R. et al. 2014, ApJ, 790, 145
- De Rosa et al. (2011) De Rosa, G., Decarli, R., Walter, F. et al. 2011, ApJ, 739, 56
- Downes & Solomon (1998) Downes, D., & Solomon, P. M. 1998, ApJ, 507, 615
- Elvis et al. (1994) Elvis, M., Wilkes, B. J., McDowell, J. C. et al. 1994, ApJS, 95, 1
- Fan et al. (2006) Fan, X., Strauss, M. A., Richards, G. T. et al. 2006, AJ, 131, 1203
- Gallerani et al. (2014) Gallerani, S., Ferrara, A., Neri, R., & Maiolino, R. 2014, MNRAS, 445, 2848
- Guilloteau & Lucas (2000) Guilloteau, S., & Lucas, R. 2000, ASPC, 217, 299
- Gullberg et al. (2015) Gullberg, B., De Breuck, C., Vieira, J. D. et al. 2015, MNRAS, 449, 2883
- Hailey-Dunsheath et al. (2010) Hailey-Dunsheath, S., Nikola, T., Stacey, G. J. et al. 2010, ApJ, 714, L162
- Hildebrand (1983) Hildebrand, R. H. 1983, QJRAS, 24, 267
- Holland et al. (2013) Holland, W. S., Bintley, D., Chapin, E. L. et al. 2013, MNRAS, 430, 2513
- Jiang et al. (2015) Jiang, L., McGreer, I. D., Fan, X. et al. 2015, AJ, 149, 188
- Leipski et al. (2013) Leipski, C., Meisenheimer, K., Walter, F. et al. 2013, ApJL, 772, 103
- Kaufman et al. (1999) Kaufman, M. J., Wolfire, M. G., Hollenbach, D. J., & Luhman, M. L. 1999, ApJ, 527, 795
- Kaufman et al. (2006) Kaufman, M. J., Wolfire, M. G., Hollenbach, D. J. 2006, ApJ, 644, 283
- Kennicutt (1998) Kennicutt, R. C., Jr. 1998, ARA&A, 36, 189
- Kellermann et al. (1989) Kellermann, K. I., Sramek, R., Schmidt, M., Shaffer, D. B., & Green, R. 1989, AJ, 98, 1195
- Kormendy & Ho (2013) Kormendy, J., & Ho, L. C. 2013, ARA&A, 51, 511
- Maiolino et al. (2009) Maiolino, R., Caselli, P., Nagao, T. et al. 2009, A&A, 500, L1
- Matsuoka et al. (2016) Matsuoka, Y., Onoue, M., Kashikawa, N. et al. 2016, ApJ, submitted, arXiv:1603.02281
- McConnell et al. (2011) McConnell, N. J., Ma, C.-P., Gebhardt, K. et al. 2011, Nature, 480, 215
- Michalowski et al. (2010) Michalowski, M. J., Watson, D., & Hjorth, J. 2010, ApJ, 712, 942
- Muñoz & Oh (2015) Muñoz, J. A., & Oh, S. P. 2015, MNRAS, submitted, arXiv:1510.00397
- Narayanan & Krumholz (2016) Narayanan, D., & Krumholz, M. 2016, MNRAS, submitted, arXiv:1601.05803
- Omont et al. (2013) Omont, A., Willott, C. J., Beelen, A. et al. 2013, A&A, 552, 43
- Petric et al. (2003) Petric, A. O., Carilli, C. L., Bertoldi, F. et al. 2003, AJ, 126, 15
- Pound & Wolfire (2008) Pound, M. W., & Wolfire, M. G. 2008, ASPC, 394, 654
- Priddey et al. (2003) Priddey, R. S., Isaak, K. G., McMahon, R. G. et al. 2003, MNRAS, 339, 1183
- Richards et al. (2002) Richards, G. T., Vanden Berk, D. E., Reichard, T. A., et al. 2002, AJ, 124, 1
- Richards et al. (2006) Richards, G. T., Lacy, M., Storrie-Lombardi, L. J. et al. 2006, ApJS, 166, 470
- Riechers et al. (2009) Riechers, D. A., Walter, F., Bertoldi, F. et al. 2009, ApJ, 703, 1338
- Riechers et al. (2013) Riechers, D. A., Bradford, C. M., Clements, D. L. et al. 2013, Nature, 496, 329
- Robson et al. (2004) Robson, I., Priddey, R. S., Isaak, K. G. et al. 2004, MNRAS, 351, L29
- Shen et al. (2008) Shen, Y., Greene, J. E., Strauss, M. A., Richards, G. T., & Schneider, D. P. 2008, ApJ, 680, 169
- Solomon & Vanden Bout (2005) Solomon, P. M., & Vanden Bout, P. A. 2005, ARA&A, 43, 677
- Spergel et al. (2007) Spergel, D. N., Bean, R., Doré, O. et al. 2007, ApJS, 170, 377
- Stacey et al. (1991) Stacey, G. J., Geis, N., Genzel, R., Lugten, J. B., Poglitsch, A., Sternberg, A., & Townes, C. H. 1991, ApJ, 373, 423
- Stefan et al. (2015) Stefan, I. I., Carilli, Chris L., Wagg, J. et al. 2015, MNRAS, 451, 1713
- Thomas et al. (2016) Thomas, J., Ma, Ch.-P., McConnell, N. J. et al. 2016, Nature, 532, 340
- Ulvestad et al. (1999) Ulvestad, J. S., Wrobel, J. M., Carilli, C. L. 1999, ApJ, 516, 127
- Ulvestad et al. (2005) Ulvestad, J. S., Antonucci, R. R. J., & Barvainis, R. 2005, ApJ, 621, 123
- Venemans et al. (2015) Venemans, B. P., Bañados, E., Decarli, R. 2015, ApJ, 801, L11
- Venemans et al. (2016) Venemans, B. P., Walter, F., Zschaechner, L. et al. 2016, ApJ, 816, 37
- Walter et al. (2004) Walter, F., Carilli, C. L., Bertoldi, F. et al. 2004, ApJ, 615, L17
- Wang et al. (2010) Wang, R., Carilli, C., Neri, R. et al. 2010, ApJ, 714, 699
- Wang et al. (2011) Wang, R., Wagg, J., Carilli, C., et al. 2011, ApJ, 739, L34
- Wang et al. (2013) Wang, R., Wagg, J., Carilli, C. et al. 2013, ApJ, 773, 44
- Willott et al. (2010) Willott, C. J., Delorme, P., Reylé, C. et al. 2010, AJ, 139, 906
- Willott et al. (2013) Willott, C. J., Omont, A., & Bergeron, J. 2013, ApJ, 770, 13
- Willott et al. (2015) Willott, C. J., Bergeron, J. & Omont, A. 2015, ApJ, 801, 123
- Wu et al. (2015) Wu, X.-B., Wang, F., Fan, X. et al. 2015, Nature, 518, 512
- Yun et al. (2000) Yun, M. S., Carilli, C. L., Kawabe, R. et al. 2000, ApJ, 528, 171
- Yun & Carilli (2002) Yun, M. S. & Carilli, C. L. 2002, ApJ, 568, 88
- Zakamska et al. (2016) Zakamska, N. L., Lampayan, K., Petric, A. et al. 2016, MNRAS, 455, 4191
| [C II] redshift | 6.32580.0010 |
|---|---|
| [C II] FWHM () | 30077 |
| [C II] line flux () | 3.360.46 |
| [C II] line luminosity: | |
| () | |
| () | |
| CO(6-5) redshift | 6.32640.0024 |
| CO(6-5) FWHM () | 498225 |
| CO(6-5) line flux () | 0.320.084 |
| CO(6-5) line luminosity: | |
| () | |
| () | |
| CO(2-1) line flux () | 0.0380.013 |
| CO(2-1) line luminosity: | |
| () | |
| () | |
| CO(1-0) line luminosity [derived from the CO (2-1) line]: | |
| () | |
| () | |
| 666 GHz continuum (mJy) | 30 |
| 353 GHz continuum (mJy) | 4.11.2 |
| 260 GHz continuum (mJy) | 1.350.25 |
| 94.5 GHz continuum (mJy) | 0.1 |
| 32 GHz continuum (Jy) | 14.84.3 |
| 3 GHz continuum (Jy) | 104.53.1 |
| FIR luminosity (): | |
| K, | |
| K, | |
| K, | |
| dust mass (): | |
| K, | |
| K, | |
| K, | |