Present address: ]Leibniz Institute of Surface Modification, Physical Department, Permoserstr. 15, 04318 Leipzig, Germany
Identification of a possible superconducting transition above room temperature in natural graphite crystals
Abstract
Measuring with high precision the electrical resistance of highly ordered natural graphite samples from a Brazil mine, we have identified a transition at 350 K with 40 K transition width. The step-like change in temperature of the resistance, its magnetic irreversibility and time dependence after a field change, consistent with trapped flux and flux creep, and the partial magnetic flux expulsion obtained by magnetization measurements, suggest the existence of granular superconductivity below 350 K. The zero-field virgin state can only be reached again after zero field cooling the sample from above the transition. Paradoxically, the extraordinarily high transition temperature we found for this and several other graphite samples is the reason why this transition remained undetected so far. The existence of well ordered rhombohedral graphite phase in all measured samples has been proved by x-rays diffraction measurements, suggesting its interfaces with the Bernal phase as a possible origin for the high-temperature superconductivity, as theoretical studies predicted. The localization of the granular superconductivity at these two dimensional interfaces prevents the observation of a zero resistance state or of a full Meissner state.
I Introduction
The recently reported record temperature for superconductivity at 203 K in the sulfur hydride system at high pressuresDrozdov et al. (2015) appears to be consistent with the Bardeen–Cooper–Schrieffer (BCS) theory for conventional superconductivity. Theoretical estimates suggest the proximity of the Fermi surface to a Van Hove singularity as one possible reason for the high-temperature superconductivityBianconi and Jarlborg (2015). In this case the interaction between carriersYudin et al. (2014) would give rise to the Khodel-Shaginyan flat band, a band with a dispersionless energy relationKhodel and Shaginyan (1990); Volovik (1994). Theoretical studies predict superconductivity at high temperatures in electronic systems with a flat bandVolovik (2013); Peotta and Törmä (2015) as, for example, at the surface of rhombohedral graphiteKopnin et al. (2013) or at the interfaces between this and Bernal graphiteMuñoz et al. (2013). Whereas evidence for flat bands at the surface of epitaxial rhombohedral multilayer graphene was recently foundPierucci et al. (2015), hints for the existence of superconductivity above room temperature in different graphite-based systems were reported in the last 40 yearsAntonowicz (1974, 1975); Kopelevich et al. (2000); Esquinazi (2013); Kawashima (2013) without providing, however, any knowledge of the critical temperature .
The recently observed superconductivity at K in intercalated Ca and Li-doped grapheneChapman et al. ; Ludbrook et al. (2015); Ichinokura et al. (2016) is probably related to the increase of the density of states due to a change in the carrier density. The low critical temperature is due to the common exponential suppression from the BCS equation for systems with a quadratic dispersion relation. In case of having similar Cooper pairs interaction strength and within the flat-band predictions, one expects a critical temperature orders of magnitude larger because in this case is proportional to the pairing interaction strength and to the area of the flat band in momentum space. Therefore, for a finite electron pairing interaction strength, we expect that at certain interfaces between rhombohedral and Bernal stacking ordered regionsKopnin et al. (2013); Muñoz et al. (2013), or at certain paths between (small-angle) twisted Bernal crystalline regionsSan-Jose and Prada (2013); Esquinazi et al. (2014), superconductivity may be triggered in graphite with a considerably higher critical temperature than in most bulk superconductors. The transition in the electrical resistance we found at K in several graphite samples and the behavior of the trapped flux and partial flux expulsion vs. temperature suggest that at that temperature superconducting regions are formed. Lowering temperature the size of these regions may increase as well as their Josephson coupling triggering the large decrease in the resistance below K observed in graphite samples with interfaces. In this paper we present results obtained from different graphite samples, natural graphite crystals from Brazil and Sri Lanka, thin flakes obtained from those bulk crystals, and bulk and thin flakes from commercial highly oriented pyrolytic graphite (HOPG) samples.
II Experimental details
The images of the internal structure of the natural graphite samples were obtained using the scanning transmission electron microscope (STEM) of a Nova NanoLab 200 dual beam microscope from the FEI company (Eindhoven). The lamellae were prepared with STEM using the in-situ lift out method of the microscope cutting them normal to the graphene layers. The STEM pictures were done with a voltage applied to the electron column of 20 kV and the currents used were between 38 to 140 pA.
The impurity content of the samples was determined by RBS/PIXE using a 2 MeV proton beam of 0.8 mm diameter. From the surface of the samples we removed the first hundreds of nanometers that usually have some contamination. The PIXE measurements of the clear surface and with a penetration depth of m indicate a concentration of ppm of Fe and 5.9 ppm of Ti; most of the other elements being below the detection limit. Here “ppm” means g element per gram sample. A thorough study of the impurity concentration of the HOPG sample used in this study (Advanced Ceramics, grade A) has been recently publishedSpemann et al. (2014). The total magnetic elements concentration in the HOPG sample used in this work is below 2 ppm.
The electrical resistance measurements were done in a He-flow cryostat from Quantum Design with a superconducting solenoid. The field provided by the solenoid in the low field region as well as the rest field, at nominal zero field, was measured with a Hall sensor especially designed to measure low fields. After applying fields below 100 mT the rest field trapped by the solenoid at the sample position and at nominally zero field, was below 0.1 mT.
We used the usual four-contacts method for the resistance measurements, two for the current across the whole sample width and flowing parallel to the graphene layers and interfaces, and two for the voltage. The voltage electrodes were placed always on the top graphene layer of the samples. To check for the reproducibility of the observed behavior, the voltage electrodes were placed contacting half of the sample width as well as the whole width. The high-resolution resistance measurements were done using an AC bridge (16 Hz) LR-700 with relative resolution. Due to the low resistance (m) value of some of the bulk samples, the input currents ranged from 0.1 to 30 mA. The shown results did not depend on the current value within experimental error.
The temperature dependence of the resistance has been measured in equilibrium avoiding any sweeping measuring mode, commonly used for measurements in a broad temperature range. It means that after reaching and regulating the selected temperature, we waited 5 minutes before the measurement started. This measuring mode is time consuming but mandatory, especially to measure the tiny transition at K we describe below. The maximum temperature available in the used equipment was 390 K.
The magnetization was measured using a superconducting quantum interferometer device (SQUID) from Quantum Design. The used RSO option allows us to measure the magnetic moments of our bulk samples with a resolution emu at low applied fields.
III X-rays characterization of selected samples
Ordered graphite samples can exhibit a regular pattern of alternating Bernal (ABAB…) (2H) and rhombohedral (ABCABC…) (3R) stacking with areas as small as (200 nm)2 Hattendorf et al. (2013). A certain amount of isolated 3R crystallites has been detected in bulk samples without suffering severe shear deformation Lin et al. (2012). Upon graphite sample, a concentration of up to 30% of the 3R stacking order is possible, especially in natural graphite crystalsKelly (1981). Therefore, in this work we studied the transport properties and the internal structure of natural graphite samples from Minas Gerais in Brazil. These highly ordered natural graphite samples show in general an extraordinarily large resistance ratio , which is an indication of highly conducting and large interfaces in agreement with low-energy STEM results García et al. (2012). For comparison, we also measured thin flakes obtained from the same natural graphite samples from Brazil, a bulk natural graphite sample from Sri Lanka as well as bulk and thin flakes from HOPG of grade A with 2H and 3R phases.
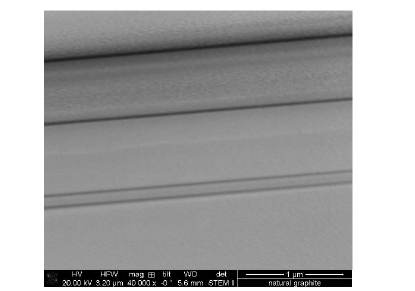
The internal structure of the natural graphite flakes, revealed by the STEM measurements, see Fig. 1, consists of well defined and several micrometers long interfaces between crystalline regions with different stacking orders or twisted regions around the axis. Clear evidence for the existence of the 2H and 3R phases in the measured samples is obtained by x-ray diffraction (XRD).
| Hexagonal | Rhombohedral | ||
|---|---|---|---|
| 2(degree) | 2(degree) | ||
| 002 | 26.543 | 003 | 26.611 |
| 100 | 42.321 | ||
| 101 | 43.454 | ||
| 011 | 44.518 | ||
| 012 | 46.321 | ||
| 012 | 50.656 | ||
| 004 | 54.662 | 006 | 54.812 |
| 104 | 56.676 | ||
| 013 | 59.852 | ||
| 015 | 63.677 | ||
| 014 | 71.471 | ||
| 110 | 77.400 | 110 | 77.696 |
| 107 | 80.738 | ||
| 112 | 83.527 | 113 | 83.848 |
| 015 | 85.375 | ||
| 006 | 87.053 | 009 | 87.330 |
XRD studies were carried out in order to show the coexistence of well ordered hexagonal and rhombohedral graphite in the investigated samples. The XRD measurements of the natural graphite samples and highly oriented pyrolytic graphite (HOPG) were performed with a D8 Discover (Bruker AXS) operated at 40 mA and 40 kV (Cu-Kα) and equipped with a Goebel mirror. The measuring area on the samples was limited to 2 mm2 using a pinhole and a snout. The XRD measurements of ultrapure graphite powder RWA-T were done with a Phillips Xpert diffractometer. Table 1 lists the expected Bragg angles for the Bernal (2H) and rhombohedral (3R) stacking order phases.
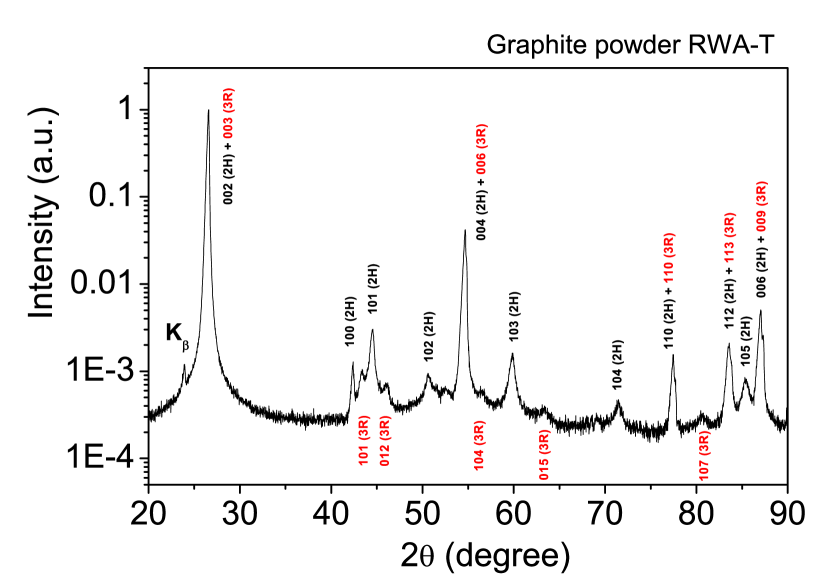
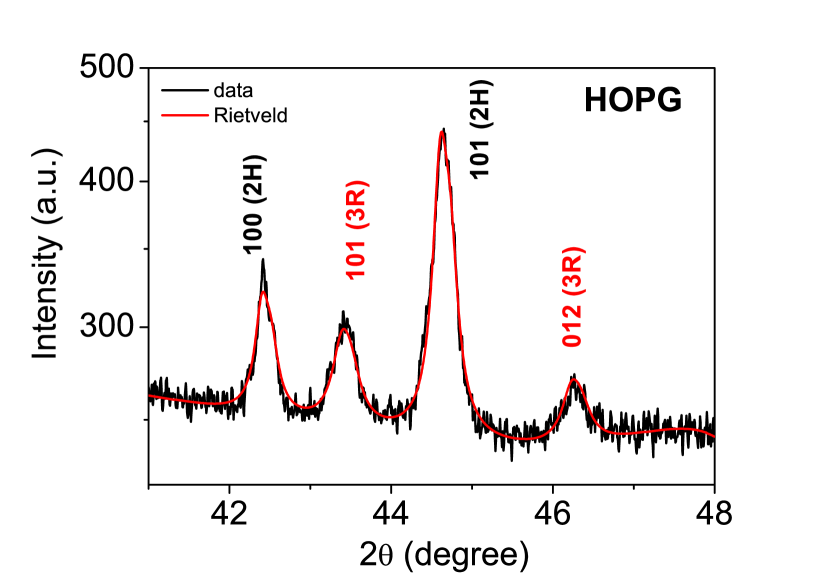
The diffraction pattern of an ultra pure polycrystalline powder RWA-T, see Fig. 2, shows all reflexes of the 2H and 3R phases of graphite. This powder treated with water shows granular superconducting-like hysteresis loops in the magnetizationScheike et al. (2012). Note that there are several peaks not suitable for distinguishing both modifications: reflexes with for 2H and with for 3R are as superposed as the reflexes, see Table 1. Therefore, the range was selected to determine and approximately quantify the 3R phase in the samples. The selected Bragg maxima are at and for the 2H phase and and for the 3R phase.
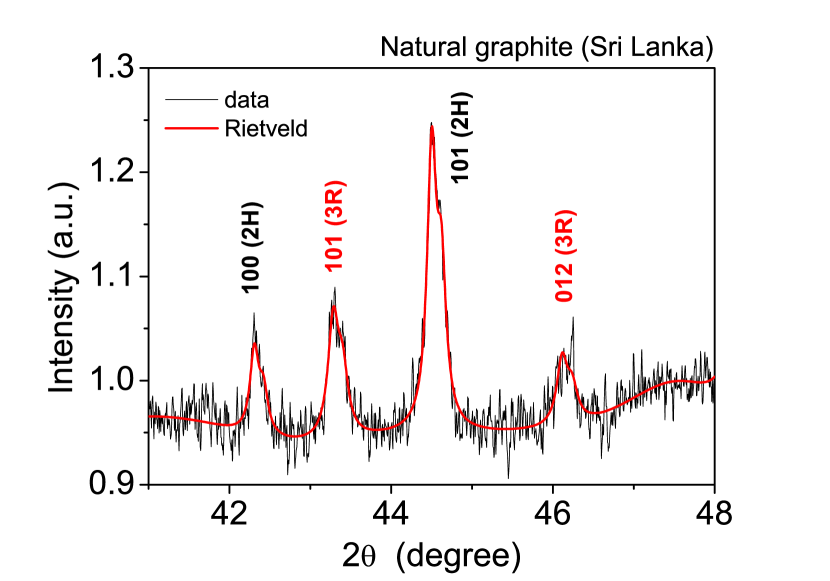
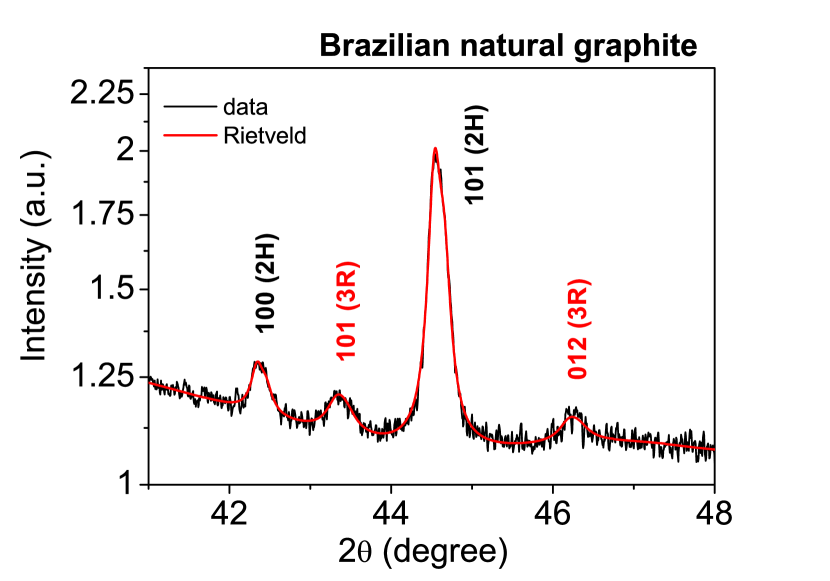
In natural graphite samples from Brazil (Fig. 3), in natural graphite samples from Sri Lanka (Fig. 4), as well as in HOPG samples (Fig. 5), the 3R phase is clearly identified. The Rietveld refinement using TOPAS 4.2 applied on the diffraction patterns obtained at different positions of the natural graphite samples from Brazil gives wt.% for the 2H and wt.% for the 3R phase. The same refinement applied on the patterns of several natural graphite samples from Sri Lanka gives a percentage range for the 3R phase between 5% and 32%. For the sample of Fig. 4 the refinement gives wt.% for the 2H and wt.% for the 3R phase.
For the HOPG sample (grade A), see Fig. 5, we obtained similar quantities as for the Brazilian graphite sample within experimental error, i.e. for the 2H phase and for the 2H phase. We note that the magnetization of a similar HOPG sample with interfaces showed granular superconductivity behavior (hysteresis loops, partial flux expulsion as well as flux creep) in the magnetization at room temperatureScheike et al. (2013), similar to the water-treated graphite powderScheike et al. (2012), whereas a HOPG sample without interfaces did notScheike et al. (2013).
We note that the overall x-ray diffraction characterization presented in this study is rather unique because of the identification of the existence of well ordered 3R phase in all graphite samples that show hints for the existence of high-temperature superconductivity.
IV Electrical resistance vs. temperature: First hint for a transition at high temperatures
Because interfaces between the 2H and 3R phases are embedded inside the samples, there is no simple method to make electrical contacts directly on the interfaces. In principle, TEM lamellae (typical size m2 area and nm thick) from natural graphite samples would enable us to contact the interfaces edges directly, as done for HOPG samplesBallestar et al. (2013). However, the several micrometers long interfaces in these crystals, see Fig. 1, influence the mechanical stability of the thin TEM lamella in such a way that its further and necessary handling is intricate, breaking the sample before fixing and contacting it on the substrate. Moreover, there is actually no precise knowledge in which part of the sample and at which depth the interfaces of interest are localized in a sample of several mm2 area. Therefore, we decided to make the electrical contacts at the top surface of the flakes measuring the voltage response of an area of mm2. In this case, it is clear that no zero voltage is expected in case one path inside the sample gets superconducting. Taking into account previous workEsquinazi (2013), in samples of this size we expect to observe some behavior compatible with the existence of (granular) superconductivity at certain interfaces.
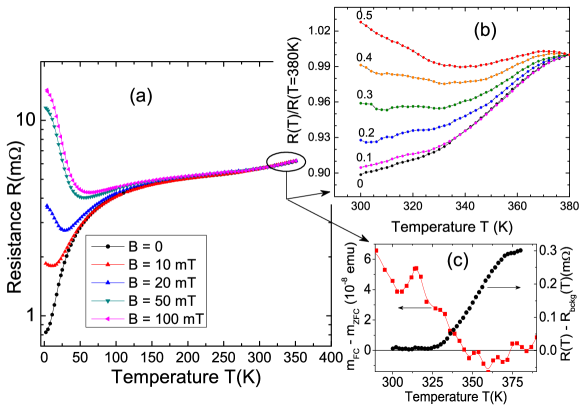
The temperature dependence of the resistance at different magnetic fields applied normal to the interfaces and graphene planes (the field component Kempa et al. (2003) that triggers the extraordinarily large metal-insulator transition (MIT) at K) is shown in Fig. 6(a). A recent discussion of the origin of the MIT in graphite can be read in Esquinazi (2013). It is related to the existence of certain interfaces in bulk samples and it is not intrinsic of the ideal graphite structure García et al. (2012); Zoraghi et al. . The MIT is not the main scope of this study but a transition we found at much higher temperatures.
A careful look at the temperature dependence of the resistance at K provides the first hint of a transition at K, see Figs. 6(b) and 6(c). The existence of this transition is the main message of this work. Results obtained on different samples show that this step-like behavior in the resistance starts at similar or even higher temperatures.
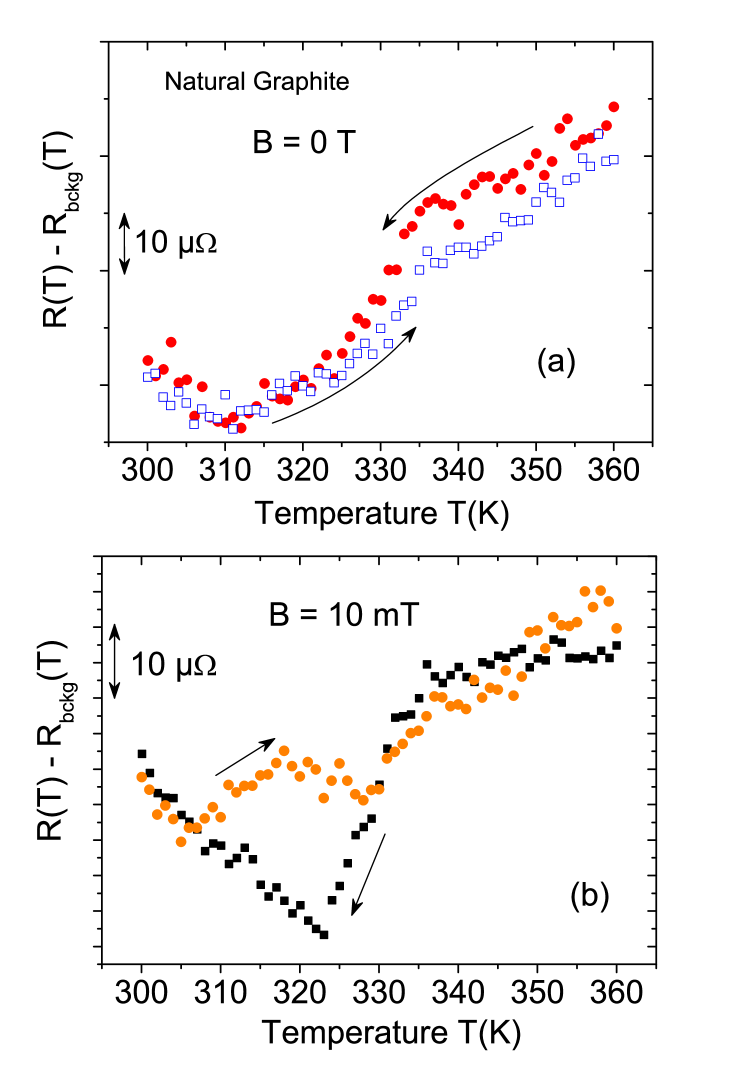
Figure 7 shows the temperature dependence of the resistance around the transition of a bulk natural graphite sample (Brazil), similar to the one shown in Fig. 6. Each point was obtained in thermal equilibrium after waiting 5 to 10 minutes before measuring the signal. Afterwards we heated or cooled the sample to the next preselected temperature. Figure 7(a) shows a weak temperature irreversibility at nominal zero field. We note that the rest field of the superconducting solenoid was measured by a Hall sensor especially designed for the measurement of very small fields. The background field at nominally zero field was below 0.02 mT after applying a maximum field of 10 mT. The starting temperature was 360 K for both sets of measurements in Figs. 7(a) and 7(b). It is interesting to note the difference in the irreversibility between the curves taken at nominally zero field (a) and at 10 mT (b). The zero field measurement shows the warming curve partially below the one measured first by cooling, though this hysteresis is small. The opposite behavior is observed when a low field is applied.
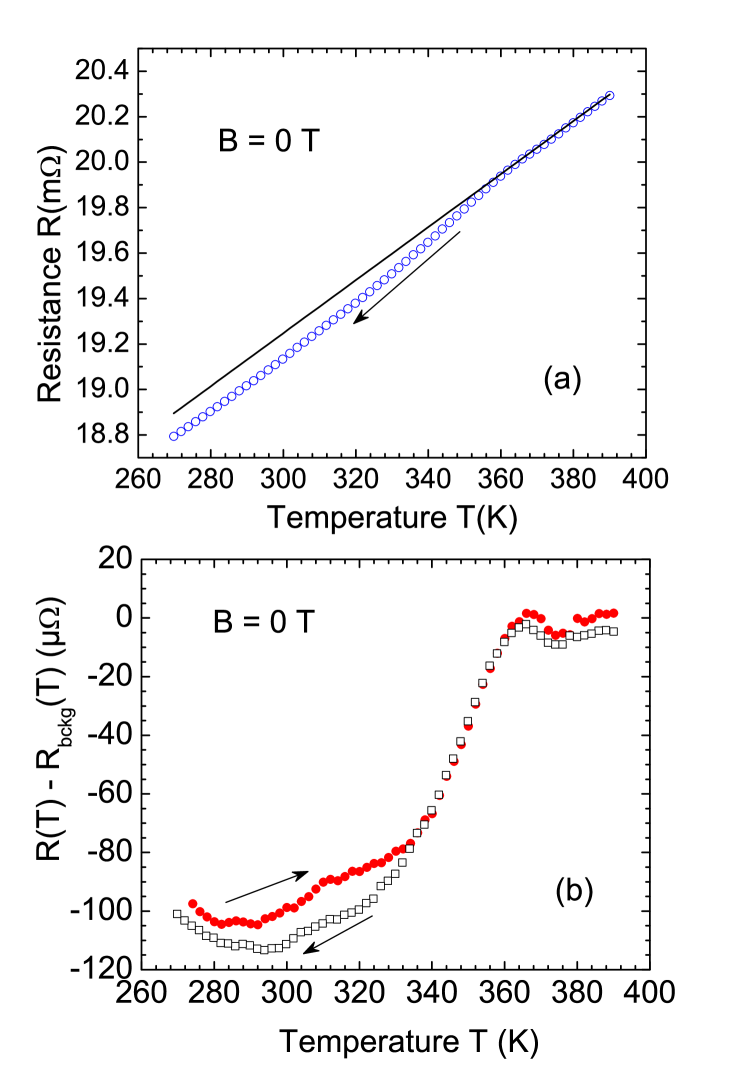
Figure 8 shows the transition in the resistance of a bulk natural graphite sample from Sri Lanka. In Fig. 8(a) we show the background line subtracted to show the transitions in (b). The two curves in (b) were obtained in two different days by cooling and warming. The observed difference indicates the reproducibility of our measurements. The sample was heated to 390 K several times during a whole week, before obtaining the second (cooling down) curve.
V Influence of a magnetic field
V.1 High magnetic field influence on the high temperature transition
Under a magnetic field and for usual bulk superconductors we expect a shift of the superconducting transition to lower temperatures, given by the upper critical field . However, in case of (granular) superconductivity in low dimensional systems, as in an interface, can be much larger than its value in bulk and, moreover, can even increase with fieldGardner et al. (2011) or could remain field independent as in carbon nanotubesWang et al. (2012). The transition at different magnetic fields (applied always normal to the interfaces and graphene planes) in field cooling mode can be seen in Fig. 6(b). It is convenient to plot the normalized resistance vs. temperature to minimize the effect of the increase of the resistance with field. Whereas the resistance step is clearly recognized at different fields, the transition does not show a clear shift to lower temperatures with field, within the shown field range. Note that the magnetoresistance is clearly larger at temperatures below K. This result also suggests a non-simple origin of the observed transition.
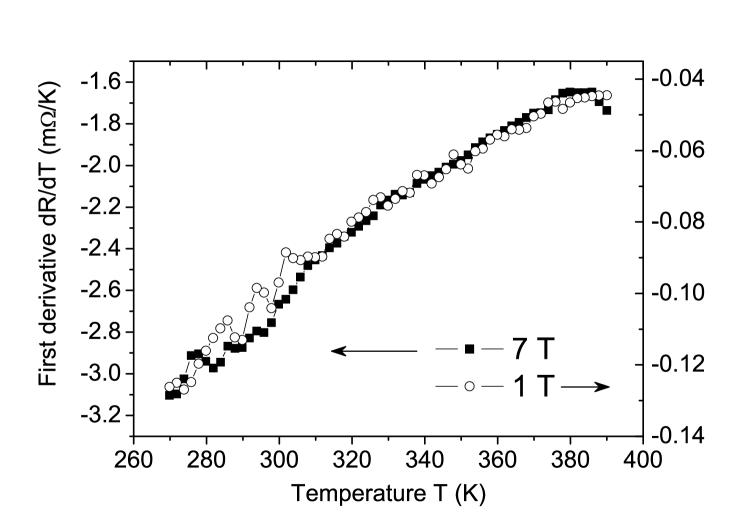
In order to obtain some hint of the upper critical field we have measured the temperature dependence of the resistance at different magnetic fields. Figure 9 shows the temperature derivative of the resistance at two different magnetic fields of the bulk natural graphite crystal from Sri Lanka, see Fig. 8. A flattening of this derivative at K is observed. The temperature at which this flattening starts does not show a clear shift with field within the available field range.
We show results of a thin flake obtained from a bulk natural graphite sample from Brazil. The thickness of the flake was nm and several micrometers length and width. The Pd/Au electrical contacts were made using electron lithography, see e.g. Ref. Esquinazi et al., 2008. Figure 10(a) shows the electrical resistance measured after zero field cooling (ZFC) from 390 K to 290 K and measured by warming after applying the magnetic field at 290 K. After reaching 390 K, the sample was cooled down at zero field again and the next measurement at higher field was done. At all applied fields we found a small temperature hysteresis, see Fig. 10(b).
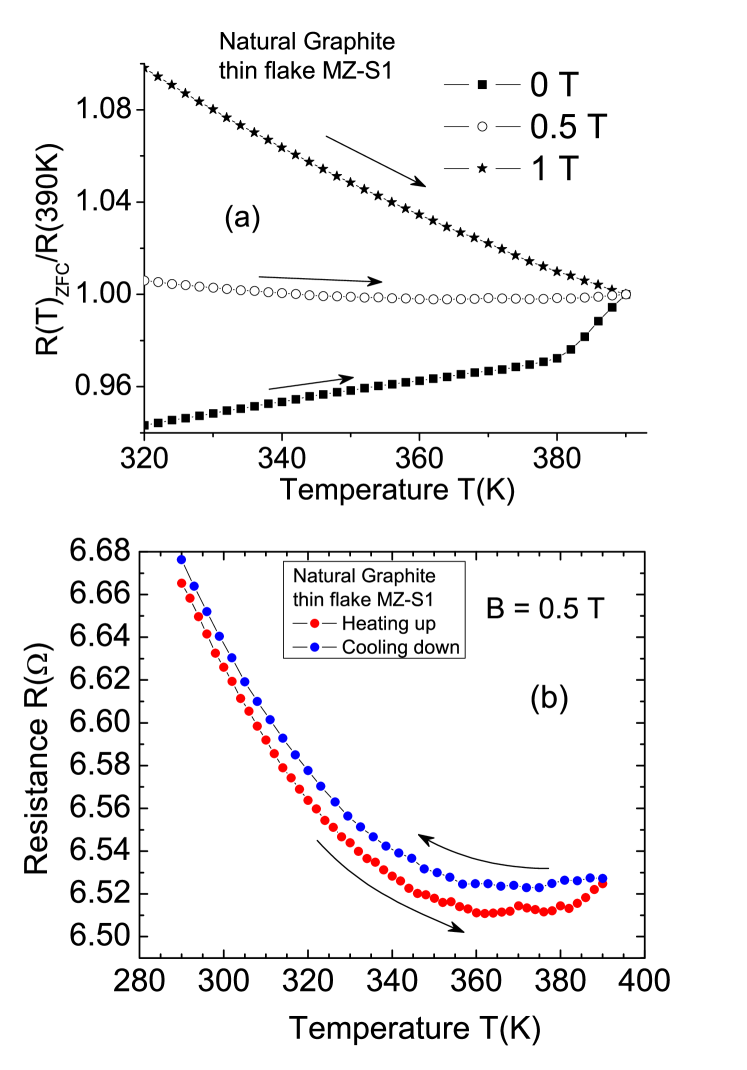
Figure 10(b) shows the resistance at a field of 0.5 T applied in the ZFC state at 290 K. This measurement was done after the zero field measurement shown in (a). The origin of this hysteresis can be due to: (a) an irreversible change in the resistance due to an annealing process at the relatively high temperatures (and measuring time) and/or (b) flux pinning. Because the flux free virgin state cannot be fully reached if the onset of the transition is above 390 K, as it appears for this sample (see the curve at zero field in Fig. 10(a)), it is not possible to discern, which of the two possibilities is the origin of the irreversibility, unless one takes the sample out of the cryostat and anneal it above 390 K in an independent oven. For that, however, other technical problems appear especially with the electrical contacts and the already fixed wires. As in all the other temperature dependent measurements, each point was obtained after waiting for thermal equilibrium (no temperature sweeping mode), i.e. each point took about 5 to 10 minutes waiting time.
We may conclude that the large magnetoresistance makes difficult a clear determination of , in case it exists, at this stage and for the usual electrode configuration. Nevertheless and within the obtained data it appears that the is significantly larger than the one measured in the CuO2-based high-temperature superconductors. The magnetization measurements shown below support this conclusion. Taking into account the two-dimensionality of the superconducting regions localized at the interfaces, a high bulk critical field is in principle expected, see Section VII.
V.2 Low magnetic field response: irreversibility and remanence
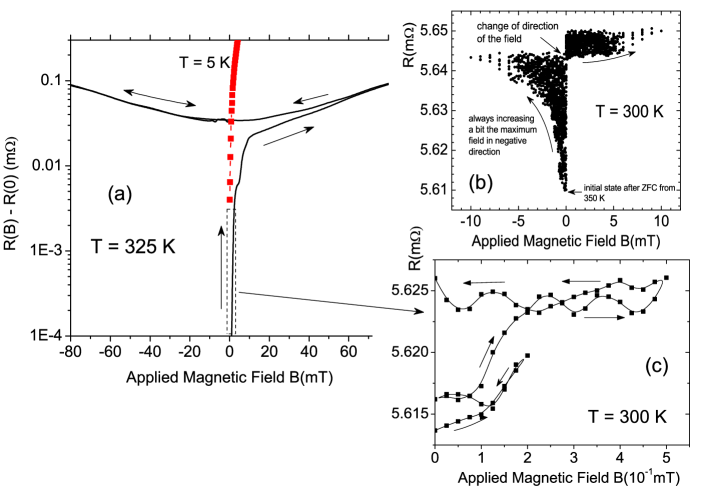
Taking into account the low-field sensitivity of earlier transport measurements in annealed graphite powder samples Antonowicz (1974) and the hints for the existence of the Josephson-effect in HOPG lamellae Ballestar et al. (2013), in this work we have studied carefully and with high resolution the change of the electrical resistance with field, in the low field region. Figure 11(a) shows the magnetoresistance at 325 K of a bulk natural graphite sample from Brazil, starting after ZFC from 390 K. The measured virgin curve starting at zero field shows a rapid increase in the resistance with field. At around 10 mT it shows a clear decrease in the slope and continues increasing slowly with field. Note that after applying a field mT or higher, the magnetoresistance shows a quadratic in field and reversible behavior, within experimental error, see Fig. 11.
We note that graphite flakes shows an anomalous field hysteresis but at K compatible with the existence of Josephson coupled superconducting regions Esquinazi et al. (2008). Due to the resolution limits and the relatively large background, for the observation of the small anomalous field hysteresis it is necessary to restrict the sample size by, for example, introducing micro-constrictions Dusari et al. (2011). The irreversibility we find at much higher temperatures in the studied samples and discussed in this work does not show a field hysteresis but has a different character and it is observed in large samples, although it can be also related to granular superconductivity, as we explain below.
Figure 11(c) shows the change in resistance and its irreversible behavior at fields below 0.5 mT at 300 K, starting from the ZFC state. Figure 3(b) shows similar data but increasing a small amount the maximum applied field after each field cycle. At a given resistance/field value we changed the direction of the field to show that the resistance does not return to its virgin state. It is important to note that to return to the virgin state one needs to heat the sample at K and cool it at zero field. This remanence in the resistance after applying such small fields indicates the existence of trapped magnetic flux.

Figure 12 shows the irreversibility in the resistance at a temperature below the transition (300 K, Fig. 12(a)) and in the transition region (350 K, Fig. 12(b)), for a bulk natural graphite sample similar to the one shown in Fig. 6. The starting zero-field cooled state was reached after cooling the sample from 390 K. Note the absence of remanence at 350 K within experimental error. This result is a further proof for the existence of a transition at K, as shown in Fig. 6.
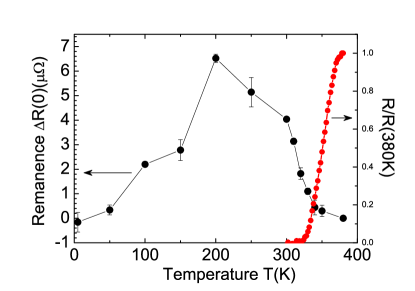
To quantify the temperature dependence of the remanence we used a three-points method that consists in: 1) cooling the sample at zero field from 390 K to the preselected temperature, 2) measuring the resistance at zero field , 3) applying a certain magnetic field, 4) returning to zero field and measure the resistance again. The remanence is then defined as the difference between these two resistances at zero field . Figure 13 shows this difference vs. temperature. The transition at K is clearly discernible in the remanence and it shows a maximum at K, tending to zero at the lowest temperature.
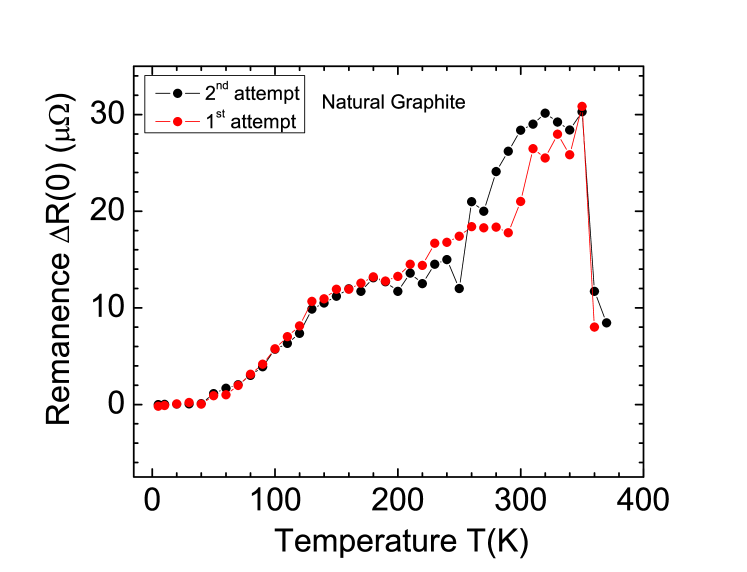
Figure 14 shows the remanence of a different bulk natural graphite sample obtained using the three-points method. The two curves shown in the figure were obtained in the same way but after waiting for a couple of days between the two measurements. Note that each point was obtained starting with the sample in the virgin state, as the results of Fig. 13. It means that before magnetizing the sample at a given temperature, it was heated to 390 K and cooled down at the respective temperature at zero field.
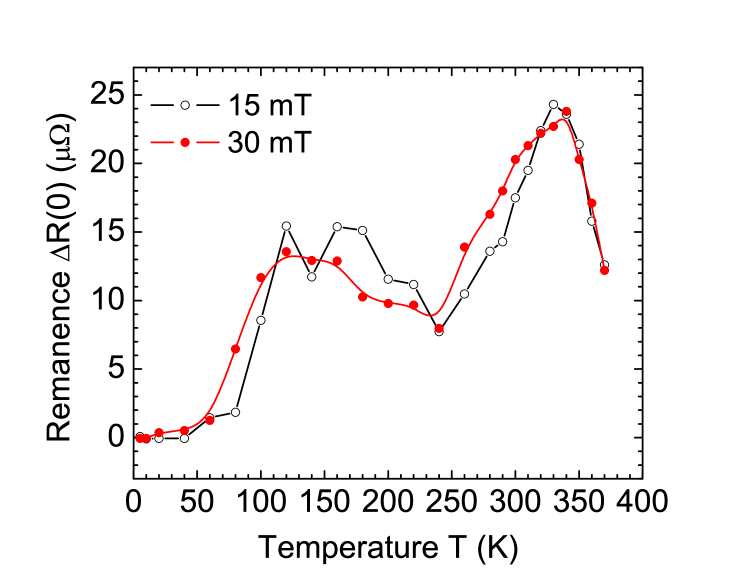
Figure 15 shows the temperature dependence of the remanence at two different applied fields for a bulk natural graphite sample from Sri Lanka. Basically the same results are obtained for both relatively large fields, as expected taking into account the behavior of the magnetoresistance shown in Fig. 11.

Figure 16 shows a similar plot for a natural graphite thin flake obtained from a bulk natural crystal from Brazil. Qualitatively, the measured temperature dependence of the remanence resembles that obtained for bulk natural graphite samples. The insert in that figure shows the temperature dependence of the resistance measured increasing temperature at zero field.

Similar measurements were done for a thin (nm) HOPG flake that has interfaces according to STEM studies, see Barzola-Quiquia et al. (2008); García et al. (2012). Figure 17 shows the remanence resistance vs. temperature for the HOPG flake. Note that the temperature dependence is similar to the other measured samples (see Figs. 14, 15 and 16) but it has a larger scatter. This scatter is possibly due to the higher transition temperature, i.e. with an onset at 390 K, and a large transition width that prevent to reach always the same flux-free virgin state before cooling to the selected temperature.
The observed behavior for the temperature dependence of the remanence is general for all samples we measured but the details are sample dependent. It is interesting to note that the irreversibility of the magnetization (difference between FC and ZFC curves) of graphite bulk HOPG samples (with interfaces) shows local maxima at K, K and K, which remain independent of the applied field to 7 T,Scheike et al. (2013) indicating a general behavior in the pinning of trapped flux in this material.
VI Magnetization measurements
VI.1 Temperature dependence
If superconductivity is localized at the interfaces and the field is applied normal to them, the large demagnetization factor would prevent a full flux expulsion (the Meissner effect). However, partial flux expulsion is always possible to observe if vortex (or fluxon) pinning exists in the superconducting sample. In this case a positive difference between the FC and ZFC magnetic moment is expected below and after applying the field at the lowest temperature of the temperature loop cycle with the sample in the ZFC state. Figure 6(c) shows the difference in the magnetic moment of other natural graphite sample from Brazil, at an applied field of 50 mT. Lowering temperature, this difference starts to increase just below the transition temperature measured with the resistance, right -axis in Fig. 6(c).
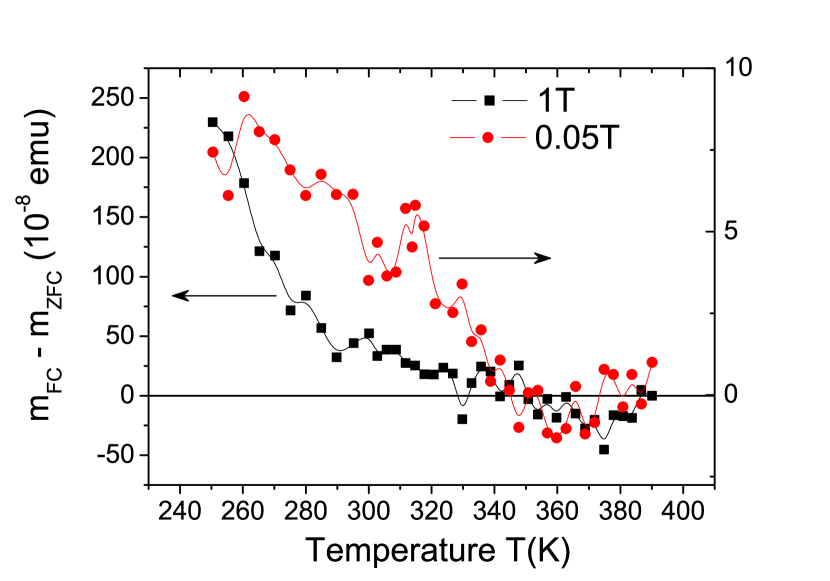
Figure 18 shows the temperature dependence of the difference between FC and ZFC magnetic moment at two different applied fields of the same natural graphite bulk sample (Brazil). Note the increase in the irreversibility values with field. In spite of that, a clear shift of the temperature onset, where starts to be larger than zero, to lower temperatures by increasing the applied field cannot be clearly recognized from the measurements. Measurements done of this difference at higher fields are shown in Fig. 19.
At such high temperatures one expects that the strength and temperature dependence of the measured irreversibility in the magnetization is mainly due the pinning of the involved magnetic entities (vortices and/or fluxons, see Sec. VII). The shift to low temperatures with applied field of the onset in the magnetic moment difference would be given by the depinning or irreversibility line, as in the oxides high-temperature superconductors. The apparently small, if at all, shift of the onset with field in the measured field region would indicate therefore a surprisingly large pinning strength.
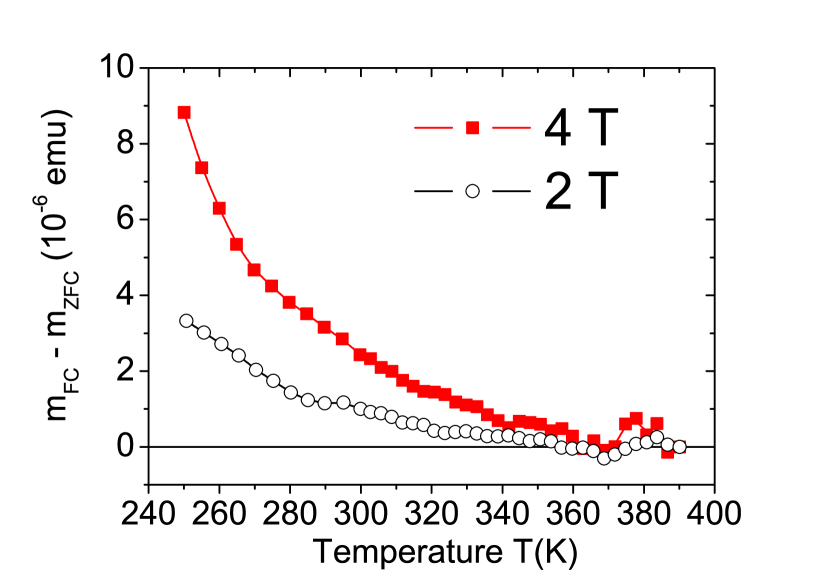

Figure 20 shows the difference between FC and ZFC magnetic moment vs. temperature at an applied field of 7T of a bulk HOPG sample, similar to those shown in Ref. Scheike et al. (2013). The field was applied at 250 K with the sample in the virgin state (cooled from 390 K at zero field). In agreement with previous measurementsScheike et al. (2013), this difference indicates that the onset of the (possible superconducting) transition temperature should be above 390 K. The turning point in these measurements was 390 K.
VI.2 Time dependence
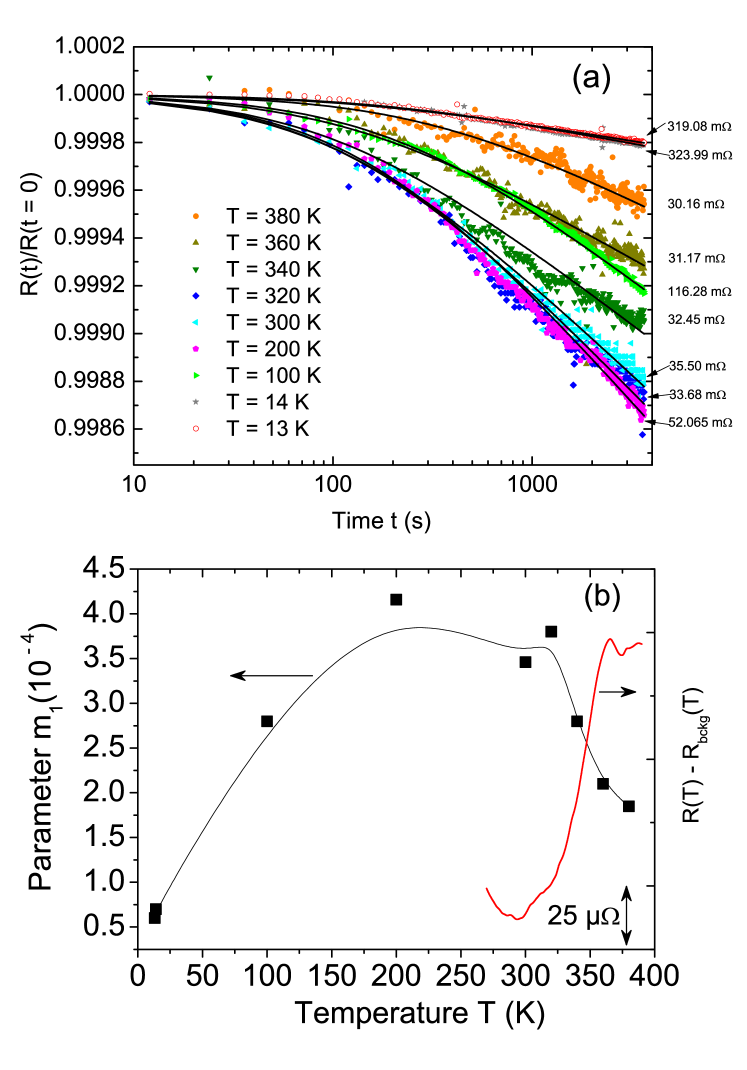
Usually, due to the finite pinning strength of the magnetic entities, one expects to measure a time relaxation in certain properties like the magnetization or magnetoresistance. The time dependence of the magnetization of water treated graphite powderScheike et al. (2012) at zero field, after applying a finite field, has been shown to follow the well known logarithmic time dependence with coefficient , where is an apparent flux creep activation energy and a time constant that determines a transient stage before the beginning of the logarithmic relaxationGurevich and Küpfer (1993). Due to the small mass of the natural graphite samples, magnetization measurements are not enough sensitive to observe the time dependence due to a possible flux creep. However, our resistance measurements have enough resolution to measure this time relaxation. Figure 21(a) shows the time relaxation for the same bulk natural graphite sample (Sri Lanka) shown in Fig. 8. The curves were obtained applying (at constant temperature, waiting half an hour for temperature stabilization) a field of 1 T from the ZFC state of the sample (starting always at 390 K). The zero time was defined 10 s after the superconducting solenoid was set in permanent modus. The resistance follows a similar logarithmic time dependence as the magnetizationScheike et al. (2012). Note that after applying the field the magnetoresistance decreases with time because of the entrance of flux inside the sample, which implies a decrease of the effective field seeing by the sample.
From the fits to the time dependence shown in Fig. 21(a) we obtain the parameter . Figure 21(b) shows the temperature dependence of this parameter. It shows a clear increase decreasing temperature in the region of the transition (axis in Fig. 21(b)). Note that one expects that . This dependence appears to be followed below 200 K, see Fig. 21(b).
VII Discussion
The main reasons to identify the small step in the resistance with temperature, see Figs. 6 and 8, as a superconducting transition are: (1) Step-like decrease in the resistance decreasing temperature (see Fig. 6(b)), (2) relatively large positive magnetoresistance at very small applied fields and temperatures (see Fig. 11), (3) field irreversibility with finite remanence at small applied fields (see Figs. 11, 13-17), (4) time dependence of the magnetoresistance after changing the apply magnetic field, compatible with flux creep (see Fig. 21), and (5) partial magnetic flux expulsion below the transition (see Figs. 6(c), 18, 19 and 20).
In general, we can imagine two possibilities that a material shows a magnetic field irreversibility and finite remanence, namely: a) due to vortex pinning or flux trapping, requiring the existence of superconducting currents, or b) magnetic order, due to the pinning of magnetic domains or magnetic field anisotropy, that appear below the corresponding Curie temperature and without applying any external field. We do not expect to have magnetic order due to impurities or defects in all graphite samples we measured because the measured concentration of magnetic impurities is far too small (see Sec. II). Moreover, the observed behavior does not seem to be compatible to phenomena related to magnetic order in graphite, namely: - we observe a positive instead of a negative magnetoresistance measured for magnetic graphiteEsquinazi et al. (2010), - relatively large response of the resistance in the virgin state of the sample in a field range below a few mT and at room temperature, - the virgin state resistance is not reached anymore after applying a finite magnetic field, even changing the field direction, - the field irreversibility and the remanence tend to vanish at low temperatures. Magnetic field-induced structural changes in the graphite samples at such small field strengths can be disregarded. Note also that the transition does not change basically after applying a magnetic field below 1 T, see Fig.6(b).
The overall behavior shown in Fig. 11 is compatible with trapped magnetic flux in granular superconductorsJi et al. (1993) and in Josephson junctionsWatanabe et al. (2007). The trapped flux can occur within the superconducting regions, i.e. through the existence of pinned intragranular vortices, but also within superconducting loops enclosing regions where the Josephson junctions allow superconducting currents (intergranular vortices). Although an explanation to all details of the temperature dependence of the remanence shown for example in Figs. 13, 14, 15, 16 and 17, requires knowledge of the pinned entities, the vanishing of to lower temperatures appears at odds with the expected increase in Josephson coupling, Josephson critical current as well as in the overall increase of pinning strength of intragranular vortices decreasing temperature. Because this behavior measured by the magnetizationScheike et al. (2013) and resistance appears to be rather general, we provide below a possible general explanation.
Assuming that the superconductivity has a 2D character and it is localized at the interfaces, one should first clarify to what extent this would be at all possible. Following early theoretical work on this issue (see chap. 7 in Ref. imnek (1994)) a superconducting layer of circular size (in our case the size of the 2D interfaces in graphite m) can exhibit superconductivity if , the effective screening length for transverse magnetic field. Taking into account that in 2D the effective London penetration depth is given by the Pearl resultPearl (1964) , where is the London penetration depth of the bulk superconductor (m) and nm the thickness of the superconducting layer, we estimate mm . The existence of Pearl vortices with such a giant effective penetration depth would imply a priori a very weak pinning. We speculate therefore that the trapped flux is mainly due to fluxons, intergranular vortices, and not intragranular ones. Upon the characteristics of the interfaces and decreasing temperature, the trapped flux can increase due to an increase in the Josephson coupling between the superconducting domains. On the other hand, decreasing temperature the size of the superconducting domains may increase, reducing the effective superconducting loop areas for fluxons. This can be the reason for the vanishing of trapped flux at K (see Fig. 13), in the same temperature range where the giant MIT is observed, see Fig. 6(a). Our findings would imply then that the MIT has a relation to superconductivity, as has been speculated in the pastEsquinazi (2013). It is interesting to note that in spite of a nearly 100 times larger magnetoresistance at 5 K than at K (virgin state), see Fig.11(a), it shows basically the same field dependence in the low field range. The observed time relaxation of the magnetoresistance after applying a magnetic field and its change with temperature (see Fig. 21) are also compatible with the existence of vortices/fluxons.
The data presented in this study took more than one and a half years of systematic measurements in several samples. During the measurements and after temperature cycling to 390 K some of the samples several times, we recognized that the strength of the remanence decreased systematically, although the transition temperature did not change within experimental error. Note, for example, that the maximum remanence shown in Fig. 13, measured after several temperature cycles, is , whereas the same sample at the beginning of the measurements showed already at 300 K a remanence of , see Fig. 11. This relatively low temperature annealing effect has some similarity to the irreversible behavior observed in the magnetization of a HOPG sample with interfaces after heating it above 400 KScheike et al. (2013). Because the remanence depends on the pinning strength and this on the characteristics of the superconducting regions (size, defects, etc.), it appears plausible that this low-temperature annealing influences the remanence and should be taken into account in future experiments. Note that the domains exhibiting rhombohedral stacking in thin graphite flakes are stable to C Lui et al. (2011) and to C in bulk graphiteMatuya (1956); Freise and Kelly (1963). Therefore, annealing effects appear to be more related to the annealing of certain defects or even hydrogen diffusion than structural changes at the interfaces.
The existence of a superconducting transition in graphite samples at such high temperatures clarifies to some extent the origin of the superconducting-like behavior of different graphite samples reported in the last 40 yearsEsquinazi (2013). Those reports were not taken seriously by most of the scientific community. Future studies should clarify the origin of the superconductivity and the characteristics of the trapped flux or pinned entities using methods that allow, for example, its local visualization at the sample surface.
Acknowledgements.
P.D.E. gratefully acknowledges fruitful discussions with: J. G. Rodrigo, also for kindly sharing his unpublished low-temperature STM results on graphite; T. Heikkilä and G. Volovik for explaining their thoughts about high-temperature superconductivity at the interfaces of graphite and the flat-band effects. A.C. acknowledges the Nacional de Grafite Ltda., Itapecerica - MG in Brazil for supplying the graphite samples. C.E.P. gratefully acknowledges the support provided by The Brazilian National Council for the Improvement of Higher Education (CAPES).References
- Drozdov et al. (2015) A. P. Drozdov, M. I. Eremets, I. A. Troyan, V. Ksenofontov, and S. I. Shylin, Nature 525, 73 (2015).
- Bianconi and Jarlborg (2015) A. Bianconi and T. Jarlborg, European Phys. Lett. 112, 37001 (2015).
- Yudin et al. (2014) D. Yudin, D. Hirschmeier, H. Hafermann, O. Eriksson, A. I. Lichtenstein, and M. I. Katsnelson, Phys. Rev. Lett. 112, 070403 (2014).
- Khodel and Shaginyan (1990) V. A. Khodel and V. R. Shaginyan, JETP Letters 51, 553 (1990).
- Volovik (1994) G. Volovik, JETP Lett. 59, 830 (1994).
- Volovik (2013) G. E. Volovik, J Supercond Nov Magn 26, 2887 (2013).
- Peotta and Törmä (2015) S. Peotta and P. Törmä, Nature Communications 6, 8944 (2015).
- Kopnin et al. (2013) N. B. Kopnin, M. Ijäs, A. Harju, and T. T. Heikkilä, Phys. Rev. B 87, 140503 (2013).
- Muñoz et al. (2013) W. A. Muñoz, L. Covaci, and F. Peeters, Phys. Rev. B 87, 134509 (2013).
- Pierucci et al. (2015) D. Pierucci, H. Sediri, M. Hajlaoui, J.-C. Girard, T. Brumme, M. Calandra, E. Velez-Fort, G. Patriarche, M. G. Silly, G. Ferro, V. Souliere, M. Marangolo, F. Sirotti, F. Mauri, and A. Ouerghi, ACS Nano 9, 5432 5439 (2015).
- Antonowicz (1974) K. Antonowicz, Nature 247, 358 (1974).
- Antonowicz (1975) K. Antonowicz, phys. stat. sol. (a) 28, 497 (1975).
- Kopelevich et al. (2000) Y. Kopelevich, P. Esquinazi, J. Torres, and S. Moehlecke, J. Low Temp. Phys. 119, 691 (2000).
- Esquinazi (2013) P. Esquinazi, Papers in Physics 5, 050007 (2013).
- Kawashima (2013) Y. Kawashima, AIP Advances 3, 052132 (2013).
- (16) J. Chapman, Y. Su, C. A. Howard, D. Kundys, A. Grigorenko, F. Guinea, A. K. Geim, I. V. Grigorieva, and R. R. Nair, arXiv:1508.06931.
- Ludbrook et al. (2015) B. M. Ludbrook, G. Levy, P. Nigge, M. Zonno, M. Schneider, D. J. Dvorak, C. N. Veenstra, S. Zhdanovich, D. Wong, P. Dosanjh, C. Stra er, A. Stohr, S. Forti, C. R. Ast, U. Starke, and A. Damascelli, Proc. Natl. Acad. Sci. U. S. A. 112, 11795 (2015).
- Ichinokura et al. (2016) S. Ichinokura, K. Sugawara, A. Takayama, T. Takahashi, and S. Hasegawa, ACS Nano 10, 2761 (2016).
- San-Jose and Prada (2013) P. San-Jose and E. Prada, Phys. Rev. B 88, 121408(R) (2013).
- Esquinazi et al. (2014) P. Esquinazi, T. T. Heikkilä, Y. V. Lysogoskiy, D. A. Tayurskii, and G. E. Volovik, JETP Letters 100, 336 (2014), arXiv:1407.1060.
- Spemann et al. (2014) D. Spemann, P. Esquinazi, A. Setzer, and W. Böhlmann, AIP Advances 4, 107142 (2014).
- Hattendorf et al. (2013) S. Hattendorf, A. Georgi, M. Liebmann, and M. Morgenstern, Surface Science 610, 53 (2013).
- Lin et al. (2012) Q. Lin, T. Li, Z. Liu, Y. Song, L. He, Z. Hu, Q. Guo, and H. Ye, Carbon 50, 2369 (2012).
- Kelly (1981) B. T. Kelly, Physics of Graphite (London: Applied Science Publishers, 1981).
- García et al. (2012) N. García, P. Esquinazi, J. Barzola-Quiquia, and S. Dusari, New Journal of Physics 14, 053015 (2012).
- Scheike et al. (2012) T. Scheike, W. Böhlmann, P. Esquinazi, J. Barzola-Quiquia, A. Ballestar, and A. Setzer, Adv. Mater. 24, 5826 (2012).
- Scheike et al. (2013) T. Scheike, P. Esquinazi, A. Setzer, and W. Böhlmann, Carbon 59, 140 (2013).
- Ballestar et al. (2013) A. Ballestar, J. Barzola-Quiquia, T. Scheike, and P. Esquinazi, New J. Phys. 15, 023024 (2013).
- Kempa et al. (2003) H. Kempa, H. C. Semmelhack, P. Esquinazi, and Y. Kopelevich, Solid State Commun. 125, 1 (2003).
- (30) M. Zoraghi, J. Barzola-Quiquia, M. Stiller, A. Setzer, P. Esquinazi, G. H. Kloess, T. Muenster, T. Löhmann, and I. Estrela-Lopis, arXiv:1603.06365.
- Gardner et al. (2011) H. J. Gardner, A. Kumar, L. Yu, P. Xiong, M. P. Warusawithana, L. Wang, O. Vafek, and D. G. Schlom, Nature Phys. 7, 895 (2011).
- Wang et al. (2012) Z. Wang, W. Shi, R. Lortz, and P. Sheng, Nanoscale 4, 21 (2012).
- Esquinazi et al. (2008) P. Esquinazi, N. García, J. Barzola-Quiquia, P. Rödiger, K. Schindler, J.-L. Yao, and M. Ziese, Phys. Rev. B 78, 134516 (2008).
- Dusari et al. (2011) S. Dusari, J. Barzola-Quiquia, and P. Esquinazi, J Supercond Nov Magn 24, 401 (2011).
- Barzola-Quiquia et al. (2008) J. Barzola-Quiquia, J.-L. Yao, P. Rödiger, K. Schindler, and P. Esquinazi, phys. stat. sol. (a) 205, 2924 (2008).
- Gurevich and Küpfer (1993) A. Gurevich and H. Küpfer, Phys. Rev. B 48, 6477 (1993).
- Esquinazi et al. (2010) P. Esquinazi, J. Barzola-Quiquia, D. Spemann, M. Rothermel, H. Ohldag, N. García, A. Setzer, and T. Butz, J. Magn. Magn. Mat. 322, 1156 (2010).
- Ji et al. (1993) L. Ji, M. S. Rzchowski, N. Anand, and M. Thinkam, Phys. Rev. B 47, 470 (1993).
- Watanabe et al. (2007) N. Watanabe, A. Nakayama, and S. Abe, J. Appl. Phys. 101, 09G105 (2007).
- imnek (1994) E. imnek, Inhomogeneous Superconductors, International Series of monographs on Physics (Oxford University Press, 1994).
- Pearl (1964) J. Pearl, Applied Physics Letters 5, 65 (1964).
- Lui et al. (2011) C. H. Lui, Z. Li, Z. Chen, P. V. Klimov, L. E. Brus, and T. F. Heinz, Nano Lett. 11, 164 (2011).
- Matuya (1956) E. Matuya, Nature 178, 1459 (1956).
- Freise and Kelly (1963) E. J. Freise and A. Kelly, Philos. Mag. A 8, 1519 (1963).