Extinction Law at a Distance up to 25 kpc toward the Galactic Poles
Pulkovo Astronomical Observatory, Russian Academy of Sciences, Pulkovskoe sh. 65, St. Petersburg, 196140 Russia
Key words: interstellar extinction, reddening, interstellar dust grains, characteristics and properties of the Milky Way Galaxy, interstellar medium.
Photometry from the Tycho-2, 2MASS, and WISE catalogues for clump and branch giants at a distance up to 25 kpc toward the Galactic poles has allowed the variations of various characteristics of the infrared interstellar extinction law with distance to be analyzed. The results obtained by the extinction law extrapolation method are consistent for different classes of stars and different characteristics as well as with previous studies. The conventional extinction law with a low infrared extinction is characteristic of only a thin layer no farther than 100 pc from the Galactic plane and of two thin layers near and pc. Far from the Galactic plane, in the Galactic halo, the infrared extinction law is different: the extinction in the , , , , and bands is, respectively, , , , , and of the extinction in the band. The accuracy of these coefficients is . If the extinction law reflects primarily the grain size distribution, then the fraction of large dust grains far from the Galactic plane is greater than that in the circumsolar interstellar medium.
INTRODUCTION
The wavelength dependence of interstellar extinction (extinction law) had long seemed constant in space and time and was expressed by one extinction coefficient . Variations of the extinction law were admitted only in some dense clouds and star-forming regions. The data on stars and the interstellar medium predominantly no farther than 100 pc from the Galactic plane served as a basis for such a view. However, the Tycho-2 (Høg et al. 2000), 2MASS (Skrutskie et al. 2006), WISE (Wright et al. 2010), and other catalogues with accurate multiband photometry for faint stars over the entire sky in various wavelength ranges cover more distance regions.
The extinction law is apparently difficult to express by one coefficient . Therefore, other characteristics of the extinction law, primarily in the infrared (IR), are also used in present-day studies.
Using multiband IR photometry, Zasowski et al. (2009) and Gao et al. (2009) were the first to reliably detect large-scale (over many kpc) systematic spatial variations of the extinction law in the diffuse medium in the inner Galactic disk relative to the Sun. The infrared-to-visual extinction ratio was found to decrease with increasing distance from the Galactic center (i.e., a larger IR extinction corresponds to a denser medium). However, they also found a flatter extinction law in the interarm space than that in the arms (i.e., the IR extinction increases with decreasing density of the medium). Berlind et al. (1997) determined the visual and near-IR ( microns) extinction law based on photometry for the galaxy IC 2163, which is partially occulted by the galaxy NGC 2207, and found a flat law with in the spiral arms at and an even flatter one in the interarm space at .
These contradictory results are interpreted by Wang et al. (2013) as the existence of three types of environment in the Galaxy: dense clouds with relatively coarse dust and large IR extinction, a diffuse environment of spirals with fine dust and small IR extinction, and a translucent environment between the arms with the same extinction law as that for dense clouds. The similarity of the first and third environments was emphasized by Wang et al. (2013): the temperature is low, the gas is molecular, and the charged particles are few. The coalescence of dust grains apparently dominates over their fragmentation in the clouds due to their high density, the fragmentation dominates over the coalescence in the spiral arms due to their high temperature, and there are no grain-fragmenting processes in the translucent environment itself.
Gontcharov (2013a) and Schultheis et al. (2015) confirmed these trends and the results of Zasowski et al. (2009) and Gao et al. (2009) using different photometric data for the Galaxy, while Hutton et al. (2015) found the same for the galaxy M 82 ( initially falls with increasing distance from the Galactic center and then grows over many kpc). Gontcharov (2013b) found the IR extinction law outside the Galactic plane, at distances pc from it ( is the coordinate toward the north Galactic pole), to be flatter than that near the Galactic plane. Using Tycho-2 and 2MASS photometry, Gontcharov (2012a) found to vary from 2.2 to 4.4 within the kiloparsec nearest to the Sun.
As a result of these studies, a dichotomy of the Galactic dust medium is hypothesized. According to this hypothesis, a thin layer of the medium in the spiral arms is the only region in the Galaxy where the interstellar extinction is essentially selective, i.e., the ratio of long-wavelength extinction to shortwavelength one is minimal. This region also includes the Galactic solar neighborhoods. By studying mostly them, we attributed an essentially selective extinction to the entire Galactic interstellar medium. However, in the remaining regions of the Galaxy, i.e., at the center, on the disk periphery, and far from the Galactic plane, the extinction is less selective, i.e., the ratio of long-wavelength extinction to shortwavelength one is, on average, larger than that in the layer near the Galactic plane.
If the extinction law reflects primarily the grain size distribution, then the mentioned studies and hypothesis suggest that there is more fine dust in a thin layer near the Galactic plane, while there is more coarse dust at the Galactic center, on the disk periphery, and far from the Galactic plane.
The main goal of this study is to analyze the spatial variations of the extinction law outside the Galactic disk at various distances from the Galactic plane up to the maximum possible ones using different photometric data for different samples of stars. The study is limited only to the directions toward the Galactic poles.
ORIGINAL DATA
Clump and branch giants, as high-luminosity stars represented abundantly at high Galactic latitudes at great distances from the Sun, are used in this study. The former are stars with nuclear reactions of helium conversion into carbon in the stellar core. The latter are stars with nuclear reactions of hydrogen conversion into helium in the shell above the helium core (irrespective of whether helium is converted into carbon in the core, i.e., both branch giants and asymptotic branch giants, because their spectral energy distributions are quite similar). Since some of the branch giants have the same absolute magnitude and temperature as do the clump giants, the most luminous and red part of the branch is meant by the branch giants in this study to separate them.
In this study, just as in all the mentioned studies of the large-scale spatial variations of the extinction law, we apply the extinction law extrapolation method alternatively called the color ratio method. It was described, for example, by Straizys (1977) and Majewski et al. (2011). As was shown by Gontcharov (2012a), a complete or almost complete sample of a large number of stars with a similar spectral energy distribution distributed fairly uniformly in space is needed for this method. The reddening and extinction in the region of space under consideration must be great compared to the photometric accuracy. Clump and branch giants are suitable for this method, but they must be considered separately, because their spectral energy distributions are quite different.
Any samples from modern catalogues are at best almost complete, because they are devoid of (1) components of unresolved binary systems and (2) variable stars with the sought-for average spectral energy distribution. Such variables also account for some fraction of red giants. In an unresolved binary system, the total spectral energy distribution differs significantly from the distribution for each of the components if they have approximately equal magnitudes but significantly different colors. B- and A-type stars are such pairs for red giants, but both components of the pair then have the same young age of yr and a mass greater than 2 . There are few such stars, especially far from the Galactic plane. However, as Gontcharov et al (2011) showed, the hot subdwarfs located among the B stars on the Hertzsprung–Russell diagram can have any age in the range Gyr and any mass greater than 0.5 . The number of such stars in the region of space under consideration can be estimated from above only roughly by noting that there is no hot subdwarf within 5 pc of the Sun, where all stars (56) are apparently known. Therefore, it can be assumed that no more than 2% of the red giants did not fall into the samples under consideration, hiding near hot subdwarfs.
The Tycho-2, 2MASS, and WISE (the new All-WISE version published in 2013) catalogues being used are complete toward the Galactic poles and have a photometric accuracy better than (the median accuracy is about ) in the range of magnitudes given in Table 1.
A serious problem of modern astronomy, which, in particular, hinders the establishment of accurate calibrations for astrophysical quantities, is that accurate trigonometric parallaxes are known predominantly for bright stars, for which there is no accurate IR photometry. For example, it can be seen from Table 1 that the WISE catalogue has accurate photometry for nearby and, hence, bright stars only in the and bands, though less accurate but still acceptable photometry with an accuracy of in the and bands for many bright stars allows acceptable results to be obtained in the range of distances given in parentheses in Table 1. One method of solving the problem with IR photometry for bright stars was proposed and implemented by Gontcharov (2011). The photometry for branch giants in the band from the 2MASS catalogue was calibrated using their photometry at 12 microns from the IRAS catalogue (IRAS 1988). This gave the Ks magnitudes for stars brighter than with an accuracy of . Although this is an order of magnitude less accurate photometry than that for stars with , a large number of bright stars when averaging the data allows a comparatively high accuracy of their mean photometric characteristics to be achieved in large cells of space. However, doubts about the reality of the corresponding results obtain by Gontcharov (2012 ) remained. As we will see below, these doubts will be dispelled in this study, where the and magnitudes will be used instead of the magnitude.
Clump and branch giants with an age older than 3 Gyr (Gontcharov 2008, 2011) and metallicity (for a discussion of the metallicity, see below) prevail toward the Galactic poles. To avoid confusion, the metallicity is designated everywhere below as , while one of the Galactic coordinates is designated as . The mean absolute magnitudes of clump giants for such ages and their metallicities are given in Table 1 in accordance with the PARSEC database of theoretical evolutionary tracks and isochrones of stars (it is also known as the Padova database, http://stev.oapd.inaf.it/cmd; Bressan et al. 2012). The clump of giants implies a small scatter of their absolute magnitudes: only about the PARSEC calibration adopted in this study:
| (1) |
where is the dereddened color. The above calibration accuracy of corresponds to a relative accuracy of 2.5% for the derived distances.
Similarly, the giants of the branch in its red part have absolute magnitudes in the range from to given in Table 1. The PARSEC calibration was adopted for the branch giants:
| (2) |
The scatter of for individual stars relative to it is . Accordingly, the relative accuracy of the derived distances is 50%, which is a factor of 20 poorer than that for the clump giants.
Given the constraints on extinction toward the poles, from to , it follows from these data that almost complete samples of stars with accurate photometry can be obtained in the ranges of distances from to listed in Table 1. However, the fraction of red dwarfs in the sample increases with magnitude. At the sample of giants is very difficult to clean of the dwarfs. Therefore, in the studies performed so far, is sometimes considerably smaller than that given in Table 1. For example, Gontcharov (2013b) adopted the constraint and, consequently, pc for the sample of clump giants.
|
Since IR photometry at least in one band is needed for a successful application of the method, we see from Table 1 that the method is efficient toward the poles:
-
•
in the range pc when using the branch giants common to Tycho-2 (, ) and 2MASS (), it was implemented by Gontcharov (2012a);
-
•
in the same range of distances for the branch giants common to Tycho-2 (, ) and WISE (, ), it was implemented in this study;
-
•
in the range pc for the clump giants common to 2MASS (, ) and WISE (, ), it was implemented by Gontcharov (2013b) for the range pc () using photometry from the old WISE version; it was implemented again in this study with photometry from the new WISE version at ;
-
•
in the range pc for the branch giants common to MASS (, , ) and WISE (, ), it was implemented in this study.
Thus, in three parts of this study, three different samples of stars in three ranges of distances are used to analyze the extinction law. These results are then compared between themselves and with the extinction law from Weingartner and Draine (2001; below referred to as WD2001). At it is presented in the row of Table 1 (we have in mind the standard band with nm, as distinct from the band with nm). For microns this law is consistent with the law adopted in the PARSEC database based on Cardelli et al. (1989) and other laws at .
slightly depends on the characteristics of stars, but it may be considered constant for the entire variety of giants with an accuracy in the infrared sufficient for us.
BRANCH GIANTS CLOSER THAN 700 pc
Based on photometry from the Tycho-2 and 2MASS catalogues, Gontcharov (2011) selected 30 671 KIII branch giants. The photometric distance was calculated for each of them. Toward the Galactic poles, this must be an almost complete sample of stars of this class up to a distance of 700 pc from the Sun. Based on the photometry of these stars from the same catalogues, Gontcharov (2012a) determined the spatial variations of the extinction coefficient
| (3) |
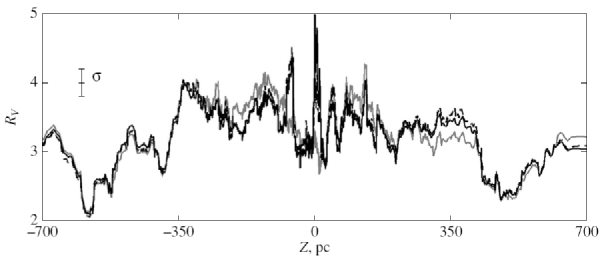
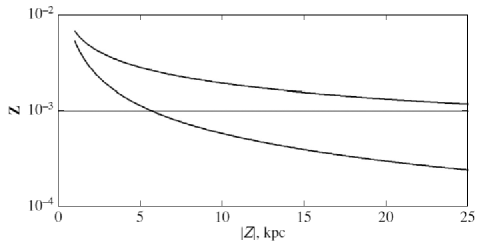
In this study, for comparison with other results, we will present some of the results from Gontcharov (2012a) in a different form. For the same photometric data, we will determine the variations with coordinate for a subsample of the original 30 671 branch giants falling into the cylinder with a radius of 150 pc around the Sun elongated along the axis. The radius of the cylinder is chosen in such a way that, according to Gontcharov (2012a; see Fig. 6 there), there are no significant variations of the coefficient in the and directions inside it. Such a cylinder turns out to contain 1355 stars. The drop in their density in the range pc corresponds to the barometric law, suggesting that the sample in this range is complete. Instead of the division into regions of space (as was done by Gontcharov (2012a)), here we apply a moving averaging of the coefficient along the coordinates over 40 points. The result is represented by the gray solid curve in Fig. 1 (it coincides almost everywhere with the black solid curve and the black dashed curve that are discussed below). This curve represents the same results as those in Fig. 6 from Gontcharov (2012a) and in Fig. 1 from Gontcharov (2013b).
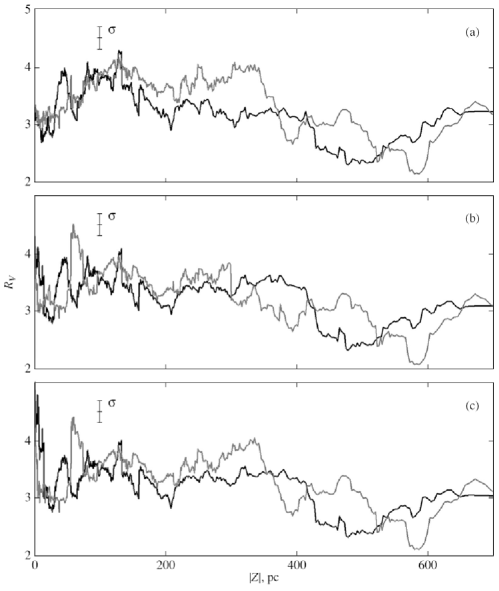
Figure 2a compares the results for the northward (black curve) and southward (gray curve; is taken instead of ) directions. The curves are seen to show some anticorrelation: the minima of one curve correspond to the maxima of the other curve and vice versa. In any case, this appears as if the dust medium northward of the Galactic plane “knows” about the state of the medium at the same distance southward of this plane. Gontcharov (2013b) was the first to describe this effect and assumed its periodic pattern depending on the coordinate. This is explainable if the dust medium at different distances from the Galactic plane is assumed to have formed or changed simultaneously at the same northward and southward. This can be either a manifestation of density waves in the vertical direction or a result of symmetric processes during the formation of the Galaxy. In addition, this phenomenon can be an artefact that arose during the calculations or a systematic error of the photometry from the 2MASS catalogue, which was observed by two-ground based telescopes from the Earth s northern and southern hemispheres.
To test the latter assumption, let us exclude the ground-based results: for the same branch giants, we will use the same Tycho-2 photometry and the and bands from the new WISE version. Instead of estimating the coefficient from Eq. (3), we will estimate it from the formulas
| (4) |
| (5) |
The proportionality factors in Eqs. (4) and (5) were chosen in such a way that the values of obtained from Eqs. (3)–(5) in this study were, on average, equal in the range pc under consideration. Thus, in all three cases, we have and the corresponding factors in Eqs. (4) and (5) are and . They agree with those according to the WD2001 law: and . The corresponding nonzero extinction in the W3 and W4 bands, i.e., at and 22 microns, is produced by silicates (Li 2005).
The derived dependences of the quantities (4) and (5) are indicated in Fig. 1 by the black solid curve and the black dashed curve, respectively (a moving averaging over 40 points was applied). The accuracy of all results in Fig. 1 is approximately the same and can be estimated as in accordance with the results from Gontcharov (2012a) (the vertical bar in Fig. 1).
The agreement between all curves in Fig. 1 is so good that they largely merge together. They diverge noticeably only for , , and pc. The accuracy of the and photometry in this range of distances is higher than that of the photometry, which, as has been noted above, was calibrated mainly based on IRAS photometry. Therefore, the black curves are more trustworthy, though the difference between the curves does not indicate that some of them are erroneous: the three coefficients under consideration reflect the extinction law for different wavelengths.
The steep rise of the black curves at pc apparently reflects an enhanced content of large dust grains in the immediate Galactic neighborhoods of the Solar system predominantly northward of the Galactic plane. This result is consistent with the result of Krüger et al. (2015), who detected an enhanced concentration of large (more than 1 microns) grains in the interstellar dust flow entering the Solar system precisely from the northern Galactic hemisphere together with the flow of neutral hydrogen and helium based on data from the dust detector onboard the Ulysses spacecraft. Moreover, the Galactic coordinates of the entry point of this flow into the Solar system (near , ) and the exit point opposite to it (near , ) roughly correspond to the regions of maximum extinction in the Gould Belt (, and , ) detected by Gontcharov (2009, 2012b). Thus, the investigation of dust grains in the Solar system and the photometry of stars in its neighborhoods consistently show the connection between the Solar system and the Gould Belt as a container of dust and gas.
Apart from the peaks, all curves show a minimum near the Galactic plane at pc, maxima at pc, minima (even deeper than near the Galactic plane) at and pc, and again rise at larger . These variations are very large, from 2.1 to 4.3 (even if the peak at is ignored), and were discussed in detail by Gontcharov (2012a, 2013b).
In Figs. 2b and 2c, the results northward and southward of the Galactic planes are compared just as in Fig. 2a but for the quantities (4) and (5), respectively. All of the same effects are seen. Consequently, the match between the variations northward and southward of the Galactic plane is not a systematic error of the 2MASS photometry. However, the periodicity of the variations with , especially with a half-period of 656 pc, pointed out by Gontcharov (2013b) is imperceptible on both graphs. This periodicity may be a mathematical artefact.
CLUMP GIANTS CLOSER THAN 5 kpc
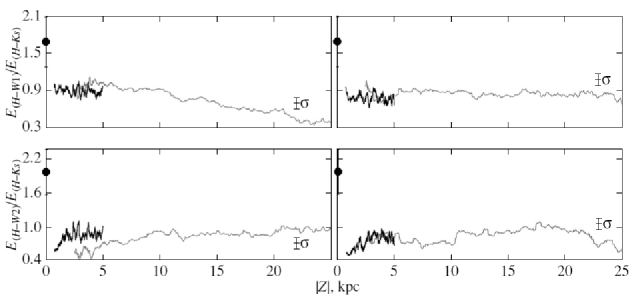
Gontcharov (2013b) selected 2333 and 2483 clump giants with accurate 2MASS and WISE (the old version, the W1 and W2 bands) photometry in fields with a radius of around the north and south Galactic poles, respectively. The photometric distances were calculated for all stars. The derived variations of and in these fields with (rather than the distance, as in Gontcharov (2013b)) are indicated in Fig. 3 by the gray curves: on the left and the right for the north and south poles, respectively.
A new, more accurate and extensive version of the WISE catalogue based on a larger number of observations, AllWISE, has been published since then. By the same method in the same fields and in the same range, we have now selected 2415 clump giants instead of 2333 toward the north pole and 2640 instead of 2483 toward the south one. More accurate photometry now allows us to adopt the constraint instead of and, accordingly, pc instead of pc. This allowed the number of giants under consideration to be increased to 4661 and 5108 toward the north and south poles, respectively. In addition, instead of the calibration , as in Gontcharov (2013b), we will adopt the calibration (1) that takes into account the metallicity variations.
The variations of and with averaged over 200 points are indicated in Fig. 3 by the black curves. The vertical bar indicates the accuracy of the result. It barely changes with distance, because the photometric accuracy and the sample completeness barely change. The differences between the black and gray curves seen in the figure are insignificant.
BRANCH GIANTS FAR FROM THE SUN
Branch giants are more luminous than clump giants. This allows them to be used to analyze the extinction law at a greater distance from the Galactic plane. However, as has been pointed out previously, we pay the price of a factor of 20 poorer distance accuracy for this. In addition, the stellar density is considerably lower far from the Galactic plane. Therefore, it makes no sense to analyze the short-period variations of the extinction law using branch giants: they are smoothed out by inaccurate distances. However, the systematic variations of this law can be analyzed on scales of several kpc.
To get a sufficient number of stars, we had to increase the radius of the fields around the Galactic poles used in this section to instead of in the previous section. They turned out to contain 356 703 and 376 984 stars with and accurate (better than ) photometry from 2MASS and the new WISE version in five bands: , , , , and .
From among such a large number of stars, we selected the few branch giants based on color–color diagrams. An important feature of the infrared color–color diagrams for the neighborhoods of the Galactic poles is that the stars are located on or near the line of normal colors (zero reddening), because the extinction and reddening are very small. The observed distribution of all field stars on the diagram was compared with the theoretical distribution based on PARSEC isochrones. Five-band photometry gives 45 different color–color diagrams. The analysis was performed for all diagrams, but some of them turned out to be particularly informative and are considered here.
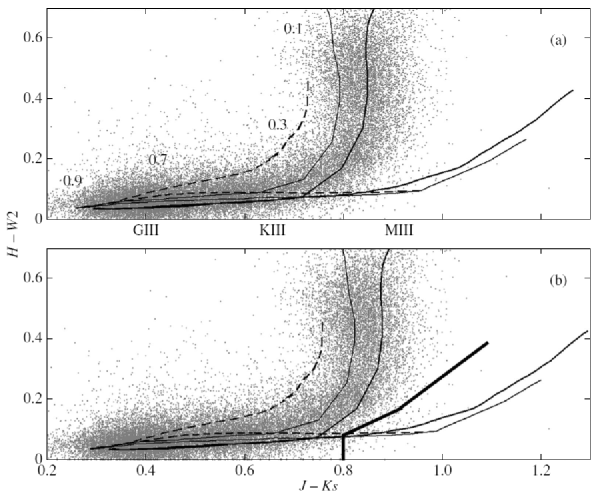
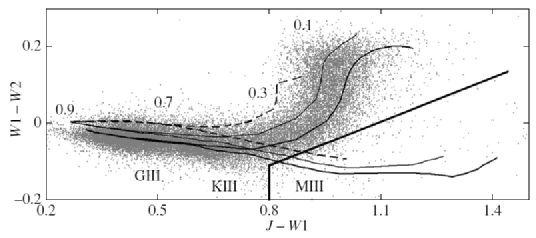
Figure 4 shows the – diagram for the region with a radius of 6∘ (instead of 20∘ for the convenience of demonstration) around the north pole. For the south pole and the regions with a radius of 20∘, the diagrams look the same, and all of the patterns found are retained. The stars are indicated by the gray cloud of points. The isochrones (in Fig. 4a without any correction for reddening) for the stages from red dwarfs to the tip of the giant branch are superimposed on it: the dashed curve is for an age of 10 Gyr and metallicity (characteristic of the boundary of the thick disk and the halo), the thin curve is for an age of 10 Gyr and metallicity , and the thin smooth curve is for an age of 6 Gyr and metallicity (solar metallicity, according to the PARSEC database). Approximate averaged stellar characteristics are given near the isochrones. The stellar masses in solar masses are shown near the main sequence extending from the top to the left: 0.1, 0.3, 0.7, and 0.9. In the lower left corner, the isochrones turn sharply when passing from the main sequence to the stage of giants. The corresponding classes of giants are given near the isochrones: GIII, KIII, and MIII. The MIII stars are the needed branch giants.
It is immediately apparent that using this and similar – diagrams, we can reject the bulk of the main sequence and the clump giants through the condition and the condition obtained similarly.
The cloud of points in Fig. 4 is shifted by interstellar reddening. The latter can be determined. As can be seen from the cloud position relative to the isochrones, if the reddening is disregarded, then most of the stars turn out to have approximately solar metallicity and age. However, even for red dwarfs with having and, consequently, pc, i.e., located behind the bulk of the absorbing layer, the reddening is significant, while the solar metallicity is atypical. According to Peng et al. (2012) and Schlesinger et al. (2014), who analyzed many studies of the vertical metallicity gradient in the Galaxy, on average, at pc. For this condition to be met, the isochrones must be shifted so that most of the red dwarfs are between the isochrones and . The shift is exactly the mean reddening at pc toward the north Galactic pole: . was obtained for the south pole by the same method. These estimates were used in the calibrations (1) and (2). This independent reddening estimate near the Galactic poles completely agrees with the estimate from Gontcharov (2012b). The isochrones shifted by the reddening are shown against a background of the same cloud of stars in Fig. 4b. The thickest polygonal line here indicates the boundary adopted in this study to separate the branch giants (to the rightward and below the line) from the remaining stars. This line is drawn as the bisectrix of the angle between the actual isochrones for red dwarfs and branch giants but with allowance made for the photometric errors and for the fact that although there are branch giants among the stars bluer than some limit, they are lost among the remaining stars (on the diagram, this limit is ).
In the region of red dwarfs and branch giants, the positions of the isochrones change only slightly with age: the isochrones of the same metallicity with an age from 6 to 12 Gyr coincide within the accuracy of the photometry used (). However, in contrast to the age, the metallicity of the stars under consideration is determined very accurately from their positions relative to the isochrones. Whereas for most comparatively close red dwarfs , for much more distant branch giants, as can be seen from Fig. 4b, the isochrones and go to the right much farther than the real stars. The corresponding characteristic, the length of the giant branch, is a good metallicity proxy. It follows from this characteristic that most of the branch giants in our sample for both poles have a metallicity in the range . This estimate is consistent with other few estimates of the vertical metallicity gradient in the Galaxy in the range of distances kpc under consideration (Kordopatis et al. 2011; Posbic et al. 2012; Carrell et al. 2012; Peng et al. 2012; Katz et al. 2011; Bilir et al. 2012; Gontcharov 2013b). Within the error limits, all these estimates are between the two functions indicated in Fig. 5 by the curves: . In this study, the distribution of branch giants with different relative to the isochrones also allows the vertical gradient to be estimated: it coincides with the upper curve in the figure, i.e., .
Another example of a highly informative color–color diagram, – , is shown in Fig. 6 for the north Galactic pole without any correction for reddening (the diagram for the south pole looks similar). The masses of dwarfs and the classes of giants are given near the isochrones, just as in Fig. 4. Although theoretically , it can be seen from the figure that most of the red dwarfs (the top of the cloud of points) lie between the isochrones and 0.015. This means that the reddening for these stars (i.e., within 400 pc of the Sun) is . The rest of the cloud of points (i.e., more distant stars) shows some reddening. Exactly the same picture is also seen for the south pole and on the – diagram. The simplest explanations of this are as follows: (1) the WISE photometry differs systematically from the 2MASS photometry, or (2) the isochrones for the and bands are slightly erroneous, or (3) the extinction in the range from to is actually “gray”, i.e., does not depend on the wavelength, i.e., . The latter explanation is confirmed below, though it does not reject the remaining ones.
The thickest polygonal line in Fig. 6 is the line separating the branch giants (to the right and lower) from the remaining stars.
As a result, we selected 804 and 1068 branch giants in the entire range of distances in the regions with a radius of 20∘ around the north and south poles, respectively.
The variations of the absolute magnitudes with are interesting for checking our sample of branch giants. At kpc the stars fill the entire range . At kpc the faint stars gradually disappear from the sample. This must distort significantly the results. Therefore, we consider them only in the range kpc. Here, 523 and 698 stars were selected for the north and south poles, respectively.
The variations of and with averaged over 100 points are shown in Fig. 7 as the gray curves (for the north and south Galactic poles, on the left and the right, respectively). The vertical bar indicates the accuracy of this result in the range kpc. In the range kpc, the accuracy is slightly higher due to the larger number of stars per unit distance. The black curves in the same figure were taken from the previous section of this study, i.e., these are the variations of and with derived from the clump giants and indicated by the black curves in Fig. 3. We see good agreement between the corresponding black and gray curves in the common range of distances. On average, for the two poles and . For comparison, the same characteristics from Zasowski et al. (2009) and Gontcharov (2013a) near the Galactic plane averaged over all longitudes far from the directions to the Galactic center and anticenter are indicated by the circles in Fig. 7. Their scatter of is indicated by the vertical bars. Despite the variations, the characteristics and in and far from the Galactic plane differ by more than the variation amplitude. and near the Galactic plane almost everywhere, while and far from it almost everywhere. This is the main result of our study: the IR extinction anywhere far from the Galactic plane (in fact, in the Galactic halo) bears no resemblance to that near the plane.
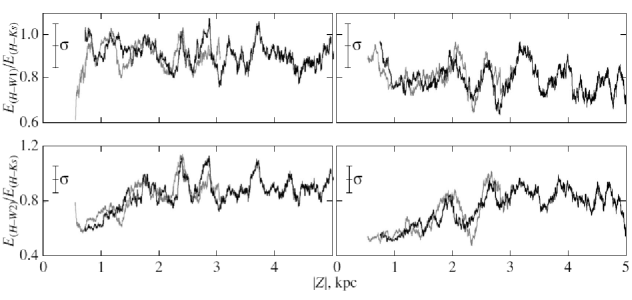
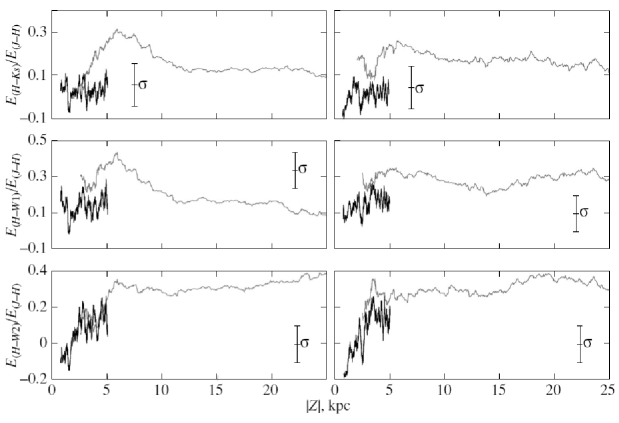
Using the color excess everywhere as the denominator, we apply it as a “standard ruler”. However, this color excess is very small toward the Galactic poles. To check the results, we will take a longer ruler, the color excess , and consider , , . Their variations with are shown in Fig. 8 for the north and south Galactic poles on the right and the left, respectively. Here, as in Fig. 7, the gray and black curves indicate the results for branch giants and clump giants from the previous section, respectively. As in Fig. 7, the vertical bar indicates the accuracy of the result in the range kpc. We see good agreement between the results for the two classes of objects. The differences are explained by the fact that the spectral energy distributions for the clump and branch giants in the band differ significantly (approximately by , in contrast to the remaining bands under consideration, where the difference is less than ). Therefore, even a small admixture of clump giants in the sample of branch giants and vice versa distorts the average spectral energy distribution for the sample and, consequently, the result. On average, , , .
DISCUSSION
The “WD2001” column in Table 2 gives the theoretical characteristics of the extinction law according to the WD2001 model at . The “” column in Table 2 gives the characteristics of the IR extinction law from Zasowski et al. (2009) and Gontcharov (2013a) for the Galactic disk averaged over all longitudes far from the directions to the Galactic center and anticenter. The characteristics are given with their standard deviations in the entire range of distances under consideration, which exceed appreciably the accuracies of the characteristics for specific distances due to their long-period spatial variations. The observed characteristics are seen to be consistent with WD2001 within the limits of the standard deviation. The same table shows much greater differences between the extinction laws in the Galactic plane (according to WD2001 or Zasowski et al. (2009) and Gontcharov (2013a)) and far from it according to the results of this study (in the “large ” column, where the standard deviation of the results in the entire range under consideration is also indicated). The main result of this study shown in Fig. 7 is seen in the “” and “” rows of the table: values that differ by standard deviations were obtained from stars of the same class from the same catalogues and by the same method near and far from the Galactic plane. The differences are so big that they leave no doubt about their reality.
|
The IR extinction law has been investigated by many authors. An overview of the observations was given by Wang et al. (2014), while an overview of the corresponding models was given by Wang et al. (2015). Their comparison suggests the presence of carbon grains with a radius of more than one micron in the medium. They produce the emission at wavelengths up to 1 mm detected by the COBE/DIRBE, COBE/FIRAS, and Planck telescopes. The model of Zubko et al. (2004) with composite grains including silicates, graphite (or amorphous carbon), an organic and water ice mantle, and voids shows the closest correspondence to the observations (though the WD2001 model is mentioned more often and, therefore, is adopted below as a standard for comparison).
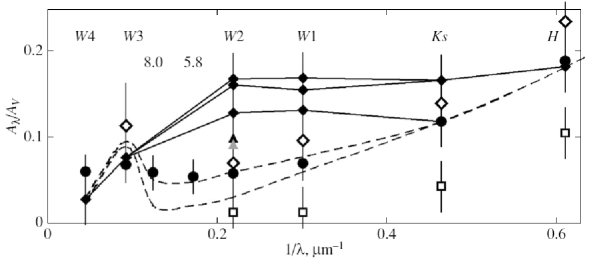
However, almost all observations of the IR extinction law refer to dense clouds near the Galactic plane or toward the Galactic center. Here, coincident results, within the error limits, were obtained by Lutz (1999), Indebetouw et al. (2005), Jiang et al. (2006), Flaherty et al. (2007), Nishiyama et al. (2009), Fritz et al. (2011), Chen et al. (2013), and Gao et al. (2009). The extinction law averaged over them as a function of for the , , Spitzer/IRAC 8 microns, Spitzer/IRAC 5.8 microns, (or Spitzer/IRAC 4.5 microns), (or Spitzer/IRAC 3.6 microns), , and bands is indicated by the circles in Fig. 9. For comparison, the WD2001 laws at and 5.5 are indicated by the lower and upper dashed curves, respectively. The observations are seen to fall nicely on the WD2001 law at . The same IR extinction law, but with a peak at 4.5 microns, was obtained by Wang et al. (2013) in the Coalsack nebula and by Gao et al. (2013) in the dense medium of the Large Magellanic Cloud. These extinction peaks at 4.5 microns are indicated in Fig. 9 by the gray and black triangles, respectively.
Not all studies at high latitudes actually refer to the medium far from the Galactic plane. As an example of confusion, it is worth noting the paper by Larson and Whittet (2005), where the extinction law is investigated at high Galactic latitudes but within 100 pc of the Sun. Obviously, their results refer to the well-studied equatorial layer of dust with mean . To avoid confusion, “far from the Galactic plane”, or “definitely outside the Galactic equatorial layer of dust”, or “in the Galactic halo” should be written instead of the term “high latitudes”.
At present, the results of Davenport et al. (2014) are apparently the only observations of the IR extinction law that refer to the diffuse medium both near and far from the Galactic plane (at kpc): the results for and , i.e., near the Galactic plane, are indicated in Fig. 9 by the open diamonds and open squares, respectively. The closeness of the circles and open diamonds in the figure confirms the previously suggested hypothesis about the similarity of the extinction laws far from the Galactic plane, in dense clouds near this plane, and at the Galactic center.
Note that Davenport et al. (2014) found an especially dramatic increase in extinction (relative to ) in the and bands at latitudes . At latitudes , the relative extinction in and decreases, but, at the same time, the extinction in and increases dramatically. This study shows the same trend. This appears as a gradual increase of the mean grain size with distance from the Galactic plane. Davenport et al. (2014) also found the longitude dependence of the extinction law: it is flatter at longitudes near , where the Local Spiral Arm passes (but there are no studies at a longitude of ). A detailed analysis of the variations in extinction law with longitude and distance is needed.
All of the extinction laws mentioned here are relative, with the zero point, i.e., the extinction in some band taken as the true one, being different in each study. To compare the results, given that most of them in the IR are consistent with the WD2001 extinction law at , we will take this value as the zero point. Then, , , .
Three versions of the extinction law found in this study are possible, depending on precisely which of these estimates are used as the zero point. They are indicated in Fig. 9 by the filled diamonds and solid polygonal lines. In this case, the data from the right column of Table 2 are used. From and we estimated and (the two leftmost diamonds in Fig. 9) relative to the fixed ; from , and we estimated , (the middle of the three curves) relative to the fixed and ; from and we estimated and (the upper of the three curves) relative to the fixed and the estimated ; from and we estimated and (the lower of the three curves) relative to the fixed and . The accuracy of these estimates is .
Good agreement between the upper and lower curves suggests that all of the extinctions in the , , , , and bands correspond to one another within one extinction law. The only difference between the lower curve and the two remaining ones consist in its vertical shift due to the different extinction taken as the zero point. Clearly, an uncertainty in the zero point of the extinction law is the main problem in all such studies. It can be solved only by using homogeneous and highly accurate spectrophotometry in a very wide wavelength range, from the ultraviolet to the far infrared.
An independent determination of is of particular interest. Therefore, although all three versions of the derived extinction law are equivalent, as a unified result of the study we will take the mean between the upper and middle curves, i.e., , , , , . Thus, given , we have a perfectly flat extinction law in the bands from to , i.e., in the wavelength range from 1.4 to 5.4 microns, but the estimated extinction in the and bands exceeds the results by other authors by more than the declared errors. However, the results of this study were obtained at a much greater distance from the Galactic plane.
CONCLUSIONS
In this study, we receded from the Galactic plane to kpc toward the north and south Galactic poles. In doing so, we detected a conventional extinction law for the solar neighborhood with a low IR extinction only near the Galactic plane at pc and in two thin layers at pc and pc. In the rest of the vertical column with a length of 50 kpc through the entire Galaxy and the circumgalactic space, the extinction is less selective, i.e., the ratio of long-wavelength extinction to short-wavelength one is greater than that in the solar neighborhood. In the wavelength range from 1.4 to 5.4 microns (the , , and bands), the extinction law is flat, the extinction is “gray”, i.e., does not depend on the wavelength. We estimated , , , , with an accuracy of .
If the extinction law depends primarily on the grain size, then this study points to an increase in the fraction of coarse dust as one recedes from theGalactic plane and to the preservation of this state of the medium in the entire Galactic halo at least up to kpc.
We also detected an increase in the fraction of coarse dust in the immediate neighborhoods of the Solar system at pc consistent with the characteristics of the flow of coarse dust entering the Solar system apparently from the most dusty regions of the Gould Belt.
The variety of the Galactic dust medium could not be detected without highly accurate (at a level) mid-IR photometry, i.e., before the appearance of the WISE catalogue.
ACKNOWLEDGMENTS
In this study, we used results from the Hipparcos Tycho, Two Micron All Sky Survey (2MASS), and Wide-field Infrared Survey Explorer (WISE) projects as well as resources from the Strasbourg Astronomical Data Center (Centre de Donnees astronomiques de Strasbourg). The study was financially supported by the “Transient and Explosive Processes in Astrophysics” Program P-7 of the Presidium of the Russian Academy of Sciences.
References
- 1. A.A. Berlind, A.C. Quillen, R.W. Pogge, and K. Sellgren, Astron. J. 114, 107 (1997).
- 2. S. Bilir, S. Karaali, S. Ak, Ö. Önal, N.D. Dagtekin, T. Yontan, G. Gilmore, and G.M. Seabroke, Mon. Not. R. Astron. Soc. 421, 3362 (2012).
- 3. A. Bressan, P. Marigo, L. Girardi, B. Salasnich, C. Dal Cero, S. Rubele, and A. Nanni, Mon. Not. R. Astron. Soc. 427, 127 (2012), http://stev.oapd.inaf.it/cmd.
- 4. J.A. Cardelli, G.C. Clayton and J.S. Mathis, Astrophys. J. 345, 245 (1989).
- 5. K. Carrell, Y. Chen and G. Zhao, Astron. J. 144, 185 (2012).
- 6. B. Q. Chen, M. Schultheis, B. W. Jiang, O. A. Gonzalez, A. C. Robin, M. Rejkuba, and D. Minniti,, Astron. Astrophys. 550, A42 (2013).
- 7. J. R. A. Davenport, Z. Ivezic, A.C. Becker, J. J. Ruan, N. M. Hunt-Walker, K. R. Covey, A. R. Lewis, Y. Al-Sayyad, and L. M. Anderson, Mon. Not. R. Astron. Soc. 440, 3430 (2014).
- 8. K. M. Flaherty, J. L. Pipher, S. T. Megeath, E. M. Winston, R. A. Gutermuth, J. Muzerolle, L. E. Allen, and G. G. Fazio, Astrophys. J. 663, 1069 (2007).
- 9. T. K. Fritz, S. Gillessen, K. Dodds-Eden, D. Lutz, R. Genzel, W. Raab, T. Ott, O. Pfuhl, F. Eisenhauer, and F. Yusef-Zadeh, Astrophys. J. 737, 73 (2011).
- 10. J. Gao, B.W. Jiang, A. Li, Astrophys. J. 707, 89 (2009).
- 11. J. Gao, B.W. Jiang, A. Li, et al., Astrophys. J. 776, 7 (2013).
- 12. G.A. Gontcharov, Astron. Lett. 34, 785 (2008).
- 13. G.A. Gontcharov, Astron. Lett. 35, 780 (2009)].
- 14. G.A. Gontcharov, Astron. Lett. 37, 707 (2011).
- 15. G.A. Gontcharov, Astron. Lett. 38, 12 (2012a).
- 16. G.A. Gontcharov, Astron. Lett. 38, 87 (2012b).
- 17. G.A. Gontcharov, Astron. Lett. 39, 83 (2013a).
- 18. G.A. Gontcharov, Astron. Lett. 39, 550 (2013b).
- 19. G. A. Gontcharov, A. T. Bajkova, P. N. Fedorov, and V. S. Akhmetov,Mon.Not. R. Astron. Soc. 413, 1581 (2011).
- 20. E. Høg, C. Fabricius, V. V. Makarov, S. Urban, T. Corbin, G. Wycoff, U. Bastian, P. Schwekendiek, and A.Wicenec,, Astron. Astrophys. 355, L27 (2000).
- 21. S. Hutton, I. Ferreras, and V. Yershov, Mon. Not. R. Astron. Soc. 452, 1412 (2015).
- 22. R. Indebetouw, J. S. Mathis, B. L. Babler, M. R. Meade, C.Watson, B. A.Whitney, M. J.Wolff, M. G.Wolfire, et al., Astrophys. J. 619, 931 (2005).
- 23. IRAS working group), IRAS Catalog of Point Sources, Version 2.0 (IRAS, 1988), http://cdsarc.u-strasbg.fr/viz-bin/Cat?II/125.
- 24. B. W. Jiang, J. Gao, A. Omont, F. Schuller, and G. Simon, Astron. Astrophys. 446, 551 (2006).
- 25. D. Katz, C. Soubiran, R. Cayrel, B. Barbuy, E. Friel, O. Bienayme, and M.-N. Perrin, Astron. Astrophys. 525, A90 (2011).
- 26. G. Kordopatis, A. Recio-Blanco, P. de Laverny, G. Gilmore, V. Hill, R. F. G. Wyse, A. Helmi, A. Bijaoui, M. Zoccali, and O. Bienayme, Astron. Astrophys. 535, A107 (2011).
- 27. H. Krüger, P. Strub, E. Grün, and V.J. Sterken, Astrophys. J. 812, 139 (2015).
- 28. K.A. Larson, D.C.B. Whittet, Astrophys. J. 623, 897 (2005).
- 29. A. Li, J. Phys. Conf. Ser. 6, 229 (2005).
- 30. D. Lutz, The Universe as Seen by ISO, Eds. P. Cox, M.F. Kessler, ESA SP-427 (ESA, 1999), p. 623.
- 31. S.R. Majewski, G. Zasowski and D.L. Nidever, Astrophys. J. 739, 25 (2011).
- 32. S. Nishiyama, M. Tamura, H. Hatano, D. Kato, T. Tanabe, K. Sugitani, and T. Nagata, Astrophys. J. 696, 1407 (2009).
- 33. X. Peng, C. Du and Z. Wu, Mon. Not. R. Astron. Soc. 422, 2756 (2012).
- 34. H. Posbic, D. Katz, M. Haywood, P. Bonifacio, E. Caffau, A. Gomez, L. Sbordone, F. Arenou, and F. Royer, in Proceedings of the Annual Meeting of the French Society of Astronomy and Astrophysics SF2A-2012, Nice, France, June 5 8, 2012, Ed. by S. Boissier et al. (2012), p. 103.
- 35. Schlesinger, J. A. Johnson, C. M. Rockosi, Y. S. Lee, T. C. Beers, P. Harding, C. Allende Prieto, J.C. Bird, et al., Astrophys. J. 791, 112 (2014).
- 36. Schultheis, G. Kordopatis, A. Recio-Blanco, P. de Laverny, V. Hill, G. Gilmore, E. J. Alfaro, M. T. Costado, et al., Astron. Astrophys. 577, 77 (2015).
- 37. M. F. Skrutskie, R. M. Cutri, R. Stiening, M. D. Weinberg, S. Schneider, J. M. Carpenter, C. Beichman, R. Capps, et al., Astron. J. 131, 1163 (2006), http://www.ipac.caltech.edu/2mass/releases/allsky/index.html.
- 38. V. L. Straizys, Multicolor Stellar Photometry (Mosklas, Vilnius, 1977; Pachart Publ., Tucson, 1992).
- 39. S. Wang, J. Gao, B. W. Jiang, A. Li, and Y. Chen,, Astrophys. J. 773, 30 (2013).
- 40. S. Wang, A. Li, and B. W. Jiang, Planet. Space Sci. 100, 32 (2014).
- 41. S. Wang, A. Li, and B. W. Jiang, Astrophys. J. 811, 38 (2015).
- 42. J.C. Weingartner and B.T. Draine, Astrophys. J. 548, 296 (2001).
- 43. E. L. Wright, P. R. M. Eisenhardt, A. K. Mainzer, M. E. Ressler, R. M. Cutri, T. Jarrett, J. D. Kirkpatrick, D. Padgett, et al.,, Astron. J. 140, 1868 (2010), http://irsa.ipac.caltech.edu/Missions/wise.html
- 44. Zasowski, S. R. Majewski, R. Indebetouw, M. R. Meade, D. L. Nidever, R. J. Patterson, B. Babler, M. F. Skrutskie, et al.,, Astrophys. J. 707, 510 (2009).
- 45. V. Zubko, E. Dwek, R.G. Arendt, Astrophys. J. Suppl. Ser. 152, 211 (2004).