New debris disks in nearby young moving groups
Abstract
A significant fraction of nearby young moving group members harbor circumstellar debris dust disks. Due to their proximity and youth, these disks are attractive targets for studying the early evolution of debris dust and planetesimal belts. Here we present 70 and 160µm observations of 31 systems in the Pic moving group, and in the Tucana-Horologium, Columba, Carina and Argus associations, using the Herschel Space Observatory. None of these stars were observed at far-infrared wavelengths before. Our Herschel measurements were complemented by photometry from the WISE satellite for the whole sample, and by submillimeter/millimeter continuum data for one source, HD 48370. We identified six stars with infrared excess, four of them are new discoveries. By combining our new findings with results from the literature, we examined the incidence and general characteristics of debris disks around Sun-like members of the selected groups. With their dust temperatures of 45 K the newly identified disks around HD 38397, HD 48370, HD 160305, and BD-20 951 represent the coldest population within this sample. For HD 38397 and HD 48370, the emission is resolved in the 70µm PACS images, the estimated radius of these disks is 90 au. Together with the well-known disk around HD 61005, these three systems represent the highest mass end of the known debris disk population around young G-type members of the selected groups. In terms of dust content, they resemble the hypothesized debris disk of the ancient Solar System.
1 Introduction
The extensive surveys of the last decades have achieved a fundamental progress in investigating the young stellar population in the immediate (100 pc) vicinity of the Sun. A significant fraction of the identified young stars belong to gravitationally unbound stellar associations, or young moving groups, whose members share common space motions and are believed to have a common origin. With their ages ranging from eight to a few hundred Myr, these groups are ideal targets to study the early evolution of stars and their circumstellar environment. The comparison of a sequence of well-dated groups can outline general evolutionary trends, while the dispersion of properties within coeval groups could reveal additional secondary effects. The covered time period also overlaps with the epochs of several key events in the early Solar System history (Apai, 2009), and is thought to be an active phase in the evolution of planetary systems in general.
A noteworthy fraction of moving group members exhibits excess emission at infrared (IR) wavelengths (e.g. Zuckerman et al., 2011). Though a few long lived primordial disks may be present around the youngest stars of these associations (e.g. Calvet et al., 2002; Kastner et al., 2008), in most cases the observed excess can be attributed to thermal emission of tenuous circumstellar debris disks that are composed of subplanetary sized bodies down to micron-sized dust grains. In such debris disks the small dust particles are effectively removed from the system in a short timescale due to their interaction with the stellar radiation and/or wind. However, erosion of larger planetesimals – particularly through their mutual collisions – provide a continuous replenishment of grains (Wyatt, 2008).
While the population of planetesimals is invisible for us, their presence, location and some characteristics can be deduced from observations of the dust grains as tracers. Due to this close relationship, the study of debris dust evolution can give insight into the evolution of planetesimal belts as well. Moreover, in such young systems the dust production is not limited to planetesimal belts. The final accumulation of terrestrial planets – thought to occur via giant embryo-embryo collisions – can also release a large amount of smaller fragments in the inner regions (Jackson & Wyatt, 2012; Genda et al., 2015). In our Solar System these processes lasted 100 Myr (Jacobson et al., 2014). Based on geochemical arguments the formation of Earth was completed in 50-100 Myr (König et al., 2011). Giant planets start their lives warm and then cool off on a timescale of a few ten million years, making their detection possible via direct imaging at near-infrared wavelengths around members of young moving groups. Detection of such planet(s) and a debris disk in the same system provides an excellent opportunity to study the possible planet-disk interactions as already demonstrated, e.g., in the Pic system (e.g. Beust & Morbidelli, 1996; Mouillet et al., 1997; Apai et al., 2015).
The ultimate aim of our program is to study the early evolution of planetesimal belts via observing and comparing debris dust disks in young moving groups at different ages. This requires, however, a census of debris disks in these groups. Thus, as the first step of the present work, we check the inventory of disks in selected moving groups and complete their disk detection lists. We searched for new debris disks with the Herschel Space Observatory (Pilbratt et al., 2010) in the following five nearby young moving groups: the Pictoris Moving Group (BPMG, 20 Myr, Barrado y Navascués et al., 1999; Zuckerman et al., 2001; Binks & Jeffries, 2014; Mamajek & Bell, 2014), the Tucana-Horologium (THA, 20–50 Myr, Zuckerman & Webb, 2000; Torres et al., 2000; Torres et al., 2008; Kraus et al., 2014; Bell et al., 2015), the Columba and the Carina associations (COL and CAR, 20–50 Myr, Torres et al., 2008; Gagné et al., 2014; Bell et al., 2015), and the recently identified Argus association (ARG, 30–50 Myr, Torres et al., 2003; Torres et al., 2008; Gagné et al., 2014). Ages of these groups range between 20 and 50 Myr, thus they constitute an ideal time sequence for following the evolution of planetesimal belts after the dispersal of gas rich protoplanetary disks.
Due to its limited sensitivity, the Infrared Astronomical Satellite IRAS could detect only the brightest circumstellar disks in these groups. Using spectroscopic and photometric data obtained with the Spitzer Space Telescope (Werner et al., 2004) many additional members were studied at mid- and far-infrared wavelengths. Rebull et al. (2008) present infrared photometry at 24 and 70µm obtained with the Spitzer MIPS detector for 30 BPMG and 9 THA members. Using the same instrument and bands, in an extended photometric survey Zuckerman et al. (2011) observed 53, 8, and 7 members of the THA, COL, and ARG groups, respectively. Both Rebull et al. (2008) and Zuckerman et al. (2011) concluded that the typical disk incidence in these groups is higher than among older field stars. With the advent of the Herschel Space Observatory (Pilbratt et al., 2010) it became possible to measure the far-IR emission of debris disks with an unprecedented sensitivity and spatial resolution, enabling the study of cold dust in the outer disk regions. The spectroscopic capability of observing lines such as O I and C II offered an opportunity to search for the possible gas content of the disks. Using the photometer unit of the Photodetector Array Camera and Spectrograph (PACS, Poglitsch et al., 2010), Donaldson et al. (2012) studied 17 THA members, while Riviere-Marichalar et al. (2014) observed 19 systems belonging to the BPMG. These observations resulted in identifying new debris systems, as well as a better characterization of some previously known ones, spatially resolved images of some disks (e.g. 49 Ceti, Roberge et al., 2013), and gas detection in disks around two BPMG members (Riviere-Marichalar et al., 2012, 2014).
However, the member lists of BPMG and THA were incomplete at the time of the Spitzer cryogenic mission, while the discoveries of the COL, CAR, and ARG groups happened in the last period of the mission excluding their systematic studies with Spitzer. Observations with Herschel (Donaldson et al., 2012; Riviere-Marichalar et al., 2014) were mainly focused on those well-known members of the groups that were already observed by Spitzer. Thus for most of the recently identified members of the specific groups only mid-IR data are available from the WISE all-sky survey. In our program we searched for far-IR excess over the stellar photosphere using Herschel for those overlooked members of the above mentioned five groups that have never been observed at wavelengths longer than 25µm. In one case we also performed IRAM observations, in order to further characterize the newly discovered disk.
2 Observations and data reduction
2.1 Sample selection
To assemble our sample we compiled member lists of the five selected young moving groups based on the literature at that time (Torres et al., 2008; da Silva et al., 2009; Zuckerman et al., 2011), and on our previous surveys (Kiss et al., 2011; Moór et al., 2013). From these lists we selected those B9-K7 type stars, that have never been observed by Spitzer or Herschel at far-IR wavelengths. We focused predominantly on stars located within 80 pc. Out of the 42 selected stellar systems, 26 could be observed before the end of the Herschel mission. Because two targets were wide separation multiple systems, altogether we obtained Herschel observations for 28 stars. For three additional young moving group members, far-IR photometric data were taken from the Herschel Science Archive. Thus altogether 31 objects were studied in this project. The observed sample is dominated by G- and K-type stars, allowing us also to search for potential analogs of the young Solar System’s debris disk. Table 1 lists the main properties of the selected targets.
2.2 Observations with the Herschel Space Observatory
The photometer unit of the Photodetector Array Camera and Spectrograph (PACS, Poglitsch et al., 2010) was used to obtain far-IR measurements for the targets. PACS was a dual band imaging camera that provided simultaneous observations in two bands at 70/160 µm or at 100/160 µm. Imaging was performed by two bolometer detector arrays with 6432 pixels (blue array) in the 70 and 100 µm bands and with 3216 pixels (red array) in the 160 µm band. The observations were carried out at 70/160 µm in mini scan-map mode, which is designed for photometry of individual point sources. The maps were executed with a scan speed of 20″ s-1, using 10 scan-legs of 3′ length separated by 4″. All targets were observed at two scan angles of 70 and 110. Table 2 presents the log of the Herschel observations.
Data processing of PACS maps.
The data reduction was carried out in the Herschel Interactive Processing Environment (HIPE, Ott, 2010) version 13 using PACS calibration tree No. 65 and the standard HIPE script optimized for mini scan-map observations. We used only those data frames from the timeline where the actual scan speed of the spacecraft was between 15 and 25″ s-1. The low-frequency () noise of the detector was eliminated by applying a highpass filtering with filter width parameters of 20 and 35 (corresponding to 82″, and 142″), for the 70 and 160µm data, respectively. In the determination of the highpass filter widths we basically followed the outline of Balog et al. (2014), except that at 70µm we increased the filter width parameter from 15 (Balog et al., 2014, corresponding to point sources) to 20 thereby considering the possible presence of sources with up to 5″ spatial extent in the sample. To avoid flux loss caused by this process, the immediate vicinity of our targets was excluded from the filtering using a 25″ radius circular mask placed at the sources’ position. Glitches were removed using the second-level deglitching algorithm. Finally we used the photProject task to combine all data frames belonging to a source into maps with pixel sizes of 11 and 21 at 70 and 160 µm, respectively.
The red PACS detector was assembled from 2 bolometer matrices with 1616 pixels each. After operational day 1375 (2013 February 16) one of the two red channel subarrays was affected by a serious anomaly and therefore became unusable. The failure of this matrix caused a small reduction in spatial coverage of 160 µm maps compared to shorter wavelength maps made with the blue detector array, and accompanied a loss of 30% in sensitivity in this channel (see Herschel Observers’ Manual version 5.0.3111http://herschel.esac.esa.int/Docs/Herschel/html/Observatory.html). We note that the other 1616 pixel subarray remained stable. By studying dedicated observations of PACS internal calibration sources throughout the mission it was demonstrated that the measured signal level obtained with this part of the detector was not changed after this event (Moór et al., 2014). Apart from the cases of HD 38397, HD 160305, and CD-54 7336, all of our 160 µm observations are affected by this issue.
PACS photometry.
At 70 µm nine of our 31 targets were detected at level. From these nine sources four (HD 160305, HD 38397, HD 48370, and BD-20 951) were detected in the 160 µm band as well. The positional offsets between the centroids of the identified point sources and their 2MASS positions (corrected for the proper motion between the epochs of the two observations) are less than 15 for all of our sources, thus the offsets are within the 2 uncertainty of Herschel’s nominal pointing accuracy (10, Sánchez-Portal et al., 2014).
We used aperture photometry for all of our targets. For the detected sources the aperture was placed around the centroid of the object, while in the undetected cases the sources’ proper motion-corrected 2MASS positions were used as the target coordinates. Generally the aperture radii were set to 8″ and 12″ at 70 and 160 µm, respectively, while the sky background was estimated in an annulus between 40″ and 50″. In three special cases we deviated from these standard aperture sizes. To avoid contamination, for HD 35996 and HIP 25434, which constitute a binary with a separation of 12″, we used smaller apertures with radii of 6″ and 8″ in the 70 and 160 µm bands, respectively. In the case of HD 38397 and HD 48370, that turned out to be spatially extended (Sect. 3.3), we used 15″ radius apertures in both bands. In order to account for the flux outside the aperture we applied aperture correction, by using correction factors taken from the appropriate calibration files. To compute the sky noise, we distributed sixteen apertures with radii identical to the source aperture evenly along the background annulus and performed aperture photometry without background subtraction in each of them, determining the noise as the standard deviation of these background flux values. The final photometric uncertainty was calculated as a quadratic sum of the sky noise and the absolute calibrational uncertainty of the PACS detector (7%, Balog et al., 2014). The resulting 70 and 160 µm photometry is presented in Table 3.
Serendipitious SPIRE/PACS parallel maps for HD 48370.
One source, HD 48370, that turned out to exhibit the brightest infrared excess in our sample (Sect. 3.3), was serendipitously measured in four observations (OBSIDs: 1342250790, 1342250791, 1342253429, 1342253430) in the SPIRE/PACS parallel mode (Herschel Observers’ Manual version 5.0.3). In this mode, the SPIRE and PACS cameras were operated in photometry mode simultaneously generally performing large-area mapping observations with a scan speed of 60″/s. In all four cases the PACS camera was used with the 70 µm filter, thereby these observations provide data at 70, 160, 250, 350, and 500 µm.
The processing of the PACS 70 and 160 µm data was done with HIPE utilizing the same reduction steps as described above, except that because of the three times higher scan map speed, the data frames were limited to those where the actual scan speed was between 48 and 72″ s-1, and we set smaller highpass filter width parameters of 7 and 12, at 70 and 160 µm, respectively. As a final step, a small region of 4′4′ centered on HD 48370 was extracted from all four maps and combined in both bands. For the photometry we used the same aperture setup as in the case of the mini-map observation of the source (see above). The resulting fluxes are listed in Table 3. In both bands these fluxes are in agreement with the ones obtained from the mini-map observations above (see Table 3), within formal uncertainties. Thus for further analysis we combined the fluxes in each band using their weighted average (Table 4).
Apart from one observation (1342253430), where the source was located very close to the edge of the map, HD 48370 was detected in all bands in the other three SPIRE data sets (OBSIDs: 1342253429, 1342250790, 1342250791). We applied the Timeline Fitter task in HIPE to derive SPIRE photometry. This task fits two-dimensional elliptical or circular Gaussian functions to the baseline-subtracted timeline data at the coordinates of the source (for details, see Bendo et al., 2013). We used circular Gaussians and the default settings for both the search radii (22, 30, and 42″ in 250, 350, and 500 µm bands) and the background annulus (between 300 and 350″ centred on the source). As a final step, the individual flux density values derived in the three maps in each band were averaged, weighted by their uncertainties. The final uncertainties were derived as the quadratic sum of the measurement errors and the 5.5% overall calibration uncertainty of the SPIRE photometer (Bendo et al., 2013). This method yielded flux densities of 148.512.1 mJy, 103.411.6 mJy, and 54.510.5 mJy at 250, 350, and 500 µm, respectively (see also Table 4).
2.3 IRAM/NIKA observation
After discovering it with Herschel, we initiated millimeter wavelength observations of HD 48370 using the New IRAM KID Array (NIKA) dual-band imaging camera mounted on the IRAM 30-m telescope at Pico Veleta. NIKA is equipped with two novel type Kinetic Inductance Detector arrays of 132 and 224 detectors allowing simultaneous observations in two bands at 1.25 mm and 2.14 mm, respectively, with a common field-of-view of 19 in diameter (Catalano et al., 2014). The observation was performed on 2014 February 25 in the framework of the first NIKA observing pool session. Pointing measurements and corrections were performed every 90 minutes, while bright sources were observed in every two to three hours for checking the focus of the telescope. Uranus was used for absolute flux calibration. In order to map the vicinity of our target, we used the Compact Source observing template and executed 12 consecutive 1515 Lissajous maps centered on the source. The total integration time was 1 hr. During the observation the mean opacities were 0.174 and 0.139 at 1.25 and 2.14 mm, respectively. For processing our observations we used the NIKA data analysis pipeline (version 1). The details of the main data reduction steps performed in the pipeline are described in Catalano et al. (2014). The calibration was done assuming a Gaussian main beam of 125 and 185 (FWHM) at 1.25 and 2.14 mm, respectively. Besides flux calibrated maps for the 12 individual observations, the pipeline also produced a final combined map in each band. HD 48370 was clearly detected in both bands. Its shape is consistent with a point-like source. The pipeline provided photometry for the central source in each individual maps. The final flux densities and their uncertainties at both wavelengths were computed as a weighted average of the 12 individual flux estimates. According to Catalano et al. (2014) the overall calibrational uncertainty is 15% in the shorter and 10% in the longer wavelength band. Considering these uncertainties by adding them quadratically to the measurement errors, our observation yielded flux densities of 7.31.5 mJy and 2.00.3 mJy at 1.25 and 2.14 mm, respectively (Table 4).
3 Results
3.1 Stellar properties
For characterization of the infrared excess related to circumstellar dust, one has to compare the predicted photospheric flux densities of the star with the observed ones. We modeled the stellar photospheres by fitting an ATLAS9 atmosphere model (Castelli & Kurucz, 2004) to the optical and infrared photometric data of the given target. Optical photometry were taken from the Hipparcos and TYCHO2 catalogs (Perryman et al., 1997; Høg et al., 2000), and from the SACY survey (Search for Associations Containing Young stars, Torres et al., 2006). Zero-point flux densities for optical bands were taken from the SVO Filter Profile Service222http://svo2.cab.inta-csic.es/svo/theory/fps3/. At near-IR wavelengths we used the data measured in the Two Micron All-Sky Survey (2MASS; Skrutskie et al., 2006). All of our targets have counterparts in the Wide-field Infrared Survey Explorer (WISE, Wright et al., 2010) catalog that provides mid-IR photometry in four bands, and centred at 3.4, 4.6, 12, and 22µm, respectively. In case the confusion flag indicates an unconfused measurement in the band (i.e. cc_flg[] = 0), these data were also added to the optical and near-IR photometry. For 2MASS and WISE data the relevant zero-point values were taken from Cohen et al. (2003) and Wright et al. (2010), respectively. We adopted solar metallicity for all of our sources and, except for HD 32309, where we assumed a of 4.0 (cgs units), the surface gravity was fixed to 4.5. Apart from CD-52 1363 and CD-42 2906, the selected stars are located within 80 pc, in the cavity known as the Local Bubble, where the mean extinction is expected to be low (e.g., Lallement et al., 2003). For the two more distant objects we collected all those stars in their 3° vicinity that are included in the Hipparcos catalog and having Strömgren color indices and H index in the photometric catalog of Hauck & Mermilliod (1998). By deriving color excesses (as ) from the Strömgren photometry using the appropriate calibration processes (Crawford, 1975, 1979; Olsen, 1984) we found that the reddening of stars located within 150 pc are 0.015 mag. Considering these results, the visual extinction was neglected for all targets in the fitting process. A grid-based approach was used in the fitting. The effective temperature () values of the best fitting models as well as the derived stellar luminosities are listed in Table 1.
3.2 Stars with infrared excess
In order to identify systems exhibiting excess in any of the PACS bands, first we computed the predicted photospheric flux densities of the sample stars using their best-fit Kurucz models (Sect. 3.1). The significance level of excess in a specific photometric band was calculated as:
| (1) |
where is the measured flux density either at 70 or 160 µm, is the predicted stellar flux, while is the quadratic sum of the final photometric uncertainty and the uncertainty of the predicted flux density in the relevant band. The accuracy of the predicted photospheric fluxes is estimated to be around 5%. It is important to note that in all cases the dominant source of excess error is the final photometric uncertainty. The predicted photospheric flux densities (, ) as well as the significances are listed in Table 3. Targets with in any of the PACS bands were considered as a star with excess emission. Applying this criterion, we identified five stars, HD 160305, HD 38397, HD 35996, HD 48370, and BD-20 951 that exhibit excess emission at 70 µm. Apart from HD 35996, all of these sources show excess at 160µm as well. HD 168210 has a of 3.7, however its photometry at 160µm is strongly contaminated by a bright nebulosity coincident with its position, thus the observed excess may not come from a circumstellar disk but rather have interstellar origin.
WISE photometry
is available for all of our targets, enabling us to search for excess at
12 and 22µm ( and bands).
The WISE magnitudes and uncertainties
were converted to flux densities using the formulae from
Wright et al. (2010). In the calculation of the final observational uncertainties
the absolute calibrational
errors333http://wise2.ipac.caltech.edu/docs/release/allsky/expsup/
sec4_4h.html#CalibrationU
were also taken into account by quadratically adding to
the listed measurement errors.
Then the significance level of the infrared excess was computed in the same way as
for the PACS photometry.
None of our targets have excess at 12µm.
Four stars, HD 38397, HD 35996, HD 48370, and CD-54 7336
exhibit excess in the band with significances of .
Among them HD 38397, HD 35996, and HD 48370 show excess in PACS bands as well, while
CD-54 7336 has an excess only in the band.
Apart from HD 35996, all of these sources have a good quality photometry in all WISE bands.
However, HD 35996 is flagged as an extended source,
because its measured source profiles in the and bands deviate significantly
from the WISE point spread function (i.e. the reduced
of the and profile-fit photometry measurements are 3).
According to the catalog’s contamination and confusion flag
the source photometry is contaminated by the scattered light halo surrounding a
nearby bright source in these bands. Indeed HIP 25434, the companion of HD 35996, is located
at a separation of 12″. The WISE catalog provides separated photometry for the
two components in band. No quality flags are assigned to these sources in this band and the
measured flux of HIP 25434 corresponds well to its predicted photospheric flux
at the specific wavelength, suggesting that the observed excess at HD 35996 might not be
significantly contaminated by the companion.
The WISE excess of HD 38397 has already been reported by several authors
(Wu et al., 2013; Patel et al., 2014; Vican & Schneider, 2014). Interestingly, according to Patel et al. (2014),
HD 160305 also exhibit excess at 22µm, although for this star we derived an excess significance
of .
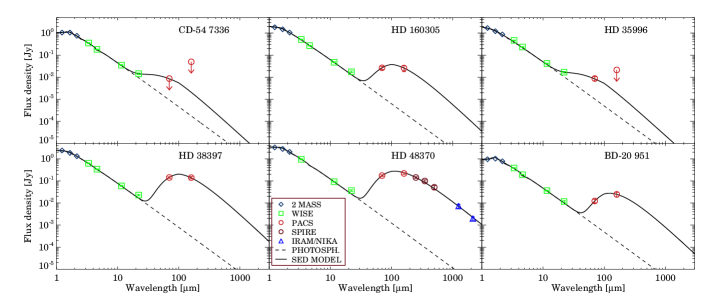
Altogether, we identified six stars with infrared excess, from which four, CD-54 7336, BD-20 951, HD 35996, and HD 48370 are new discoveries. Their spectral energy distributions (SEDs), using 2MASS, WISE, and Herschel (and NIKA for HD 48370) photometry, are shown in Figure 1.
3.3 Disk properties
Simple blackbody models.
The infrared excess emission of main-sequence stars is generally linked to the thermal emission of an optically thin second-generation circumstellar dust disk heated by the central star. In most debris systems the observed excess can be well described by a single-temperature (modified) blackbody or a combination of two different temperature blackbody components (Kennedy & Wyatt, 2014; Chen et al., 2014). We adopted a single temperature modified blackbody model to estimate the characteristic dust temperature () and the fractional luminosity () of the six systems with IR excess. In the case of CD-54 7336, where the excess was measured only in one band we fitted the 3- upper limit at 70µm to constrain the dust temperature. The modified blackbody is needed to account for another general characteristic of debris disk SEDs: the steep fall of the excess spectrum at wavelengths significantly longer than the typical grain size because of the inefficient absorption and emission. In our model the emissivity was set to 1 at wavelengths, while at longer wavelengths it varied as . Following Williams & Andrews (2006) the parameter was fixed to 100µm. Apart from HD 48370, whose millimeter SED is well characterized, for the other targets was fixed to 0.65 (Gáspár et al., 2012). We applied a Levenberg-Marquardt algorithm (Markwardt, 2009) to identify the best-fitting model to the measured data. Following Moór et al. (2006), simultaneously with the fitting process we used an iterative method to compute and apply color corrections for the photometric data. Table 5 shows the fundamental disk parameters and their uncertainties derived from the modeling. The fitted models are displayed in Fig. 1.
Assuming that the blackbody components correspond to narrow dust belts that contain large grains emitting like blackbodies, based on the derived temperatures and the stellar luminosities (Table 1) the rings’ radii can be calculated as
| (2) |
In reality, smaller grains – that are ineffective emitters and thereby hotter than large blackbody particles at the same stellocentric distance – may also be present in the disk, thus the derived values (Table 5) should be considered as minimum possible radii. Indeed, the disk radii inferred from spatially resolved far-IR images of debris disks were found to be 2–4 times larger than blackbody disk radii derived from the characteristic dust temperatures (e.g. Booth et al., 2013; Morales et al., 2013; Pawellek et al., 2014).
Analyzing the SEDs of debris systems where good quality mid-IR spectra are also available, Ballering et al. (2013) and Chen et al. (2014) found that disks with two temperature components are common. Most of these two-temperature disks may be linked to spatially distinct dust belts (Kennedy & Wyatt, 2014). In the case of HD 38397 and HD 48370 (and to a lesser extent of HD 160305 as well) the measured 22µm flux density deviates significantly from the fitted single temperature model, hinting at a second temperature component. However, without additional good quality mid-IR observations, this possible warmer component cannot be further characterized. The SED of HD 48370, with its better wavelength coverage, allowed us to scrutinize how an additional component would modify the parameters of the cold one, by utilizing a two-component model where the warm component is represented by a simple blackbody. By setting different temperatures for the warm blackbody and repeating the fitting procedure we found that if the warmer component has a temperature of 90 K then the temperature and the -parameter of the cold dust do not vary significantly compared to the single temperature model. For the fractional luminosity, however, we obtained values ranging between 6.510-4 and 7.310-4, which are higher than the one, , derived in the simpler model.
For those systems where no infrared excess has been identified upper limits were computed for the fractional luminosities. Here we assumed a disk whose emission can be described by a modified blackbody (with and µm) that peaks at 70µm with an amplitude corresponding to 3. The obtained upper limits are listed in Table 3.
Analysis of millimeter data at HD 48370.
Thanks to the SPIRE and IRAM/NIKA observations the SED of HD 48370 is well characterized in the millimeter regime providing an opportunity to constrain the size distribution of the emitting grains and estimate the dust mass. For optically thin dust emission the measured flux density can be described as where is the dust mass, is the Planck function at the characteristic dust temperature, is the dust opacity coefficient, while is the distance of the source. At long wavelengths the Planck function is proportional to , while can be given as . Considering these relationships and that , it means that . In debris disks the size distribution of grains is generally described as , where is the grain size, is the number of grains in a given size bin, while is the power-law index of differential size distribution of the dust grains. According to Draine (2006), if the dust size distribution follows a power law between minimum and maximum grain sizes that are significantly smaller and larger than the observational wavelengths, respectively, and , then the dust opacity power law index is related to as , where is the dust opacity spectral index in the small particle limit. Thus can be estimated from the (sub)millimeter data using the following formula:
| (3) |
for we adopted a value of 1.80.2 (taken from Ricci et al., 2012). Based on our color-corrected millimeter flux densities obtained between 0.35 and 2.14 mm, the parameter is 2.150.11, while is 1.71 in the same wavelength range adopting a temperature of 41 K (corresponding to the characteristic temperature of the disk). Using these values Eq. 3 gives =3.250.07.
Millimeter observations also enable us to estimate the dust mass in the disk. Assuming optically thin emission characterized by a single temperature the dust mass was computed as: . By adopting 2 cm2 g-1 for at GHz (e.g. Nilsson et al., 2010) and using observations between 0.35 and 2.14 mm we derived four individual estimates and then the final dust mass was computed as a weighted average of them, yielding M⊕.
Extended emission around HD 38397 and HD 48370.
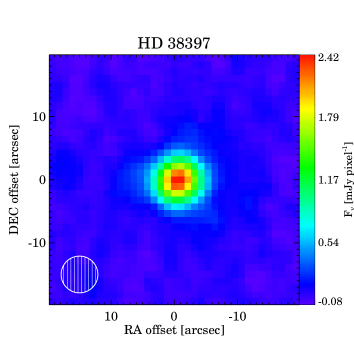
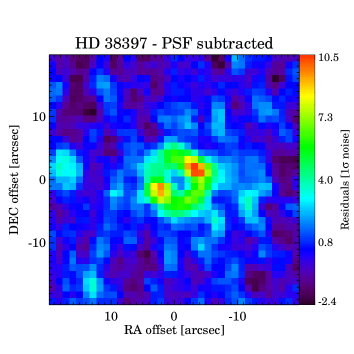
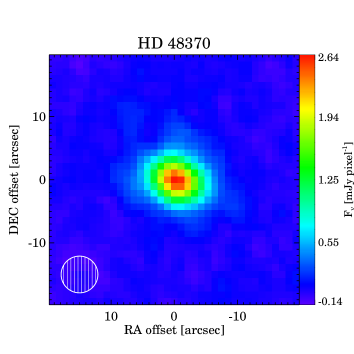
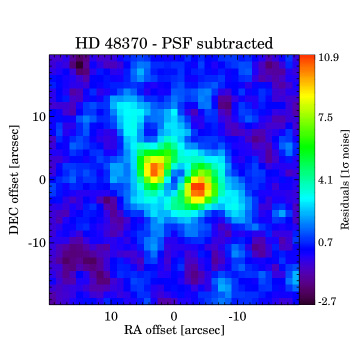
For systems with excess in the PACS bands we scrutinized whether the observed sources are point-like or spatially extended by comparing the measured source profiles with the appropriate point-spread functions (PSFs). To compile reference PSFs we used 70 and 160 µm mini-scan map observations of four diskless stars ( Boo, Tau, Cet, and And) which served as photometric standards in the calibration of PACS (Balog et al., 2014). These data were processed in the same way as described in Sect. 2.2 and the obtained PSFs were rotated to match the telescope’s roll angle at the observation of the given target. Then we fitted 2D Gaussians to these PSFs and the most extended one (with the largest FWHMs) were subtracted – after a scaling to the peak – from the measured profiles of our targets. At 160µm all of our targets were found to be consistent with a point-like source. However, as Figure 2 (right) demonstrates, the PSF subtraction leaves significant residual emission at 70µm around HD 38397 and HD 48370, indicating that their disks are resolved at this wavelength.
Assuming that the bulk of the observed 70µm emission originates from a narrow cold dust ring, the PACS images of HD 38397 and HD 48370 were fitted by a simple, geometrical disk model. The model disks have three free parameters, the average radius (), the position angle () and the inclination (). Following Booth et al. (2013) and Moór et al. (2015) the width of the disk was fixed to 0.1 and the surface brightness was assumed to be homogeneous. The contribution of the stellar photosphere and the possible warm component was neglected in the model. The compiled disk images were then convolved with the appropriately rotated PSF (see above). We used a grid based approach in the course of fitting, and a Bayesian analysis was performed to select the best model and estimate the uncertainties of the derived disk parameters (for more details, see Moór et al., 2015). For HD 38397 our best solution has au , , and (where the face-on orientation corresponds to ). In the case of HD 48370 the following disk parameters were obtained: au, , and °. The ratios of the disk radii inferred from the 70µm images to the blackbody disk radii (Table 5) are 2.0 and 2.3 for HD 38397 and HD 48370, respectively. Several authors (Booth et al., 2013; Pawellek et al., 2014) noticed that there is a trend, where this ratio () is increasing with the decreasing stellar luminosity, implying that grains around more luminous stars are generally larger. By placing our objects in fig. 4b of Pawellek et al. (2014) – that shows values as a function of stellar luminosity for 34 debris disks – we found that they are broadly consistent with the currently outlined trend.
By relaxing our assumption of narrow rings we found that the measured profiles can equally be fitted with broader disk models that have smaller inner and larger outer radii than rings with 0.1 width. However, position angles, inclinations, and even average disk radii inferred from these models were in reasonable accordance with those derived in our narrow disk scenario.
3.4 Contamination by background galaxies or diffuse nebulosity?
So far we assumed that the observed excesses are related to circumstellar material. However at such long wavelengths the probability of contamination by background galaxies is not negligible, especially in the case of faint sources (e.g., Gáspár & Rieke, 2014). The brightness and spatial extent of HD 38937 and HD 48370 provide strong evidences for the circumstellar nature of the excess emission. In order to estimate the probability of galaxy confusion for the other disk candidates, we followed the outline described in Sibthorpe et al. (2013) who used the results of Herschel-based deep extragalactic surveys to quantify the relevance of this contamination issue. In our calculation we used the confusion beam size definition proposed by Condon (1974). According to this work the effective beam solid angle of an elliptical Gaussian beam with half power axes of and can be computed as: where represents the slope of the differential distribution of sources. For a scan speed of 20″ s-1, and at 70µm (PACS’s Observers Manual444http://herschel.esac.esa.int/Docs/PACS/pdf/pacs_om.pdf), while, based on Berta et al. (2011), the parameter is 2 in the relevant flux range. Thus the effective beam solid angle and radius is 35.6 arcsec2 and , respectively. Considering the average 3 uncertainty of the 70µm photometry (6.9 mJy) as our survey limiting flux density, the probability of confusion by one or more background galaxies within a radius of a target is found to be 0.27%. Since our sample includes 31 objects this means that the probability that one of them is being contaminated is 8%, while the chance that two of them are affected by source confusion is only 0.34%.
The far-IR SED of those faint galaxies that could be responsible for such contamination can typically be fitted by a modified blackbody with temperatures ranging between 20 and 29 K (Gáspár & Rieke, 2014). The characteristic temperature of the excess at HD 35996 is significantly warmer (Table 5) what is typical for faint galaxies, implying that the chance of contamination is even lower. However, with its temperature of 335 K, the disk candidate at BD-20 951 would belong to the coldest population of known debris systems. Among our disk candidates the excess SED of BD-20 951 is the most compatible with that of galaxies.
For CD-54 7336 the infrared excess was detected only in the band. The PACS 160µm image of this source shows extended bright nebulosity around the star, this diffuse emission can be recognized at 70µm as well. Though its band photometry is free of quality issues, considering the relatively coarse spatial resolution (12″) we cannot completely exclude the possibility that this nebulous environment also contribute to the measured flux density at 22µm.
4 Discussion
Our study of 31 young moving group members resulted in the identification of 6 systems with infrared excess. Though we cannot completely exclude that some of them are due to source confusion or extended interstellar emission, in the following we suppose that the observed excesses are linked to circumstellar debris dust grains. Four among these six systems are known to be single stars, HD 35996 resides in wide binary system with a minimum separation of 840 au. The latter object as well as BD-20 951 were found to be spectroscopic binary (Table 1). Considering their derived blackbody dust radii of 6 and 55 au (Table 5) these systems may harbour circumbinary disks.
4.1 Possible fainter debris disks?
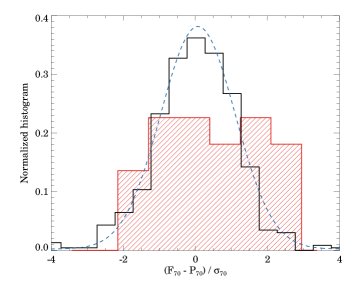
The successfully observed disks have fractional luminosities of 10-4 and thereby belong to the dustiest population among known debris disks. Actually, this fractional luminosity value roughly corresponds to the detection limit for most of our targets, suggesting that several more tenuous disks could have remained undetected. Figure 3 shows the normalized histogram of the significances of the differences between the measured and predicted flux densities at 70µm for all those systems where no excess have been found. For comparison, we made a simulation, in which we performed aperture photometry in 100 randomly selected positions in the vicinity of each target. We used the same aperture size and background value as in the case of the targets, and the random apertures were placed between the target’s aperture and the inner edge of the original background annulus. The normalized histogram of the 70µm significances ( since in these cases ) derived from these simulated photometry are also displayed in Figure 3. A Gaussian fit to this distribution yielded a mean of 0.07 and a dispersion of 1.03 in good agreement with the expected mean of 0.0 with a dispersion of 1.0. The histogram of real measurements (blue, stripped) differs from this distribution by showing an excess at the positive side, suggesting that a fraction of our targets harbor undetected faint disks with lower fractional luminosities. Indeed, some additional excess candidates can already be identified, e.g. for HD 51797, we measured and significances of 2.4 and 2.7, respectively, while for HD 32372 we obtained .
4.2 Debris disks around Sun-like members of young moving groups
By merging our new results with the outcome of previous infrared surveys obtained either by Herschel or Spitzer for members of nearby moving groups, we investigated the general characteristics of debris disks around young Sun-like members. Using member lists from the literature (Torres et al., 2008; Moór et al., 2013; Zuckerman et al., 2011; Malo et al., 2013; Bell et al., 2015) we collected all F8-K7 spectral type stars assigned to the five young groups studied in this paper. We focused on objects located closer than 80 pc, since beyond this distance the available far-IR data sets for the members are quite incomplete. From the 103 F8-K7 type group members 67 have been observed at 70µm (and some of them even at longer wavelengths). One of these stars, V4046 Sgr is a classical T Tauri binary system belonging to the BPMG, that harbors a gas rich circumbinary disk. Therefore this object was discarded from the sample. From the remaining 66 sources, 25 were measured in our current study, for the other 41 sources information on the IR excess – taken from the literature – are summarized in Table 6. From the 66 systems 25 exhibit infrared excess, but only 13 of them at 70µm, the other objects have measurable excess only at shorter wavelengths. It is reasonable to divide this sample into two subsamples, one with late F- and G-type stars (32 targets), and another one with K-type systems (34 objects). From the 32 F,G-type members 18 have excess, 11 among them at 70µm as well. In the subsample of K-type stars the detection rate of debris disks is 7/34, at 70µm two stars exhibit excess emission. These numbers demonstrate that the detection rate in young K-type stars is lower than in earlier spectral classes. As explained above (Sect. 4.1), the obtained 70µm excess rates could be considered as lower limits. The detection rates at 70µm in the five individual groups for the late F- and G-type stars are as follows: 2/5 for the BPMG, 5/15 for the THA, 2/9 for the COL, 0/1 for the CAR, and 2/2 for the ARG. The same rates for the K-type stars: 1/8 in the BPMG, 0/12 in the THA, 0/7 in the COL, 1/3 in the CAR, and 0/4 in the ARG. As a caveat related to these rates we note that although the membership of selected stars is quite probable, for 40% of them no trigonometric parallax information are available, therefore they cannot be considered as secure members. Moreover, especially in the case of the THA, COL, and CAR the assignment of some members among these groups is interchangeable. High quality data from GAIA (Global Astrometric Interferometer for Astrophysics) space observatory will clarify these issues.
Most debris disks around Sun-like moving group members are unresolved and their excess has been measured only in a few infrared bands. Generally these data allow us only the reliable estimate of characteristic dust temperature and fractional luminosity as fundamental disk parameters. Figure 4 shows the fractional luminosities as a function of dust temperatures for known debris disks around F8-K7 members of the five groups. As this plot demonstrates four of our current detections, the disks around HD 38397, HD 48370, HD 160305, and BD-20 951 represent the coldest population within the displayed sample.
4.3 Are there potential analogs of the young Solar System’s debris disk?
Comparing to exosolar debris systems, the present disk of the Solar System is very tenuous. However, in the early phase of its evolution it may have looked different. In the first few ten million years after the dispersal of the gas-rich primordial disk, terrestrial planets were still forming, while the giant planets and the Kuiper-belt were in a more compact configuration within 35 au (Morbidelli, 2010). Model calculations for the formation of the largest Kuiper–belt objects and binaries indicate that the original belt must have been significantly more massive (Stern, 1996; Chiang et al., 2007; Campo Bagatin & Benavidez, 2012). According to Booth et al. (2009) this massive predecessor of the Kuiper–belt contained so much dust that the Solar System’s debris disk was amongst the brightest of such systems at the time. This calculation is based on the NICE model (Gomes et al., 2005), which is one possible scenario for the evolution of the early Solar System. To investigate the evolution of Kuiper–belt’s dust content, Booth et al. (2009) utilized four different models. In the simplest one they assumed blackbody grains and a single-slope size distribution. This model provided the lowest characteristic dust temperature and disk fractional luminosity for the whole studied time period. In their more realistic models a three-phase size distribution was used and besides the simple blackbody grains, amorphous silicates and a comet-like grain composition were also evaluated. Based on their Figure 11, in the case of comet-like grains, the excess SED peaks at around 40µm which would correspond to a characteristic temperature of 130 K in a blackbody model. It is worth noting that the applied models were focused on the Kuiper–belt and the dust content of the main asteroid belt was neglected. Adopting this picture for our further analysis in Figure 4 we plotted the predictions of the simplest model for the given age range (20-40 Myr), indicating that it is a lower limit both for the dust temperature (55 K) and the fractional luminosity (910-4). The derived fractional luminosities for most debris disks around young Sun-like group members as well as the typical upper limits for stars deemed to have no excess (1–210-4) are significantly lower than the one inferred for the young Solar System.
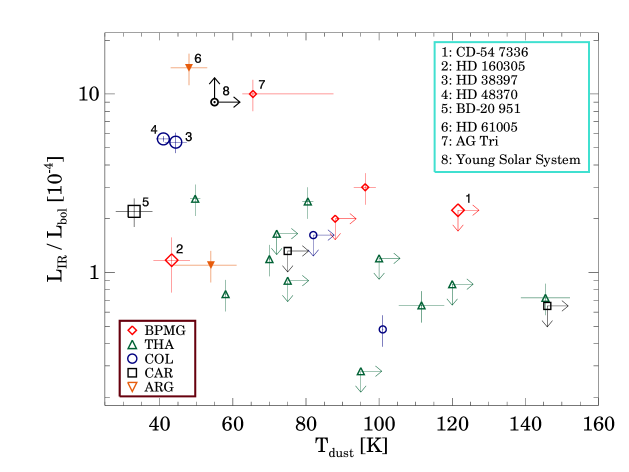
Four debris systems, AG Tri (member of the BPMG), HD 61005 (member of the ARG), HD 38397 and HD 48370 (members of the COL) stand out from the sample based on their fractional luminosity. These disks resemble well the supposed young Kuiper–belt in terms of this parameter, although their dust temperature is typically lower. While AG Tri is a lower mass K6Ve type star that resides in a wide separation binary system, the other three stars are known to be single. Because of this and of their masses the last three objects are really good analogs of our Sun: HD 61005 has a mass of 0.9640.025 M⊙ (Desidera et al., 2011), while HD 38397 and HD 48370 have masses of 1.060.05 M⊙, and 0.940.05 M⊙, respectively (derived by us based on PARSEC stellar evolutionary models Bressan et al., 2012). Analyzing the SED of AG Tri, both Ballering et al. (2013) and Riviere-Marichalar et al. (2014) claimed the presence of a single dust belt around the star. The SED of excess emission at HD 61005 cannot be adequately fitted by a single temperature blackbody, but only with a combination of two components, suggesting that the emitting dust – similarly to our Solar System – is concentrated in multiple spatially distinct dust belts around the star (e.g. Ricarte et al., 2013). In contrast with HD 61005, for HD 38397 and HD 48370 no mid-infrared spectrum is available, only the deviation of the WISE 22µm photometry from the SED model suggests the presence of warmer grains. Without much better coverage in the mid-IR regime, however, one cannot deduce whether these warmer particles are located in a separated inner belt. The outer disk around HD 61005 was spatially resolved both in scattered light and at millimeter wavelength (Buenzli et al., 2010; Olofsson et al., 2016; Ricarte et al., 2013). Based on these observations the disk radius is about 60-70 au. For HD 38397 and HD 48370 we derived disk radii of 90 au using their spatially resolved 70µm Herschel images (Sect. 3.3). The disk around AG Tri has not been resolved yet. In summary we can conclude that based on its predicted fractional luminosity the young Kuiper–belt would be amongst the brightest debris disks that can be found around Sun-like members of nearby young moving groups. Interestingly, in the resolved systems with similar dust contents the outer dust belt is located 2-3 farther from their hosts stars than the original Kuiper–belt that could be at an average heliocentric distance of 26 au (Booth et al., 2009), thus while HD 61005, HD 38397, and HD 48370 are similar to each other, they cannot be considered as perfect analogs of the young Solar System’s debris disk.
4.4 Stirring of planetesimals in the most massive debris disks around young Sun-like stars.
With their ages of 30-40 Myr, it is a question how the debris disk production in HD 38397, HD 48370 and HD 61005 can already be initiated at such large radial distances. For effective dust production via collisional erosion of planetesimals, the disk needs to be stirred by some mechanism, because without any dynamical excitation the collisions would occur at low relative velocities leading to a merge between the colliding bodies. According to the most commonly invoked self-stirring scenario, large, roughly 1000 km-sized planetesimals embedded in a belt can ignite destructive collisions between neighbouring smaller bodies, thereby initiating a collisional cascade (Kenyon & Bromley, 2004). However, the gradual build-up of such large bodies – if they are not present already after the disappearance of the protoplanetary disk (e.g. because they have formed in streaming instabilities Johansen et al., 2014) – via collisional coagulation requires time. The larger the distance from the star and the smaller the surface density of the disk, the longer the time needed for the formation of 1000 km-sized bodies, leading to an outward propagating stirring front that is slower in a less massive disk.
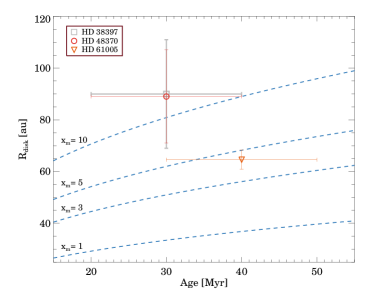
Using equation 28 from Kenyon & Bromley (2008) we computed the radius of the stirring front (the radius where 1000 km-size bodies have just been formed) as a function of time for disks with different initial surface density ( is a scaling factor for the reference surface density of Minimum Mass Solar Nebula), assuming a host star with stellar mass of 1 M⊙. In Figure 5 we confront the outcomes of this calculations with the disk parameters obtained for the three studied targets (adopting the age of the objects as the time available for the formation of large planetesimals). Based on this figure, if the self-stirring mechanism governs the dynamical excitation in these systems, then the surface density of their original protoplanetary disks should have been significantly higher than that supposed for the Minimum Mass Solar Nebula.
Alternatively, the motion of planetesimals could be excited by a giant planet via its secular perturbation even if the planet is located far from the belt (planetary stirring, Wyatt et al., 2005; Mustill & Wyatt, 2009). Indeed, in our Solar System both self-stirring and planetary stirring may contribute to the excitation of the Kuiper–belt leading to a high stirring level (Matthews et al., 2014). If the massive companion orbits closer to the host star than the planetesimals then this mechanism – similarly to self-stirring – results in an inside-out process, in which the site of active dust production propagates outward with time. However, for certain planet and disk parameters this process could be even faster than self-stirring, i.e. the collisional cascade could be ignited sooner at a given stellocentric distance (Mustill & Wyatt, 2009). By studying spatially resolved images of young debris disks around early type stars, Moór et al. (2015) identified several systems whose radial extent are far too large to be explained by self-stirring assuming reasonable initial disk masses. For such disks planetary stirring is a more feasible scenario. Indeed, in two of these systems, HR 8799 and HD 95086, the potential planetary mass perturbers have already been discovered via direct imaging (Marois et al., 2008; Rameau et al., 2013). The debris disks around HD 38397 and HD 48370 would also require unusually massive initial disks in a self-stirring model, thereby these systems are also good candidates for planetary stirring.
Predictions of stirring models are related to the dust producing planetesimals. Throughout our previous calculations we assumed that the observed dust grains trace the location of planetesimals reliably. However, the spatial distribution of debris grains could be different from that of the parent planetesimal belt. Small fragments produced in collisions can be moved on more eccentric orbit by the stellar radiation pressure resulting in a dust disk that extends outward from the birth ring (e.g., Krivov, 2010). In the case of HD 61005 the disk radius was inferred as the average of size estimates from resolved scattered light and millimeter images (Buenzli et al., 2010; Olofsson et al., 2016; Ricarte et al., 2013). Our original assumption is likely valid for this system, since millimeter emission predominantly traces the distribution of large dust grains with sizes of 100µm, that are not affected significantly by radiative forces and thus serve as proxy for the planetesimals. At 70µm, where HD 38397 and HD 48370 were marginally resolved, we trace smaller grains that could be sensitive to radiation pressure. Without any information on the grain composition, however, theoretically it is hard to judge how much more extended the disk could appear than the ring of parent planetesimals at this wavelength. In Moór et al. (2015) we selected some debris disks that were resolved both at 70 or 100µm with the Herschel and at millimeter wavelengths and then compared the pairs of disk sizes derived from the different bands. In all cases the outer radii measured in millimeter images were larger than the PACS-based average disk radii. For Eri the radial extent of the outer dust belt inferred from PACS 70 and 160µm observations (Greaves et al., 2014) is also well consistent within the uncertainties with that derived from recent millimeter observation (MacGregor et al., 2015). These results suggest that this phenomenon may not affect significantly our findings.
4.5 Disk mass and power law index of dust size distribution at HD 48370
The good quality submillimeter/millimeter photometry of HD 48370 allow us to provide estimates both for the disk mass and the power-law index of the dust size distribution (). With its mass of 0.12 M⊕ the disk around HD 48370 is amongst the most massive debris disks known to us. By gathering (sub)millimeter data of debris disks with G-type host stars from the literature (Sheret et al., 2004; Williams et al., 2004; Carpenter et al., 2005; Corder et al., 2009; Roccatagliata et al., 2009; Nilsson et al., 2010; Panić et al., 2013; Ricarte et al., 2013; Ricci et al., 2015a) and estimate their dust masses homogeneously in the same way as in Sect. 3.3 we found that only HD 61005 and HD 107146 harbour similarly massive disks.
In his pioneering work, Dohnanyi (1969) derived as the power law index of size distribution for a steady state collisional cascade, assuming that both the tensile strength and the velocity dispersion of the colliding bodies are independent of their size. More sophisticated collisional models of Pan & Schlichting (2012) and Gáspár et al. (2012) predict steeper size distributions with typically larger than 3.6. By fitting the photometric data of HD 48370 at 350µm the power-law index of dust size distribution () was estimated to be 3.250.07 (Sect. 3.3). This finding is valid for a grain size interval ranging from 0.1 mm to a few millimeter since our observations are primarily sensitive for emission from such dust particles. The derived value is significantly lower than the theoretically predicted ones. Before we compare this value to slopes measured in other debris disks and consider the possible physical reasons of this deviation it is worth assessing the feasibility of source confusion as an alternative explanation of this finding.
Since our target was not resolved at millimeter wavelengths, contamination by other sources could not be completely excluded, i.e. it is possible that the measured millimeter excesses are not limited to the disk themselves. However, to be able to result in a millimeter slope shallower than that of the disk itself such contaminating sources must be comparably bright to the disk and must have a millimeter slope shallow enough.
By observing Cen A/B and Eri – stars with similar spectral types to our target – with radio interferometers, both Liseau et al. (2015) and MacGregor et al. (2015) found that their measured millimeter emission is higher than predicted based on the pure photospheric models. The observed excess may be attributed to the stellar chromosphere or the corona. Using 0.87 and 3.1 mm data Liseau et al. (2015) derived spectral indices of 1.62 and 1.61 for Cen A and Cen B, respectively, while MacGregor et al. (2015) measured a spectral index of 1.65 between 1.3 and 6.8 mm in the case of Eri, implying that this type of contamination could be more significant at longer wavelengths. However, the excesses are not very strong even at the longest wavelengths, in the cases of Cen A/B the total measured fluxes at 3.1 mm are 2 higher than the predicted photospheric ones, while for Eri a flux enhancement of 3 was derived at 6.8 mm. Even if we consider that HD 48370 is younger and more active star than the previous ones and therefore the flux enhancement might be larger, the level of contamination from the star may not have a significant influence on the measured excess, that is e.g. 800 higher than the predicted photospheric flux at 2.14 mm in the case of HD 48370.
Large submillimeter/millimeter surveys revealed a massive population of luminous high-redshift submillimeter galaxies (Blain et al., 2002), most of them are site of very intense star formation. In order to assess how such background sources can modify the derived millimeter slope of our target we took the average SED of ALESS sub-millimeter galaxy sample compiled by da Cunha et al. (2015) as a template. Adopting different redshift values and different flux densities at a reference wavelength of 0.87 mm, we used this template to derive the possible galaxy contamination at 0.35, 0.50, 1.25 and 2.14 mm. Then we subtracted the hypothetical contamination from the measured flux densities of HD 48370 and repeated our fitting process (Sect. 3.3) to determine from the resulted SED. We found that contamination by galaxies at redshift of 3.5 can result in the observed slope even if the disk has a of 3.5 (correspondingly the prediction of Dohnanyi, 1969). At a redshift of such a galaxy must have a flux density of 16 mJy at 0.87 mm, while at a redshift of 6.0 it should be brighter than 7 mJy at 0.87 mm. In the former case the background galaxy would dominate the combined SED at 0.5 mm, while in the higher redshift scenario its brightness would be comparable with that of the disk at the longest wavelengths of 1.25 and 2.14 mm. Using the formula (eq. 1) of Simpson et al. (2015), we estimated the number density of submillimeter galaxies with flux density of 7 mJy at 0.87 mm to be about 50 sources per square degree. Considering the FWHM of IRAM/NIKA beam at 1.25 mm (125) the probability of coincidence with such a galaxy is 510-4. Thus it is also highly unlikely that such background submillimeter galaxies can explain the low value measured in this debris disk.
Indeed, the measured low slope of the power law grain size distribution in HD 48370 system is not unique. By combining recent VLA 9 mm and archival ATCA 7 mm observations (taken from Ricci et al., 2012, 2015b) with previous (sub)millimeter data for 15 debris disks, MacGregor et al. (2016) also found relatively shallow slopes with a weighted mean of 0.02. In their sample there are four disks with . Thus, observationally obtained slopes of the solids’ size distribution found to be typically lower than the values predicted by model calculations for collisional cascades of planetesimals. MacGregor et al. (2016) proposed several physical explanations for the measured low values. They found that adopting a size dependent velocity distribution where the velocity increases toward smaller grains, or assuming millimeter, centimeter sized grains with strength scaling law similar to ’rubble piles’, i.e. held together by gravity instead of strength, can result in a grain size distribution consistent with the observed ones. In their third scenario, the presence of small grain size cutoff due to radiation pressure thought to induce a wavy pattern on the power law grain size distribution (e.g. Campo Bagatin et al., 1994). which can affect the determination of , providing an alternative explanation for their findings. However, in a realistic disk several effects could weaken or smear the expected waviness of the size distribution (Krivov et al., 2006) making this scenario less feasible.
Here we note that the presence of extended regions with low dynamical excitation within the disk could also provide a possible explanation for the low measured values. According to both the self-stirring and the planetary stirring models in an extended planetesimal disk there could be outer regions that are not reached by the stirring front and where collisions between bodies produce only a lower amount of dust or lead to merging rather than destruction. In such dynamically cold environment the bulk of the emitting dust grains could be moderately large and radiate like blackbodies (Heng & Tremaine, 2010; Krivov et al., 2013), in regions where the coagulation processes are dominant, the slope of the grain size distribution could be very shallow, the value of could be even as low as 2.5 (e.g., Miyake & Nakagawa, 1993). The observation of the collision dominated inner and the coagulation dominated outer parts of a disk without any spatial separation can result in an averaged, lower value. This scenario might rather be relevant in young systems where the stirring front cannot be propagated out to the outer edge of the disk. We note that the presence of such a weakly excited extended outer region can also modify our conclusions on stirring (Sect. 4.4) since in such case the outer edge of a dust disk would not necessarily represent the position of the stirring front.
5 Summary
Aimed at studying the early evolution of planetesimal belts and searching for potential analogs of the young Solar System’s debris disk we studied 31 members of five nearby young moving groups using the PACS instrument of the Herschel Space Observatory. None of our targets were observed at far-IR wavelength previously. Most of our selected objects have spectral types between F8 and K7 thus can be considered as good analogs of the young Sun. Our PACS measurements were complemented by ancillary photometry from the WISE satellite, and by continuum submillimeter/millimeter data for one of our sources, HD 48370. We identified six stars with IR excess, one of them showing excess only in the WISE band. Four of these are new discoveries. By assessing the probability of source confusion (particularly due to extragalactic objects) we found that the observed excess comes from circumstellar debris disks in the majority of these six sources. The spectral energy distribution of the targets was modeled with a single component modified blackbody representing a narrow dust ring. In the case of HD 38397 and HD 48370 (and to a lesser extent at HD 160305) the excess at 22µm with respect to these models hints at a second warmer dust component. For HD 38397 and HD 48370, the emission is resolved in the 70µm PACS images, allowing us to estimate the sizes of these disks.
By combining our new findings with the outcome of other previous infrared surveys for those nearby (80 pc) Sun-like members of the five selected nearby moving groups that were observed at 70µm, we found that 25 among the 66 systems exhibit some excess emission, the detection rate at 70µm is 13/66. The latter rate can be considered as a lower limit because the stellar photosphere was detected only for the minority of the targets at this wavelength. We examined how well these systems resemble the predicted debris disk of the young Solar System. We found that concerning their dust content three G-type stars (HD 61005 and our targets, HD 38397 and HD 48370) can be considered as analogs of the hypothesized ancient Solar System’s debris disk, however their outer dust belts are located at 2-3 times larger radial distances. These three debris systems are highly interesting by themselves because they represent the highest mass end of the known debris disk population around young G-type stars. By evaluating the feasibility of the self-stirring scenario for these systems we found that a reasonable explanation of their current disk structure would require a protoplanetary disk that was more massive than the Minimum Mass Solar Nebula. Particularly in the case of HD 38397 and HD 48370 the required initial surface densities raise the possibility that planetary stirring might also contribute to the dynamical excitation of their outer planetesimal belts. This implies that these sources could be promising candidates for direct imaging planet searches. Using the measured submillimeter/millimeter data of HD 48370 we derived a value of 3.250.07 for the slope of the power-law grain size distribution, lower than the typical slopes predicted by collisional cascade models.
References
- Apai (2009) Apai, D. 2009, Earth Moon and Planets, 105, 311
- Apai et al. (2015) Apai, D., Schneider, G., Grady, C. A., et al. 2015, ApJ, 800, 136
- Ballering et al. (2013) Ballering, N. P., Rieke, G. H., Su, K. Y. L., & Montiel, E. 2013, ApJ, 775, 55
- Balog et al. (2014) Balog, Z., Müller, T., Nielbock, M., et al. 2014, Experimental Astronomy, 37, 129
- Barrado y Navascués et al. (1999) Barrado y Navascués, D., Stauffer, J. R., Song, I., & Caillault, J.-P. 1999, ApJ, 520, L123
- Bell et al. (2015) Bell, C. P. M., Mamajek, E. E., & Naylor, T. 2015, MNRAS, 454, 593
- Bendo et al. (2013) Bendo, G. J., Griffin, M. J., Bock, J. J., et al. 2013, MNRAS, 433, 3062
- Berta et al. (2011) Berta, S., Magnelli, B., Nordon, R., et al. 2011, A&A, 532, A49
- Beust & Morbidelli (1996) Beust, H., & Morbidelli, A. 1996, Icarus, 120, 358
- Binks & Jeffries (2014) Binks, A. S., & Jeffries, R. D. 2014, MNRAS, 438, L11
- Blain et al. (2002) Blain, A. W., Smail, I., Ivison, R. J., Kneib, J.-P., & Frayer, D. T. 2002, Phys. Rep., 369, 111
- Booth et al. (2009) Booth, M., Wyatt, M. C., Morbidelli, A., Moro-Martín, A., & Levison, H. F. 2009, MNRAS, 399, 385
- Booth et al. (2013) Booth, M., Kennedy, G., Sibthorpe, B., et al. 2013, MNRAS, 428, 1263
- Bressan et al. (2012) Bressan, A., Marigo, P., Girardi, L., et al. 2012, MNRAS, 427, 127
- Buenzli et al. (2010) Buenzli, E., Thalmann, C., Vigan, A., et al. 2010, A&A, 524, L1
- Calvet et al. (2002) Calvet, N., D’Alessio, P., Hartmann, L., et al. 2002, ApJ, 568, 1008
- Campo Bagatin et al. (1994) Campo Bagatin, A., Cellino, A., Davis, D. R., Farinella, P., & Paolicchi, P. 1994, Planet. Space Sci., 42, 1079
- Campo Bagatin & Benavidez (2012) Campo Bagatin, A., & Benavidez, P. G. 2012, MNRAS, 423, 1254
- Carpenter et al. (2005) Carpenter, J. M., Wolf, S., Schreyer, K., Launhardt, R., & Henning, T. 2005, AJ, 129, 1049
- Carpenter et al. (2009) Carpenter, J. M., Bouwman, J., Mamajek, E. E., et al. 2009, ApJS, 181, 197
- Castelli & Kurucz (2004) Castelli, F., & Kurucz, R. L. 2004, arXiv:astro-ph/0405087
- Catalano et al. (2014) Catalano, A., Calvo, M., Ponthieu, N., et al. 2014, A&A, 569, A9
- Chen et al. (2014) Chen, C. H., Mittal, T., Kuchner, M., et al. 2014, ApJS, 211, 25
- Chiang et al. (2007) Chiang, E., Lithwick, Y., Murray-Clay, R., et al. 2007, Protostars and Planets V, 895
- Cohen et al. (2003) Cohen, M., Wheaton, W. A., & Megeath, S. T. 2003, AJ, 126, 1090
- Condon (1974) Condon, J. J. 1974, ApJ, 188, 279
- Corder et al. (2009) Corder, S., Carpenter, J. M., Sargent, A. I., et al. 2009, ApJ, 690, L65
- Crawford (1975) Crawford, D. L. 1975, AJ, 80, 955
- Crawford (1979) —. 1979, AJ, 84, 1858
- da Cunha et al. (2015) da Cunha, E., Walter, F., Smail, I. R., et al. 2015, ApJ, 806, 110
- da Silva et al. (2009) da Silva, L., Torres, C. A. O., de La Reza, R., et al. 2009, A&A, 508, 833
- Desidera et al. (2011) Desidera, S., Carolo, E., Gratton, R., et al. 2011, A&A, 533, A90
- Desidera et al. (2015) Desidera, S., Covino, E., Messina, S., et al. 2015, A&A, 573, A126
- Dohnanyi (1969) Dohnanyi, J. S. 1969, J. Geophys. Res., 74, 2531
- Donaldson et al. (2012) Donaldson, J. K., Roberge, A., Chen, C. H., et al. 2012, ApJ, 753, 147
- Draine (2006) Draine, B. T. 2006, ApJ, 636, 1114
- Elliott et al. (2014) Elliott, P., Bayo, A., Melo, C. H. F., et al. 2014, A&A, 568, A26
- Elliott et al. (2015) Elliott, P., Huélamo, N., Bouy, H., et al. 2015, A&A, 580, A88
- Gagné et al. (2014) Gagné, J., Lafrenière, D., Doyon, R., Malo, L., & Artigau, É. 2014, ApJ, 783, 121
- Gáspár et al. (2012) Gáspár, A., Psaltis, D., Rieke, G. H., & Özel, F. 2012, ApJ, 754, 74
- Gáspár & Rieke (2014) Gáspár, A., & Rieke, G. H. 2014, ApJ, 784, 33
- Genda et al. (2015) Genda, H., Kobayashi, H., & Kokubo, E. 2015, ApJ, 810, 136
- Gomes et al. (2005) Gomes, R., Levison, H. F., Tsiganis, K., & Morbidelli, A. 2005, Nature, 435, 466
- Greaves et al. (2014) Greaves, J. S., Kennedy, G. M., Thureau, N., et al. 2014, MNRAS, 438, L31
- Hauck & Mermilliod (1998) Hauck, B., & Mermilliod, M. 1998, A&AS, 129, 431
- Heng & Tremaine (2010) Heng, K., & Tremaine, S. 2010, MNRAS, 401, 867
- Høg et al. (2000) Høg, E., Fabricius, C., Makarov, V. V., et al. 2000, A&A, 357, 367
- Jackson & Wyatt (2012) Jackson, A. P., & Wyatt, M. C. 2012, MNRAS, 425, 657
- Jacobson et al. (2014) Jacobson, S. A., Morbidelli, A., Raymond, S. N., et al. 2014, Nature, 508, 84
- Johansen et al. (2014) Johansen, A., Blum, J., Tanaka, H., et al. 2014, Protostars and Planets VI, 547
- Kastner et al. (2008) Kastner, J. H., Zuckerman, B., Hily-Blant, P., & Forveille, T. 2008, A&A, 492, 469
- Kennedy & Wyatt (2014) Kennedy, G. M., & Wyatt, M. C. 2014, MNRAS, 444, 3164
- Kenyon & Bromley (2004) Kenyon, S. J., & Bromley, B. C. 2004, AJ, 127, 513
- Kenyon & Bromley (2008) —. 2008, ApJS, 179, 451
- Kiss et al. (2011) Kiss, L. L., Moór, A., Szalai, T., et al. 2011, MNRAS, 411, 117
- König et al. (2011) König, S., Münker, C., Hohl, S., et al. 2011, Geochim. Cosmochim. Acta, 75, 2119
- Kraus et al. (2014) Kraus, A. L., Shkolnik, E. L., Allers, K. N., & Liu, M. C. 2014, AJ, 147, 146
- Krivov et al. (2006) Krivov, A. V., Löhne, T., & Sremčević, M. 2006, A&A, 455, 509
- Krivov (2010) Krivov, A. V. 2010, Research in Astronomy and Astrophysics, 10, 383
- Krivov et al. (2013) Krivov, A. V., Eiroa, C., Löhne, T., et al. 2013, ApJ, 772, 32
- Lallement et al. (2003) Lallement, R., Welsh, B. Y., Vergely, J. L., Crifo, F., & Sfeir, D. 2003, A&A, 411, 447
- Liseau et al. (2015) Liseau, R., Vlemmings, W., Bayo, A., et al. 2015, A&A, 573, L4
- MacGregor et al. (2015) MacGregor, M. A., Wilner, D. J., Andrews, S. M., Lestrade, J.-F., & Maddison, S. 2015, ApJ, 809, 47
- MacGregor et al. (2016) MacGregor, M. A., Wilner, D. J., Chandler, C., et al. 2016, ApJ, 823, 79
- Malo et al. (2013) Malo, L., Doyon, R., Lafrenière, D., et al. 2013, ApJ, 762, 88
- Mamajek & Bell (2014) Mamajek, E. E., & Bell, C. P. M. 2014, MNRAS, 445, 2169
- Markwardt (2009) Markwardt, C. B. 2009, in Astronomical Society of the Pacific Conference Series, Vol. 411, Astronomical Data Analysis Software and Systems XVIII, ed. D. A. Bohlender, D. Durand, & P. Dowler, 251
- Marois et al. (2008) Marois, C., Macintosh, B., Barman, T., et al. 2008, Science, 322, 1348
- Matthews et al. (2014) Matthews, B. C., Krivov, A. V., Wyatt, M. C., Bryden, G., & Eiroa, C. 2014, Protostars and Planets VI, 521
- Miyake & Nakagawa (1993) Miyake, K., & Nakagawa, Y. 1993, Icarus, 106, 20
- Moór et al. (2006) Moór, A., Ábrahám, P., Derekas, A., et al. 2006, ApJ, 644, 525
- Moór et al. (2013) Moór, A., Szabó, G. M., Kiss, L. L., et al. 2013, MNRAS, 435, 1376
- Moór et al. (2014) Moór, A., Müller, T. G., Kiss, C., et al. 2014, Experimental Astronomy, 37, 225
- Moór et al. (2015) Moór, A., Kóspál, Á., Ábrahám, P., et al. 2015, MNRAS, 447, 577
- Morales et al. (2013) Morales, F. Y., Bryden, G., Werner, M. W., & Stapelfeldt, K. R. 2013, ApJ, 776, 111
- Morbidelli (2010) Morbidelli, A. 2010, Comptes Rendus Physique, 11, 651
- Mouillet et al. (1997) Mouillet, D., Larwood, J. D., Papaloizou, J. C. B., & Lagrange, A. M. 1997, MNRAS, 292, 896
- Mustill & Wyatt (2009) Mustill, A. J., & Wyatt, M. C. 2009, MNRAS, 399, 1403
- Nilsson et al. (2010) Nilsson, R., Liseau, R., Brandeker, A., et al. 2010, A&A, 518, A40
- Olofsson et al. (2016) Olofsson, J., Samland, M., Avenhaus, H., et al. 2016, A&A, 591, A108
- Olsen (1984) Olsen, E. H. 1984, A&AS, 57, 443
- Ott (2010) Ott, S. 2010, in Astronomical Society of the Pacific Conference Series, Vol. 434, Astronomical Data Analysis Software and Systems XIX, ed. Y. Mizumoto, K.-I. Morita, & M. Ohishi, 139
- Pan & Schlichting (2012) Pan, M., & Schlichting, H. E. 2012, ApJ, 747, 113
- Panić et al. (2013) Panić, O., Holland, W. S., Wyatt, M. C., et al. 2013, MNRAS, 435, 1037
- Patel et al. (2014) Patel, R. I., Metchev, S. A., & Heinze, A. 2014, ApJS, 212, 10
- Pawellek et al. (2014) Pawellek, N., Krivov, A. V., Marshall, J. P., et al. 2014, ApJ, 792, 65
- Perryman et al. (1997) Perryman, M. A. C., Lindegren, L., Kovalevsky, J., et al. 1997, A&A, 323, 49
- Pilbratt et al. (2010) Pilbratt, G. L., Riedinger, J. R., Passvogel, T., et al. 2010, A&A, 518, L1
- Plavchan et al. (2009) Plavchan, P., Werner, M. W., Chen, C. H., et al. 2009, ApJ, 698, 1068
- Poglitsch et al. (2010) Poglitsch, A., Waelkens, C., Geis, N., et al. 2010, A&A, 518, L2
- Rameau et al. (2013) Rameau, J., Chauvin, G., Lagrange, A.-M., et al. 2013, ApJ, 779, L26
- Rebull et al. (2008) Rebull, L. M., Stapelfeldt, K. R., Werner, M. W., et al. 2008, ApJ, 681, 1484
- Ricarte et al. (2013) Ricarte, A., Moldvai, N., Hughes, A. M., et al. 2013, ApJ, 774, 80
- Ricci et al. (2015a) Ricci, L., Carpenter, J. M., Fu, B., et al. 2015a, ApJ, 798, 124
- Ricci et al. (2015b) Ricci, L., Maddison, S. T., Wilner, D., et al. 2015b, ApJ, 813, 138
- Ricci et al. (2012) Ricci, L., Testi, L., Maddison, S. T., & Wilner, D. J. 2012, A&A, 539, L6
- Riviere-Marichalar et al. (2012) Riviere-Marichalar, P., Barrado, D., Augereau, J.-C., et al. 2012, A&A, 546, L8
- Riviere-Marichalar et al. (2014) Riviere-Marichalar, P., Barrado, D., Montesinos, B., et al. 2014, A&A, 565, A68
- Roberge et al. (2013) Roberge, A., Kamp, I., Montesinos, B., et al. 2013, ApJ, 771, 69
- Roccatagliata et al. (2009) Roccatagliata, V., Henning, T., Wolf, S., et al. 2009, A&A, 497, 409
- Sánchez-Portal et al. (2014) Sánchez-Portal, M., Marston, A., Altieri, B., et al. 2014, Experimental Astronomy, 37, 453
- Sheret et al. (2004) Sheret, I., Dent, W. R. F., & Wyatt, M. C. 2004, MNRAS, 348, 1282
- Sibthorpe et al. (2013) Sibthorpe, B., Ivison, R. J., Massey, R. J., et al. 2013, MNRAS, 428, L6
- Simpson et al. (2015) Simpson, J. M., Smail, I., Swinbank, A. M., et al. 2015, ApJ, 807, 128
- Skrutskie et al. (2006) Skrutskie, M. F., Cutri, R. M., Stiening, R., et al. 2006, AJ, 131, 1163
- Stern (1996) Stern, S. A. 1996, AJ, 112, 1203
- Torres et al. (2000) Torres, C. A. O., da Silva, L., Quast, G. R., de la Reza, R., & Jilinski, E. 2000, AJ, 120, 1410
- Torres et al. (2003) Torres, C. A. O., Quast, G. R., de La Reza, R., et al. 2003, Astrophysics and Space Science Library, 299, 83
- Torres et al. (2006) Torres, C. A. O., Quast, G. R., da Silva, L., et al. 2006, A&A, 460, 695
- Torres et al. (2008) Torres, C. A. O., Quast, G. R., Melo, C. H. F., & Sterzik, M. F. 2008, Young Nearby Loose Associations, ed. B. Reipurth, 757
- Vican & Schneider (2014) Vican, L., & Schneider, A. 2014, ApJ, 780, 154
- Werner et al. (2004) Werner, M. W., Roellig, T. L., Low, F. J., et al. 2004, ApJS, 154, 1
- Williams & Andrews (2006) Williams, J. P., & Andrews, S. M. 2006, ApJ, 653, 1480
- Williams et al. (2004) Williams, J. P., Najita, J., Liu, M. C., et al. 2004, ApJ, 604, 414
- Wright et al. (2010) Wright, E. L., Eisenhardt, P. R. M., Mainzer, A. K., et al. 2010, AJ, 140, 1868
- Wu et al. (2013) Wu, C.-J., Wu, H., Lam, M.-I., et al. 2013, ApJS, 208, 29
- Wyatt (2008) Wyatt, M. C. 2008, ARA&A, 46, 339
- Wyatt et al. (2005) Wyatt, M. C., Greaves, J. S., Dent, W. R. F., & Coulson, I. M. 2005, ApJ, 620, 492
- Zuckerman & Webb (2000) Zuckerman, B., & Webb, R. A. 2000, ApJ, 535, 959
- Zuckerman et al. (2001) Zuckerman, B., Song, I., Bessell, M. S., & Webb, R. A. 2001, ApJ, 562, L87
- Zuckerman et al. (2011) Zuckerman, B., Rhee, J. H., Song, I., & Bessell, M. S. 2011, ApJ, 732, 61
| Target | Spectral type | V | Distance | Multiplicity | Teff | Luminosity |
|---|---|---|---|---|---|---|
| (mag) | (pc) | (K) | (L⊙) | |||
| BPMG | ||||||
| CD-54 7336 | K1V | 9.6 | 66T | N | 5050 | 0.69 |
| HD 160305 | F8/G0V∗ | 8.3∗ | 72H | N | 6050 | 1.97 |
| HD 168210 | G5V | 8.9 | 73H | N | 5650 | 1.43 |
| CD-31 16041 | K7Ve | 11.2 | 51T | N | 3850 | 0.20 |
| THA | ||||||
| CD-78 24 | K3Ve | 10.2 | 50T | N | 4550 | 0.25 |
| HD 25402 | G3V∗ | 8.4∗ | 48H | N | 5850 | 0.89 |
| TYC 8083-0455-1 | K7Ve | 11.5 | 46T | N | 4000 | 0.11 |
| BD-19 1062 | K3V(e) | 10.6 | 68T | N | 4650 | 0.31 |
| CD-30 2310 | K4Ve | 11.7 | 65T | N | 4050 | 0.17 |
| CD-86 147 | G8IV | 9.3 | 60T | N | 5450 | 0.63 |
| COL | ||||||
| CD-36 1785 | K1Ve | 10.8 | 77T | N | 4900 | 0.28 |
| GSC 8077-1788 | M0Ve | 13.0 | 76T | Y | 3600 | 0.10 |
| HD 31242 | G5V | 9.9 | 76T | Y | 5650 | 0.61 |
| HD 272836 | K2V(e) | 10.8 | 76T | Y | 4800 | 0.34 |
| HD 32372 | G5V | 9.5 | 76H | N | 5500 | 0.84 |
| HD 32309 | B9V∗ | 4.9∗ | 61H | N | 10200 | 41.28 |
| HIP 25434 | G0∗ | 9.1∗ | 71H | Y | 6350 | 1.06 |
| HD 35996 | F3/F5IV/V∗ | 8.2∗ | 71H | Y | 6700 | 2.03 |
| HD 274561 | K1V(e) | 11.4 | 78T | N | 4800 | 0.19 |
| HD 36329 | G3V | 9.2 | 71H | Y | 5800 | 1.73 |
| HD 38397 | G0V∗ | 8.1∗ | 55H | N | 6000 | 1.40 |
| CD-52 1363 | G9IV | 10.6 | 106T | N | 5150 | 0.63 |
| HD 48370 | G8V | 7.9 | 35T | N | 5600 | 0.72 |
| HD 51797 | K0V(e) | 9.8 | 75T | N | 5200 | 0.62 |
| CD-54 4320aaTorres et al. (2008) proposed this star as a member of the Carina moving group, but according to the analysis of Malo et al. (2013) it rather belongs to the Columba association. | K5Ve | 10.2 | 44T | N | 4400 | 0.23 |
| CAR | ||||||
| BD-20 951bbTorres et al. (2008) assigned BD-20 951 to the Tucana-Horologium group, recently, however Elliott et al. (2014) proposed this star as a member of the Carina group. | K1V(e) | 10.3 | 72T | Y | 4650 | 0.67 |
| ARG | ||||||
| BW Phe | K3Ve | 9.6 | 41H | Y | 4600 | 0.52 |
| CD-42 2906 | K1V | 10.6 | 96T | N | 5100 | 0.49 |
| CD-43 3604 | K4Ve | 10.9 | 79T | N | 4550 | 0.35 |
| HD 67945 | F0V | 8.1 | 64T | N | 6950 | 1.92 |
| CD-52 9381 | K6Ve | 10.6 | 29T | N | 4200 | 0.08 |
Note. — Col.(1): Target name. Col.(2): Spectral type, taken from Torres et al. (2008) if available, otherwise (marked by asterisks) Hipparcos data were used. Col.(3): V band magnitude, taken from Torres et al. (2008) if available, otherwise (marked by asterisks) Hipparcos data were used. Col.(4): Distance. When Hipparcos data were available the distances were computed from the measured trigonometric parallaxes, in other cases the distance data were taken from Torres et al. (2008). For components of wide separation binaries (HD 35996/HIP 25434 and HD 31242/GSC 8077-1788) we listed the average of their estimated distances. Col.(5): Multiplicity. BD-20 951 and HD 36329 are SB2 stars (Torres et al., 2008). BW Phe and HD 272836 are visual binaries with separations of 02 and 152 (Torres et al., 2008; Elliott et al., 2015). GSC 8077-1788 is a wide separation (183) companion of HD 31242 (Torres et al., 2008). HD 35996 and HIP 25434 also constitute a wide pair with a separation of 12″. Desidera et al. (2015) found that HD 35996 is an SB system that might have an orbital period of a few years. Col.(6): Effective temperature. For close binaries with separation less than 5″, we used the combined photometry of the components in the photosphere fitting (Sect. 3.1), hence the derived effective temperatures refer to the combined photospheres. In the case of BD-20 951, where Elliott et al. (2014) estimated a flux ratio of 0.25 for the two components, the fainter and colder companion may significantly contribute to the total near-IR fluxes resulting in a lower effective temperature for the whole system than that of the primary component. Col.(7): Luminosity.
| Target | Obs. ID. | Date | Repetition |
|---|---|---|---|
| CD-54 7336 | 1342240321/22aaPACS mini scanmap observations taken from the Herschel Archive (OT1_dpadgett_1 programme, PI: D. Padgett). | 2012-03-06 | 3 |
| HD 160305 | 1342241521/22aaPACS mini scanmap observations taken from the Herschel Archive (OT1_dpadgett_1 programme, PI: D. Padgett). | 2012-03-16 | 3 |
| HD 168210 | 1342269686/87 | 2013-04-09 | 2 |
| CD-31 16041 | 1342267591/92 | 2013-03-14 | 4 |
| CD-78 24 | 1342269672/73 | 2013-04-09 | 4 |
| HD 25402 | 1342269646/47 | 2013-04-08 | 2 |
| TYC 8083-045 | 1342269670/71 | 2013-04-09 | 8 |
| BD-19 1062 | 1342269654/55 | 2013-04-08 | 4 |
| CD-30 2310 | 1342269256/57 | 2013-04-02 | 8 |
| CD-86 147 | 1342269674/75 | 2013-04-09 | 4 |
| CD-36 1785 | 1342269648/49 | 2013-04-08 | 8 |
| GSC 8077-178 | 1342269666/67 | 2013-04-09 | 4 |
| HD 31242 | 1342269666/67 | 2013-04-09 | 4 |
| HD 272836 | 1342269668/69 | 2013-04-09 | 4 |
| HD 32372 | 1342269664/65 | 2013-04-09 | 4 |
| HD 32309 | 1342269652/53 | 2013-04-08 | 2 |
| HIP 25434 | 1342269662/63 | 2013-04-09 | 2 |
| HD 35996 | 1342269662/63 | 2013-04-09 | 2 |
| HD 274561 | 1342269252/53 | 2013-04-02 | 8 |
| HD 36329 | 1342269254/55 | 2013-04-02 | 2 |
| HD 38397 | 1342242088/89aaPACS mini scanmap observations taken from the Herschel Archive (OT1_dpadgett_1 programme, PI: D. Padgett). | 2012-03-20 | 3 |
| CD-52 1363 | 1342269250/51 | 2013-04-02 | 4 |
| HD 48370 | 1342269656/57 | 2013-04-08 | 2 |
| 1342250790/91bbSPIRE/PACS parallel maps. | 2012-09-09 | … | |
| 1342253429/30bbSPIRE/PACS parallel maps. | 2012-10-15 | … | |
| HD 51797 | 1342269660/61 | 2013-04-08 | 4 |
| CD-54 4320 | 1342265607/08 | 2013-02-21 | 4 |
| BD-20 951 | 1342269650/51 | 2013-04-08 | 4 |
| BW Phe | 1342270953/54 | 2013-04-27 | 2 |
| CD-42 2906 | 1342265518/19 | 2013-02-20 | 8 |
| CD-43 3604 | 1342269658/59 | 2013-04-08 | 4 |
| HD 67945 | 1342269779/80 | 2013-04-10 | 2 |
| CD-52 9381 | 1342267766/67 | 2013-03-17 | 4 |
Note. — Col.(1): Target name. Col.(2): Observation identifier. Col.(3): Date of the observation. Col.(4): Repetition factor of PACS mini scanmap observations.
| Target | 22.088m | 70m | 160m | |||||||
|---|---|---|---|---|---|---|---|---|---|---|
| FW4 | PW4 | F70 [mJy] | P70 [mJy] | F160 [mJy] | P160 [mJy] | [10-4] | ||||
| CD-54 7336 | 14.41.2 | 9.4 | 3.8 | 8.93.2 | 0.9 | … | 3.918.1 | 0.18 | … | 2.2 |
| HD 160305 | 17.71.5 | 13.0 | 2.8 | 26.54.3 | 1.3 | 5.9 | 26.58.5 | 0.24 | 3.1 | |
| HD 168210 | 14.61.7 | 11.6 | 1.7 | 4.53.4 | 1.1 | … | 46.012.4aaExtended nebulosity contaminated the area of the aperture. | 0.21 | … | 0.8 |
| CD-31 16041 | 9.21.3 | 10.8 | 1.2 | 0.82.3 | 1.1 | … | 3.08.0 | 0.20 | … | 1.8 |
| CD-78 24 | 8.20.9 | 8.3 | 0.1 | 2.42.4 | 0.8 | … | 0.68.7 | 0.16 | … | 1.6 |
| HD 25402 | 16.61.2 | 14.5 | 1.5 | 6.82.7 | 1.4 | … | 9.99.6 | 0.27 | … | 0.5 |
| TYC 8083-0455-1 | 7.80.7 | 6.7 | 1.3 | 0.12.0 | 0.7 | … | 0.75.5 | 0.13 | … | 2.3 |
| BD-19 1062 | 5.70.9 | 5.2 | 0.5 | 6.02.1 | 0.5 | … | 1.87.2 | 0.10 | … | 2.0 |
| CD-30 2310 | 4.70.8 | 4.7 | 0.0 | 1.92.0 | 0.5 | … | 0.29.4 | 0.09 | … | 3.2 |
| CD-86 147 | 8.50.9 | 8.2 | 0.3 | 1.83.3 | 0.8 | … | 14.08.2 | 0.15 | … | 1.2 |
| CD-36 1785 | 3.00.7 | 3.0 | 0.0 | 1.31.8 | 0.3 | … | 12.65.4 | 0.06 | … | 3.9 |
| GSC 8077-1788 | 3.20.6 | 3.2 | 0.1 | 1.12.0 | 0.3 | … | 4.55.6 | 0.06 | … | 7.0 |
| HD 31242 | 5.80.7 | 4.5 | 1.7 | 1.62.0 | 0.4 | … | 0.86.4 | 0.08 | … | 1.2 |
| HD 272836 | 4.70.7 | 4.2 | 0.7 | 3.01.8 | 0.4 | … | 2.93.9 | 0.08 | … | 1.9 |
| HD 32372 | 8.40.8 | 6.7 | 2.0 | 7.32.4 | 0.7 | 2.8 | 15.910.4 | 0.12 | … | 1.0 |
| HD 32309 | 87.55.5 | 77.9 | 1.4 | 5.91.5 | 7.6 | 1.1 | 9.79.1 | 1.42 | … | 0.009 |
| HIP 25434 | 6.40.7 | 6.3 | 0.1 | 1.42.2 | 0.6 | … | 6.47.3 | 0.12 | … | 0.7 |
| HD 35996 | 16.91.2 | 10.4 | 4.8 | 8.71.9 | 1.0 | 4.0 | 2.47.7 | 0.19 | … | |
| HD 274561 | 1.70.6 | 2.2 | 0.7 | 1.21.6 | 0.2 | … | 5.24.7 | 0.04 | … | 3.3 |
| HD 36329 | 14.91.2 | 13.6 | 0.9 | 6.12.8 | 1.3 | … | 0.55.0 | 0.25 | … | 0.5 |
| HD 38397 | 23.11.6 | 16.3 | 3.8 | 141.411.1 | 1.6 | 12.6 | 144.717.2 | 0.30 | 8.4 | ccNote that single temperature models do not reproduce WISE 22µm excess (see Sect. 3.3). By adopting an additional warmer component, the two-temperature fit results in a higher total fractional luminosity. |
| CD-52 1363 | 4.20.6 | 3.1 | 1.8 | 4.02.4 | 0.3 | … | 3.48.7 | 0.06 | … | 2.7 |
| HD 48370 | 36.52.5 | 25.6 | 3.8 | 176.614.6 | 2.5 | 12.1 | 220.320.7 | 0.47 | 11.2 | ccNote that single temperature models do not reproduce WISE 22µm excess (see Sect. 3.3). By adopting an additional warmer component, the two-temperature fit results in a higher total fractional luminosity. |
| 156.720.0bbPhotometry from SPIRE/PACS parallel maps. | 7.7 | 216.428.8bbPhotometry from SPIRE/PACS parallel maps. | 7.4 | |||||||
| HD 51797 | 8.20.9 | 6.1 | 2.4 | 6.42.1 | 0.6 | 2.7 | 8.96.2 | 0.11 | … | 1.2 |
| CD-54 4320 | 13.31.1 | 11.0 | 2.0 | 0.82.2 | 1.1 | … | 16.39.6 | 0.21 | … | 1.1 |
| BD-20 951 | 11.71.0 | 10.2 | 1.4 | 12.52.3 | 1.0 | 5.0 | 24.66.2 | 0.19 | 3.9 | |
| BW Phe | 27.21.8 | 24.8 | 1.0 | 6.92.3 | 2.5 | 1.9 | 25.510.3 | 0.47 | … | 0.5 |
| CD-42 2906 | 3.80.7 | 3.1 | 1.0 | 2.72.0 | 0.3 | … | 12.911.6 | 0.06 | … | 2.4 |
| CD-43 3604 | 5.70.8 | 4.6 | 1.3 | 2.22.4 | 0.5 | … | 12.39.9 | 0.09 | … | 2.7 |
| HD 67945 | 10.21.1 | 10.8 | 0.5 | 1.72.8 | 1.1 | … | 2.96.0 | 0.20 | … | 0.4 |
| CD-52 9381 | 11.71.2 | 10.5 | 0.9 | 2.22.0 | 1.1 | … | 1.08.8 | 0.20 | … | 1.3 |
Note. — Col.(1): Target name. Col.(2-10): Measured and predicted flux densities with their uncertainties and the significance of the excesses () in WISE W4 band and in PACS 70 and 160µm bands. The quoted uncertainties include the calibration uncertainties as well. No color correction was applied. and were quoted only those cases where the target was detected in the specific band.
| Instr. | Meas. fluxa | Pred. flux | Reference | |
|---|---|---|---|---|
| (µm) | (mJy) | (mJy) | ||
| 3.35 | WISE | 955.645.8 | 957.1 | Wright et al. (2010) |
| 11.56 | WISE | 91.94.3 | 91.4 | Wright et al. (2010) |
| 22.09 | WISE | 36.52.5 | 25.6 | Wright et al. (2010) |
| 70.00b | PACS | 173.014.0 | 2.5 | this work |
| 160.00 | PACS | 219.419.5 | 0.47 | this work |
| 250.00 | SPIRE | 148.512.1 | 0.19 | this work |
| 350.00 | SPIRE | 103.411.6 | 0.10 | this work |
| 500.00 | SPIRE | 54.510.5 | 0.05 | this work |
| 1250.00 | NIKA | 7.31.5 | 0.007 | this work |
| 2140.00 | NIKA | 2.00.3 | 0.002 | this work |
| Target | (K) | () | (au) | |
|---|---|---|---|---|
| CD-54 7336 | 122 | 0.65 | 2.2 | 4.3 |
| HD 160305 | 435 | 0.65 | 1.20.4 | 5813 |
| HD 35996 | 13517 | 0.65 | 1.00.3 | 62 |
| HD 38397 | 443 | 0.65 | 5.40.7 | 467 |
| BD 48370 | 412 | 0.260.08 | 5.60.2 | 395 |
| BD-20 951 | 335 | 0.65 | 2.20.4 | 5520 |
Note. — Col.(1): Target name. Col.(2): Characteristic disk temperature. Col.(3): Power law index of the emissivity (). Except for HD 48370 the value of was fixed to 0.65. Col.(4): Fractional dust luminosity, . Col.(5): Blackbody radius of the disk.
| Target | Spectral type | Excess? | Excess at 70µm? | Ref. |
|---|---|---|---|---|
| BPMG | ||||
| HIP 10679 | G2V | Y | Y | 6,7 |
| AG Tri | K6Ve | Y | Y | 6,7 |
| BD+05 378 | K6Ve | N | N | 6,7 |
| AO Men | K4Ve | N | N | 6,7 |
| V343 Nor | K0V | N | N | 6,7 |
| V824 Ara | G7IV | N | N | 6 |
| CD-64 1208 | K5Ve | N | N | 6,7 |
| PZ Tel | G9IV | N | N | 6,7 |
| AZ Cap | K6Ve | Y | N | 5 |
| THA | ||||
| HD 105 | G0V | Y | Y | 4 |
| HD 987 | G8V | Y | Y | 8 |
| HD 1466 | F8V | Y | Y | 4 |
| HD 3221 | K4Ve | N | N | 4 |
| HD 8558 | G7V | Y | N | 8 |
| CC Phe | K1V | N | N | 8 |
| DK Cet | G4V | Y | Y | 4 |
| HD 13183aaThe quoted flux densities are not color corrected. | G7V | Y? | N | 8 |
| CD-60 416 | K5Ve | N | N | 8 |
| CD-53 544 | K6Ve | N | N | 8 |
| CD-58 553 | K5Ve | N | N | 8 |
| CD-46 1064aaFor these objects Zuckerman et al. (2011) reported weak excess at 24µm but claimed that the identification of the excesses is uncertain. Therefore in our analysis in Sect. 4.2 we will not consider them as infrared excess stars. | K3Ve | Y? | N | 8 |
| HD 22705 | G2V | Y | N | 8 |
| HD 29615 | G3V | N | N | 8 |
| HIP 84642 | G8V | Y | N | 8 |
| BO Mic | K4Ve | Y | N | 1,5 |
| HD 202917 | G7V | Y | Y | 4 |
| HIP 105404 | G9V | Y | N | 8 |
| HIP 108422 | G9IV | Y | N | 8 |
| HD 222259B | K3Ve | N | N | 8 |
| DS Tuc | G6V | N | N | 8 |
| COL | ||||
| BD-15 705 | K3(e) | N | N | 8 |
| BD+08 742 | G5: | N | N | 2 |
| HD 36869 | G3V | N | N | 8 |
| AT Col | K1Ve | Y | N | 8 |
| V1358 Ori | F9V | Y | N | 1 |
| CAR | ||||
| HIP 30034 | K1V(e) | Y | N | 4,8 |
| HD 49855 | G6V | Y | N | 8 |
| HD 55279 | K2V | N | N | 4 |
| ARG | ||||
| HD 61005 | G8V k | Y | Y | 3 |
| HD 84075 | G1 | Y | Y | 3 |
| CD-74 673 | K3Ve | N | N | 8 |
Note. — Col.(1): Target name. Col.(2): Spectral type. Col.(3): Presence of infrared excess. Col.(4): Presence of infrared excess at 70µm. Col.(5): References for information on IR excess. 1 – Ballering et al. (2013); 2 – Carpenter et al. (2009); 3 – Chen et al. (2014); 4 – Donaldson et al. (2012); 5 – Plavchan et al. (2009); 6 – Rebull et al. (2008); 7 – Riviere-Marichalar et al. (2014); 8 – Zuckerman et al. (2011).