Ultraviolet emission from main-sequence companions of AGB stars
Abstract
Although the majority of known binary Asymptotic Giant Branch (AGB) stars are symbiotic systems (i.e. with a WD as a secondary star), main-sequence companions of AGB stars can be more numerous, even though they are more difficult to find because the primary high luminosity hampers the detection of the companion at visual wavelengths. However, in the ultraviolet the flux emitted by a secondary with K may prevail over that of the primary, and then it can be used to search for candidates to binary AGB stars. In this work, theoretical atmosphere models are used to calculate the UV excess in the GALEX near- and far-UV bands due to a main-sequence companion. After analysing a sample of confirmed binary AGB stars, we propose as a criterium for binarity: (1) the detection of the AGB star in the GALEX far-UV band and/or (2) a GALEX near-UV observed-to-predicted flux ratio . These criteria have been applied to a volume-limited sample of AGB stars within 500 pc of the Sun; 34 out of the sample of 58 AGB stars (60%) fulfill them, implying to have a MS companion of spectral type earlier than K0. The excess in the GALEX near- and far-UV bands cannot be attributed to a single temperature companion star, thus suggesting that the UV emission of the secondary might be absorbed by the extended atmosphere and circumstellar envelope of the primary or that UV emission is produced in accretion flows.
keywords:
stars: agb and post-agb – binaries: general – circumstellar matter – ultraviolet: stars1 Introduction
Binarity has long been suggested as a mechanism to shape bipolar planetary nebulae (PNe) (e.g. Corradi & Schwarz, 1993; Soker, 1998). Observations have confirmed that a significant number of PNe indeed have binary central stars (De Marco et al., 2013). Since binarity precedes the formation of the PN, it is paramount to detect it along previous phases of stellar evolution before the PN formation, particularly at the Asymptotic Giant Branch (AGB) phase. An unbiased comparison among the binarity occurrence rates during the main sequence, AGB and PN phases can help to reinforce a causality relationship between binarity and the formation of aspherical PNe and to assess the evolution of binary systems (e.g. Ivanova et al., 2013; Staff et al., 2016)
Binary or multiple systems including AGB stars have been often observed as symbiotic systems. They are identified by their spectra, which includes features characteristic of the red giant as well as emission lines arising from the wind-driven atmosphere of the giant, which is ionized by the UV photons of the secondary white dwarf (WD). The latest catalogue of symbiotic systems contains about two hundred objects, including confirmed and suspected objects (Belczynski et al., 2000).
The discovery of hot companions of AGB stars is somewhat straightforward where they compose symbiotic systems, but the detection of low- and intermediate-mass main-sequence (hereafter MS) companions is not simple. The detection of the secondary in direct images is difficult because the high brightness contrast between them hampers the detection of the secondary, except in the cases where the components are well resolved (Karovska et al., 1993, 1997; Prieur et al., 2002). Indeed, the recent advent of new generation adaptive optics systems has allowed the detection of late-type, close companions of AGB stars (Beuzit et al., 2008; Fusco et al., 2014), but this method still remains restricted to a few near objects (Kervella et al., 2015). Other methods to detect binary AGB stars include asymmetries in their circumstellar envelopes (Mayer et al., 2013), proper-motion variations (Pourbaix et al., 2003), and the identification of features attributed to the secondary in the visual spectrum (Castelaz & McCollum, 1995; Danilovich et al., 2015).
As a rule, the shorter the wavelength, the higher the relative contribution of the hot component to the spectrum because the flux emitted by an AGB star decreases abruptly beyond 2800 Å. Therefore, UV space observatories (FUSE, GALEX, HST) have greatly increased the possibilities to detect MS companions of AGB stars. Sahai et al. (2008, 2011) have carried out a program in quest of binary AGB stars based on an imaging survey obtained by the GALEX observatory (Galaxy Evolution Explorer, Martin et al., 2005). They selected 25 AGB stars showing M5 or later spectral type classified during the mission as “bright star” and “high-background”, with the additional criterium that they should exhibit the “multiplicity” flag in the catalogue. These were considered as promising conditions to detect companions with spectral type earlier than G0 in the two GALEX photometric bands: far-UV ( Å) and near-UV ( Å). Indeed, UV counterparts were detected in most of the sources and for a significant fraction of them the UV emission seemed to be in excess, i.e. it probably results from a companion undetected at visual wavelengths.
These results have undoubtfully made a major contribution in increasing the number of known binary AGB stars, but these searches have mostly been biased towards the most promising candidates and/or been restricted to symbiotic systems. In this paper we address the problem of detecting MS companions of AGB stars using GALEX UV data. The issues explored in this study will pave the way for future unbiased determinations of the occurrence of binarity among AGB stars. The main scopes of the present paper are: (1) to establish the detection limits of the GALEX survey to detect MS companions of AGB binary stars (Sect. 2 and 3); (2) to derive criteria for selecting binary AGB star candidates, to be eventually confirmed by other techniques, e.g. radial velocity (RV) studies (Sect. 4); and (3) to assess the stellar properties of these companions, mainly their effective temperature (Sect. 5).
2 The detectability of AGB companions with GALEX
The detection of the MS secondary companion of an AGB star depends on the contrast between its flux and that of the primary. The detectability of a MS intermediate or early spectral type companion using UV photometry is feasible because, despite the high luminosity of the primary, its flux bluewards of 2800 Å is usually negligible when compared to the flux emitted by the secondary. For instance, Sahai et al. (2008) estimated a secondary-to-primary GALEX near-UV flux contrast ratio 10 for a MS secondary star with spectral type earlier than G0 (or K).
Besides the flux contrast between the two components, the detectability depends also on the distance to the system as it determines the UV flux. This issue was extensively addressed by Bianchi et al. (2007) for hot objects. Assuming theoretical atmosphere models, they conclude that GALEX could detect all WD in the Galactic halo along their constant-luminosity phase (i.e. WD’s with K and radii down to ) up to a distance of 20 kpc. Concerning GALEX detections of MS stars, Bianchi et al. (2007) focused on objects with K, thus excluding intermediate-mass stars.
GALEX observation strategy was mainly organized into three different modes, namely ais, mis and dis, mostly different by their varying exposure times of 100 s, 1500 s, and 30,000 s, respectively. These modes refer to specific areas in the sky called tiles. Most observations were made in the ais mode to cover large areas in the sky. For each entry the GALEX catalogue111galex.stsci.edu gives, among other information, the magnitude and flux density in the near- and far-UV bands (Morrissey et al., 2005). An analysis of sources registered in different mode tiles shows that there are significant differences in sensitivity among them: sources detected with a signal-to-noise ratio of 5 have fluxes 10 Jy 20 Jy in ais tiles, going down to 5 Jy 10 Jy in mis tiles given their longer integration time.
In order to calculate the limiting distances of MS stars detectable by GALEX, we adopt the MS visual absolute magnitudes given by Cox (2002) and all the theoretical atmosphere models provided by Lejeune et al. (1997) for solar metallicity stars and spectral type later than B2v, i.e. for intermediate-mass stars. The grid of Lejeune et al. (1997) models is equally paced in by 0.5 dex intervals, but unequally in . In all cases the difference between the values given by Cox (2002) and the value of the adopted theoretical model never exceeded 0.2 dex. The relative differences in temperature were 2.3%. Absolute (i.e. at a distance of 10 parsecs) flux densities in the band were calculated by convolving the theoretical spectrum with the filter curve given by Maíz-Apellániz (2006) using equation:
| (1) |
where is the name of the photometric band ( in this case), is the theoretical flux density of the star, and is the filter response curve. is “scaled” in order to match its flux density at Å with the value corresponding to its absolute visual magnitude by Cox (2002). The visual zero-magnitude density flux used in this calibration is also given by Cox (2002): erg s-1cm-2Å-1. Finally, GALEX near- and far-UV flux densities are calculated from this scaled theoretical spectrum using the same Equation 1, but for the near- and far-UV filter curves given by Morrissey et al. (2005).
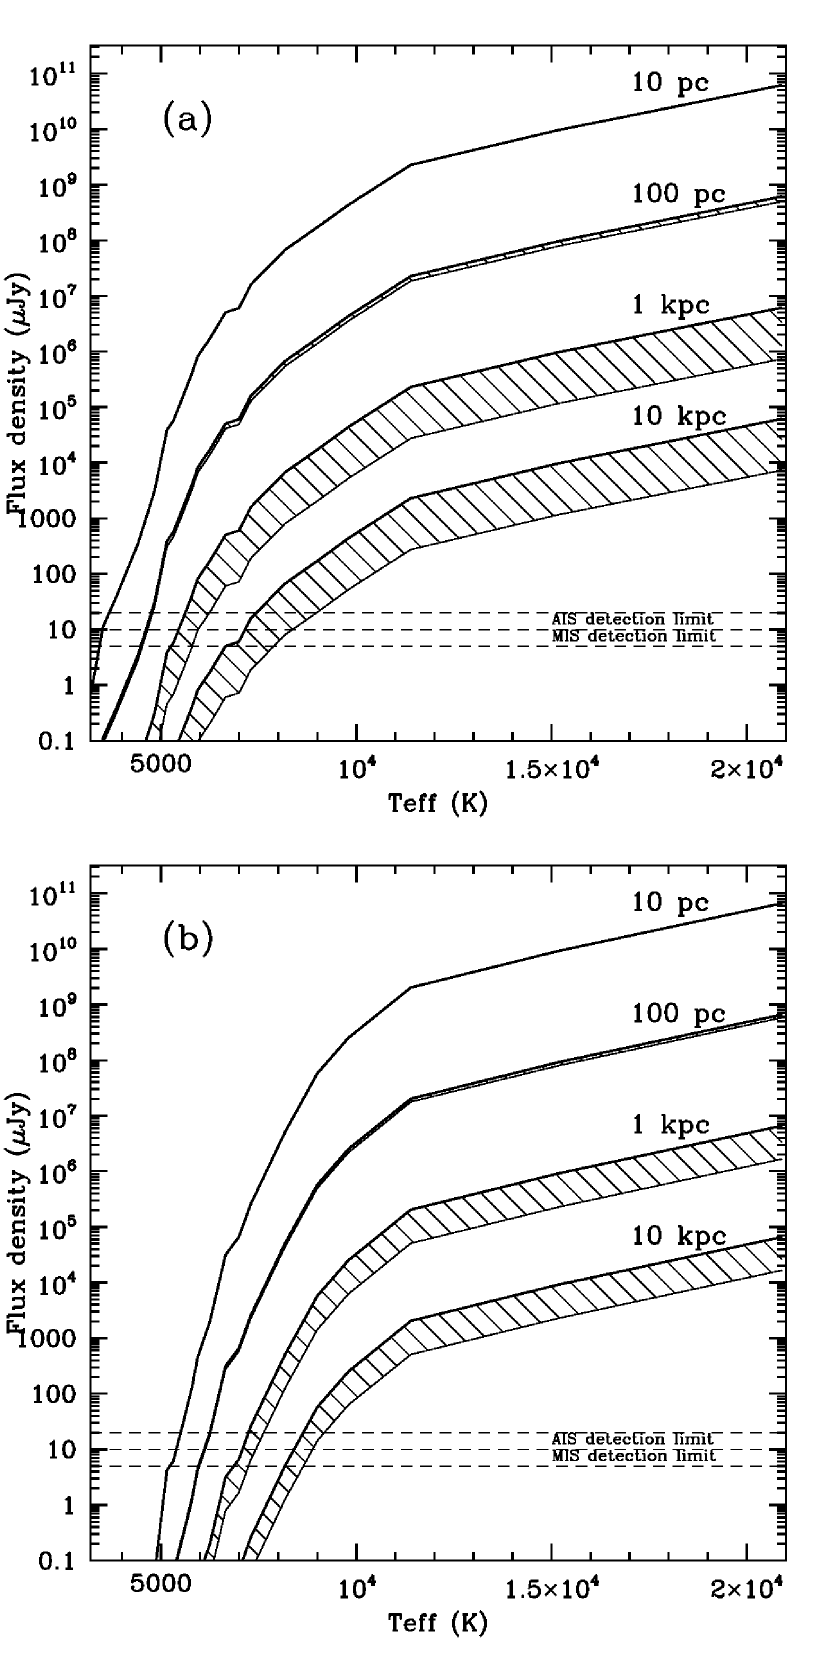
Figure 1 shows the flux density of MS stars in the near- and far-UV bands as a function of the stellar effective temperature for distances in the range from 10 pc up to 10 kpc. The interstellar extinction decreases the detection radius of the GALEX survey. To calculate this effect, we derive the extinction in the band (X=FUV, NUV) as follows:
| (2) |
where is the colour excess in the direction of the star (extracted from the GALEX catalogue), and is the extinction coefficient in the X band. The behaviour of the interstellar extinction coefficients was exhaustively studied by Yuan et al. (2013) who analysed thousands of stars detected by GALEX (and other surveys) in several directions in the Galaxy. In the present study we adopt an UV extinction law that corresponds to the average total-to-selective coefficient determined by Yuan et al. (2013): and . Therefore the extinction-corrected ultraviolet flux density can be calculated from Equation 2 and the corresponding extinction coefficients:
| (3) |
where is the observed flux density in the near- and far-UV bands. Equation 3 was applied to the theoretical flux densities shown in Fig. 1 to simulate the effect of the interstellar extinction on near- and far-UV flux densities. Because the extinction varies from source to source depending on their distance and line of sight through the Galaxy, we simulate various values of in Figure 1 from mag for sources at pc to mag for kpc (which corresponds to an average local extinction of 1 mag kpc-1, Ortiz & Lépine, 1993; Marshall et al., 2006; Froebrich et al., 2010). The results are shown in the same Fig. 1, where we applied mag to the 100 pc and mag to the 1 and 10 kpc curves. Assuming , the near-UV (far-UV) flux densities would decrease by 19% and 88% (13% and 75%) for mag and mag, respectively. Although a realistic estimation of the extinction should take into account the distance and the Galactic coordinates of the object, this simulation allows us to estimate the detection limits of MS stars with GALEX. MS stars with K (spectral type G6 or earlier) could be detected in the near-UV band up to a distance of kpc in ais tiles. Contrary to naive expectations, only hotter stars with K (spectral type F2 or earlier, i.e. mainly MS stars of spectral types O, B and A) could be detected in the far-UV band due to its lower sensitivity. The latter stars are less frequently companions of AGB stars because of the steep slope of the initial-mass function.
3 The method for estimating the near-ultraviolet excess of AGB stars
The method used here for estimating the UV excess of AGB stars has much in common with that proposed by Sahai et al. (2008), and has been partially described in Sect. 2.
Firstly, and magnitudes taken from The Guide Star Catalogue, GSC2.3 (Lasker et al., 2008) and/or HIPPARCOS (ESA, 1997; van Leeuwen, 2007), and , and (2MASS, Skrutskie et al., 2006) magnitudes are corrected for interstellar extinction using the values listed in the GALEX catalogue. The standard values of and of 0.26, 0.15 and 0.09 for the , and bands, respectively, are adopted (Koornneef, 1983; Yuan et al., 2013). Since mag in most cases, the assumption of an alternative reddening law would not change the results significantly.
Secondly, the extinction-corrected flux densities corresponding to these five photometric bands are calculated using Equation 1. These are then fitted with the least-squared method to the theoretical spectral library by Lejeune et al. (1997) assuming [Fe/H]=0. No photometric bands redwards of are considered in these fits because AGB stars may have circumstellar dust envelopes that produce an infrared excess in this spectral region. The average magnitude residuals considering the 5 bands is typically less than 0.2 mag, which is considerably smaller than the amplitude of variability of the stars.
Once the best-fit spectrum has been found, its flux density in the GALEX near-UV and far-UV bands is calculated using Equation 1. This latter step deserves a warning. Since the AGB stellar spectrum in this spectral region is very steep and the GALEX photometric bands are broad, the flux densities and obtained by convolving the theoretical spectrum with the filter curve are dominated by the stellar contribution on the longest wavelength side of the band. As a result, the flux densities differ notably, about two orders of magnitude, from the value of the flux at the effective wavelength and , respectively.
Finally, the ratios and of the extinction-corrected (using equation 3) GALEX and to the predicted and are computed.
4 Results
In this Section we describe the results of the application of this method to various samples of AGB stars. Firstly, we test it with the same stars analysed by Sahai et al. (2008, 2011, Sect. 4.1); second, a sample of confirmed binary stars discovered using kinematical criteria is studied (Sect. 4.2); finally, the method is applied to a volume-limited sample of nearby ( kpc) AGB stars (Sect. 4.3).
| Name | D | galex- | galex- | predicted- | |||||
|---|---|---|---|---|---|---|---|---|---|
| (pc) | (K) | (mJy) | (mJy) | (mJy) | |||||
| RW Boo | 293 | 2800 | 0.015 | 0.0277 | 0.4300.519 | 0.0883 | 4.95.9 | ||
| AA Cam | 781 | 3350 | 0.044 | 0.0169 | 0.2940.374 | 0.0664 | 4.45.6 | ||
| V Eri | 439 | 2800 | 0.040 | 0.0711 | 0.182 | 0.0523 | 3.5 | ||
| R UMa | 415 | 3500 | 0.025 | 0.0456 | 0.141 | 0.0448 | 3.2 | ||
| Y Gem | 769 | 2800 | 0.051 | 0.0491 | (0.46.4) | 38.7230.2 | |||
| Ceti | 92 | 3000 | 0.027 | 0.434 | (0.75.5) | 4.7100.8 |
4.1 Ultraviolet excess of M-type AGB stars (Sahai et al. 2008, 2011)
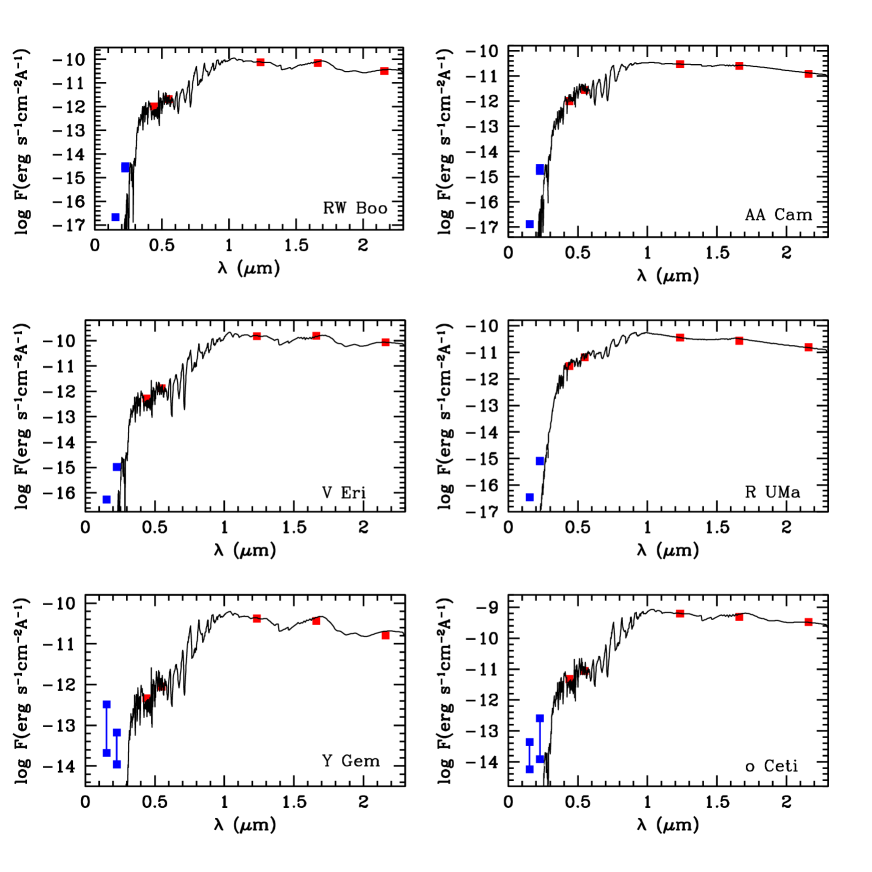
Sahai et al. (2008, 2011) analysed the UV excess of 6 M-type AGB stars in quest of companions. We have applied our method to the sample in those references and show the results in Table 1. The range of observed for this small sample corresponds to spectral types between M4M8 (Fluks et al., 1994), whereas the interval determined by Sahai et al. (2008, 2011) spans from M3M9. Table 2 of Lejeune et al. (1997) lists as a function of the effective temperature for a sequence of cool giants. An interpolation of that set of values gives for K, for K, for K, and for K. The differences between these values and those determined in Table 1 does not exceed 1.1 dex. Figure 2 illustrates the photometric data and the best-fit spectra. In the cases where multiple measurements of flux were taken at different epochs, the maximum and minimum values are plotted. The average residual between the best-fit model and the observed BVJHKs magnitudes is smaller than 0.11 magnitude for the 6 stars studied.
All stars were detected both in the near- and far-UV bands. In those cases when multiple measurements are available, the UV fluxes varied up to one order of magnitude. Four stars (RW Boo, AA Cam, V Eri and R UMa) have . Y Gem and Cet show much higher near-UV excess, up to . Variability certainly accounts for at least a part of the near-UV excess observed in these stars. Celis (1986) monitored a sample of Mira- and SR-type variables in the UBVRI system and observed variations of over 3 magnitudes (a factor 16 in flux) in the band.
The predicted far-UV flux density is lower than Jy for all the stars in the sample, which corresponds to an excess of , similar to the figure determined by Sahai et al. (2008). The stars that show the larger near-UV excesses also show the larger values, even though the excess in the far-UV is several order of magnitude larger than in the near-UV. The far-UV excess observed in all the objects of the sample indicates that they all must have an additional source of UV photons such as an intermediate-mass MS star. The high values of reinforce this conclusion.
| Name | D | galex- | galex- | predicted- | |||||
|---|---|---|---|---|---|---|---|---|---|
| (pc) | (K) | (Jy) | (Jy) | (Jy) | |||||
| hip50801 | 76 | 3750 | 0.00 | 0.013 | 732.6 | 9535.9 | 253.0 | 37.7 | |
| hip58545 | 251 | 3500 | 3.00 | 0.069 | 105.8 | 1322.81483.8 | 127.8 | 10.511.6 | |
| hip60998 | 178 | 3500 | 3.00 | 0.022 | … | 7441.1 | 300.9 | … | 24.7 |
| hip62355 | 490 | 3500 | 0.50 | 0.010 | 665.6 | 1403.9 | 7.0 | 200.1 | |
| hip72208 | 279 | 3350 | 0.021 | 5419.56155.0 | 6833.610,818.5 | 290.4 | (8.79.9) | 23.537.3 | |
| hip73199 | 122 | 3500 | 0.00 | 0.023 | 1991.32126.9 | 7552.49110.4 | 114.8 | 65.879.3 | |
| hip74253 | 532 | 3750 | 0.00 | 0.041 | 23.638.3 | 604.2632.0 | 7.5 | (1.22.0) | 80.684.3 |
| hip81497 | 115 | 3750 | 1.50 | 0.022 | 100.4150.5 | 7626.88666.0 | 221.5 | (4.26.3) | 34.439.1 |
| hip84345 | 117 | 3350 | 0.120 | 21,917.3 | 111,481.9 | 4270.3 | 26.1 | ||
| hip88563 | 275 | 3750 | 0.00 | 0.114 | 38.343.0 | 800.4856.6 | 9.6 | (1.51.7) | 83.489.2 |
| hip97372 | 377 | 3750 | 0.50 | 0.106 | 97.2112.6 | 1820.62020.1 | 26.5 | (0.91.1) | 68.776.2 |
| hip110346 | 243 | 3500 | 0.50 | 0.083 | 91.1 | 1799.6 | 26.2 | 68.7 |
4.2 Ultraviolet emission of a sample of confirmed binary AGB stars
Radial velocity monitoring of spectroscopic binaries is a widely used technique to derive their orbital parameters. Famaey et al. (2009) comment that only 1.1% of the stars in the Ninth Catalogue of Spectroscopic Binary Orbits (Pourbaix et al., 2004) are M-type giants. Indeed, most of the binary systems known to contain a red giant are symbiotic, whereas systems with a non-degenerate companion are scarce. Famaey et al. (2009) used a series of radial velocity measurements obtained with the coravel spectrovelocimeter (Baranne et al., 1979) to determine the binarity status of a number of stars. Binarity was flagged as ORB when the set of kinematic measurements allowed the determination of the orbit, ORB: when the orbit was poorly determined, SB when binarity was confirmed spectroscopically, but no orbit could be computed from the data, SB? when the binarity is only suspected, and NON-SB when binarity is discarded.
Our sample of confirmed binary AGB stars was extracted from the work by Famaey et al. (2009), with the following main additional criteria: (a) the star should be classified as ORB, ORB: or SB; (b) concerning variability, the star must be classified as Mira (a long-period variable or LPV), SR- (semi-regular) or L-type (slow irregular variable). The former criterium is devised to select confirmed AGB binaries and the latter intends to discard M-stars belonging to the RGB phase. We also added some objects (hd62898, hd108907, hd130144, hd150450, hd156014 and hd187372) that are associated with X-ray ROSAT sources, as suggested by Hunsch et al. (1998). Stars with large X-ray offsets were not included because of their doubtful association. Finally, symbiotic systems, which do not represent the main scope of this paper, have been also rejected. Two stars (hd16058 and hd42995) were not surveyed by GALEX. Our final list, as shown in Table 2, contains 12 confirmed binary stars. Their properties were obtained similarly as those of the sample analysed in Sect. 4.1.
Table 2 shows that the discrepancy between the GALEX measured and predicted persists, but on average is higher than in the sample analysed in Sect. 4.1. Except in the case of hip58545 (hd104216 = FR Cam), is generally comparable to the highest values in Sahai’s sample, (Y Gem and Ceti), i.e. . Two general properties can be derived from this sample of confirmed AGB stars: (except in the case of FR Cam) and the detection of a far-UV counterpart (except hip60998 = hd108907 = 4 Dra).
4.3 Ultraviolet emission of nearby AGB stars
After having tested the method proposed by Sahai et al. (2008) to investigate the UV excess associated with confirmed binary AGB stars, we extend it to a volume-limited sample of AGB stars.
There are different lists of nearby AGB stars in the literature that could be used to assamble a volume-limited sample of AGB stars (Sivagnanam et al., 1988; Groenewegen et al., 1992; Jura, 1994; Ortiz & Maciel, 1996). However, all these “old” lists suffer from large uncertainties in the determination of the stellar distances (van Langevelde, H.J. et al., 1990; Lépine et al., 1995; Glass et al., 1995; Groenewegen & Whitelock, 1996). This limitation has been overcome with the advent of HIPPARCOS, which allowed the determination of visual photometry, position, proper motion and annual parallax with accuracy starting at mas (milli-arcsec) for magnitudes up to mas near the limiting magnitude of the survey (Perryman et al., 1997). Thus, since increases with the apparent magnitude and decreases with the distance, the relative uncertainty for a star generally increases with its distance.
Red giant stars were selected from the list of HIPPARCOS sources classified by Ita et al. (2010) as M-, C-, S- and OH/IR stars. In order to remove RGB stars from that list, we selected only stars with luminosity higher than the tip of the RGB (, Salaris & Cassisi, 1997) obtained by McDonald et al. (2012). About 95% of the AGB stars within 500 pc selected according to this criterium have apparent visual magnitudes , and consequently . Beyond this distance, the distance uncertainties based on HIPPARCOS data are larger than those reported by other formerly proposed distance scales. Therefore, the volume-limited sample of AGB stars in the solar neighbourhood studied in this paper is limited to a distance of 500 pc.
After applying the above criteria, the sample is reduced to 90 AGB stars, from which we additionally discarded those that (1) are classified in the literature as symbiotic (1 object, R Aqr = hip117054), (2) were not observed by GALEX (31 objects), and (3) were not detected by GALEX (5 objects). Our final sample consists of 53 AGB stars of various types within 500 pc, with GALEX counterparts and (Table 3). According to Figure 1, the limiting temperatures for the detection of MS stars at a distance of 500 pc in GALEX data would be K for the near-UV and K, for the far-UV.
| Name | D | galex- | galex- | predicted- | |||||
| (pc) | (K) | (Jy) | (Jy) | (Jy) | |||||
| C-stars: | |||||||||
| hip5914 | 385 | 3500 | 0.00 | 0.110 | … | 50.1155.5 | 15.1 | … | 3.310.3 |
| hip14930 | 322 | 3500 | 0.00 | 0.022 | 28.436.1 | 299.9848.0 | 27.7 | (5.77.3) | 10.830.6 |
| hip43811 | 342 | 3350 | 0.023 | 7.8 | 8.4 | 112.4 | 0.1 | ||
| hip52009 | 208 | 3500 | 0.00 | 0.051 | 6.1 | 221.6 | 61.9 | 3.6 | |
| hip52577 | 380 | 3500 | 0.00 | 0.016 | 7.010.4 | 93.8260.5 | 21.0 | (1.92.8) | 4.512.4 |
| hip62223 | 321 | 3350 | 0.023 | … | 7.49.3 | 191.8 | … | 0.040.05 | |
| hip63152 | 431 | 3350 | 0.033 | … | 2.8 | 65.8 | … | 0.04 | |
| hip91703 | 358 | 3200 | 0.28 | 0.224 | … | 78.3 | 108.9 | … | 0.7 |
| hip95154 | 386 | 3500 | 0.00 | 0.094 | … | 49.9 | 20.9 | … | 2.4 |
| hip117245 | 275 | 3500 | 0.00 | 0.056 | 10.7 | 331.8 | 43.2 | 7.7 | |
| M-stars: | |||||||||
| hip1236 | 337 | 3000 | 0.60 | 0.015 | … | 30.637.6 | 119.5 | … | 0.3 |
| hip2086 | 483 | 3500 | 3.00 | 0.023 | 40.9 | 969.3 | 114.0 | 8.5 | |
| hip9234 | 174 | 2500 | 0.28 | 0.117 | … | 137.2150.7 | 191.8 | … | 0.70.8 |
| hip13384 | 368 | 3350 | 0.28 | 0.048 | 33.234.0 | 524.4665.2 | 153.9 | 3.44.3 | |
| hip17881 | 260 | 3200 | 0.28 | 0.151 | 47.7 | 888.91665.4 | 336.3 | 2.65.0 | |
| hip20075 | 463 | 3500 | 1.50 | 0.046 | 96.1 | 1863.1 | 76.6 | 24.3 | |
| hip26169 | 333 | 3500 | 3.00 | 0.122 | 125.6159.8 | 2846.33181.3 | 256.0 | (1.62.0) | 11.112.4 |
| hip28041 | 437 | 2800 | 0.60 | 1.112 | … | 62931.8 | 381.5 | … | 164.9 |
| hip28874 | 203 | 3200 | 0.28 | 0.038 | 65.9 | 482.2 | 298.3 | 1.6 | |
| hip38792 | 341 | 4500 | 3.00 | 1.022 | … | … | 49.6 | ||
| hip41028 | 450 | 2800 | 0.60 | 0.038 | 13.116.1 | 92.994.4 | 62.2 | (1.62.0) | 1.5 |
| hip53809 | 261 | 2500 | 0.050 | … | 51.853.3 | 66.6 | … | 0.8 | |
| hip53940 | 448 | 3500 | 2.00 | 0.138 | 97.3 | 1944.6 | 105.8 | 18.4 | |
| hip57607 | 242 | 3200 | 0.113 | … | 893.2894.5 | 317.7 | … | 2.8 | |
| hip58225 | 356 | 3200 | 0.60 | 0.028 | 4.0 | 248.3288.0 | 165.8 | 1.51.7 | |
| hip62611 | 405 | 3500 | 1.50 | 0.060 | 55.8 | 692.0 | 51.9 | 13.3 | |
| hip64569 | 143 | 3000 | -0.70 | 0.034 | … | 86.9 | 208.9 | … | 0.4 |
| hip72208 | 279 | 3350 | 0.021 | 5419.56155.0 | 6833.610,818.5 | 290.4 | (8.79.9) | 23.537.3 | |
| hip73213 | 403 | 3200 | 0.60 | 0.076 | … | 335.9 | 248.8 | … | 1.4 |
| hip76075 | 305 | 3500 | 2.00 | 0.189 | 90.6 | 1518.31646.2 | 140.2 | 10.811.7 | |
| hip80488 | 235 | 3000 | 0.059 | … | 58.2 | 102.7 | … | 0.6 | |
| hip80704 | 109 | 3200 | 0.60 | 0.009 | 46.3 | 3097.7 | 1878.4 | 1.6 | |
| hip98438 | 312 | 3750 | 3.00 | 0.368 | … | 26,058.7 | 1093.0 | … | 23.8 |
| hip98608 | 146 | 3350 | 0.87 | 0.048 | 395.8 | 4423.3 | 927.5 | 4.8 | |
| hip99082 | 197 | 2500 | 0.109 | … | 84.8101.2 | 126.1 | … | 0.70.8 | |
| hip99920 | 318 | 3500 | 2.00 | 0.072 | 147.3 | 7618.4 | 117.5 | 64.8 | |
| hip100935 | 211 | 3000 | 0.071 | … | 154.4492.0 | 216.1 | … | 0.72.3 | |
| hip102978 | 258 | 4000 | 0.50 | 0.083 | … | 9676.39958.0 | 181.4 | … | 53.354.9 |
| hip104451 | 188 | 3200 | 0.28 | 0.523 | … | 6038.525519.0 | 1405.7 | … | 4.318.2 |
| hip106642 | 175 | 3500 | 2.50 | 0.556 | … | 55,342.9 | 1214.7 | … | 45.6 |
| hip110428 | 250 | 3000 | 0.157 | … | 101.1 | 90.2 | … | 1.1 | |
| hip110736 | 446 | 2500 | 0.012 | … | 33.4731.7 | 15.7 | … | 2.146.8 | |
| hip114917 | 472 | 3000 | 0.60 | 0.035 | … | 121.4 | 156.1 | … | 0.8 |
| OH/IR stars: | |||||||||
| hip47886 | 347 | 2800 | 0.015 | 2.5 | 18.565.5 | 31.6 | 0.62.1 | ||
| S-stars: | |||||||||
| hip1728 | 270 | 3350 | 0.60 | 0.024 | 24.1 | 1488.4 | 464.1 | 3.2 | |
| hip1901 | 386 | 2500 | 0.091 | … | 50.1 | 12.5 | … | 4.0 | |
| hip10687 | 448 | 3000 | 0.28 | 0.091 | … | 13.927.3 | 88.6 | … | 0.20.3 |
| hip19853 | 450 | 3500 | 1.00 | 0.405 | … | 1210.31416.0 | 46.2 | … | 26.230.6 |
| hip22667 | 200 | 3750 | 3.00 | 0.505 | 13,420.7 | 83,351.5 | 2236.7 | 37.3 | |
| hip36288 | 253 | 3000 | 0.60 | 0.094 | 9.0 | 301.3440.4 | 273.7 | 1.11.6 | |
| hip45058 | 143 | 2800 | 0.28 | 0.021 | 8.0 | 393.9 | 717.5 | 0.5 | |
| hip77619 | 293 | 3200 | 0.021 | 39.947.8 | 341.1412.0 | 111.0 | 3.13.7 | ||
| hip113131 | 418 | 3500 | 3.00 | 0.091 | 42.4 | 1113.6 | 158.4 | 7.0 | |
The near-UV excess of the sample, expressed as , spans over a wide range, from 0.1 to 165. Over 70% of the stars show low near-UV excess, , and only 12 stars (23%) show near-UV excess similar to confirmed binary AGB stars, i.e. . Another significant statistical differences between this sample and that of confirmed AGB binaries are that only 50% of the volume-limited sample (27 out of 53 stars) have a far-UV counterpart, while spans over a wider range of values, from to .
4.4 Temperature of the companions of AGB stars
The UV excess observed in AGB stars can be used to assess the properties of their putative companions, such as the temperature. Assuming that the secondary component is a MS star, there is a close relationship between its intrinsic flux and the effective temperature. In this Section we obtain the temperature of the companion star using two methods: (1) the near-UV and the far-UV flux in excess of the AGB star and (2) the near-to-far UV excess flux ratio.
Once the distance to the the star is known, the UV flux density that would be emitted by a MS companion star is calculated using the method described in Sect. 3. Thus, the secondary’s flux density is calculated as the difference between the observed GALEX and the predicted (theoretical) flux density, listed in Tables 1, 2 and 3. The temperature of the secondary star is given by the intersection of the horizontal line corresponding to the source’s UV excess and the flux-density curve corresponding to the distance of the star in the versus diagram (Fig. 1). The method is carried out separately in the near- and far-UV GALEX bands.
The second method is based on the excess ratio. This quantity is compared with the prediction of a theoretical model of MS stars, as discussed in Sect. 2, being thus similar to the temperature commonly determined from colour indices.
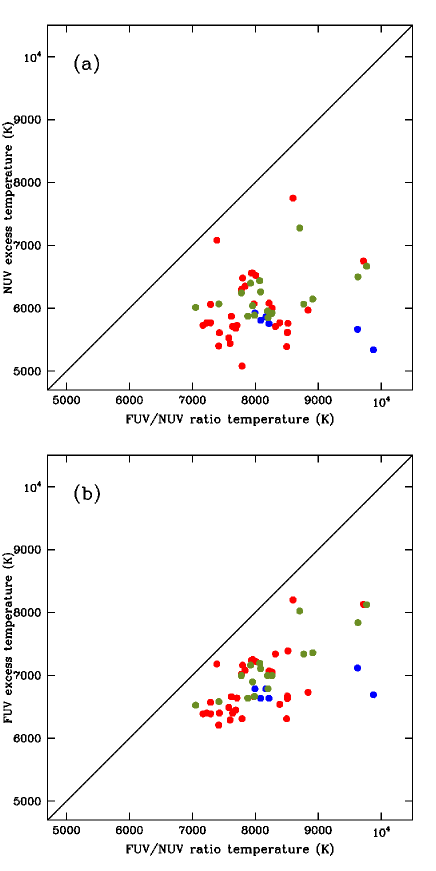
Table 4 lists the temperature of the AGB companions obtained with the two methods described above. In general, we observe the following inequality: (see also Fig. 3). This discrepancy suggests that the UV excess cannot be ascribed to a single stellar spectrum.
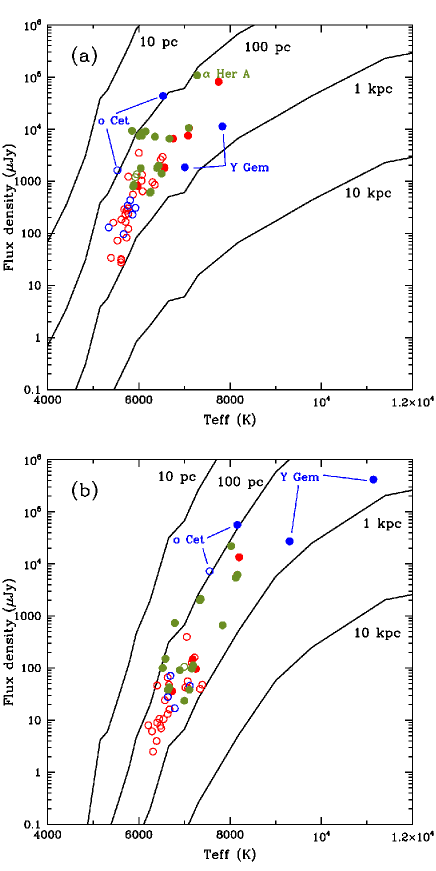
Figure 4 shows the temperature of the secondary members of the three samples obtained with the first method, using the near- and far-UV excesses. The reduced number of stars closer than 100 parsecs (only Ceti and hd89758 = UMa) is a natural limitation caused by the relative low density of AGB stars in the solar neighbourhood. On the other hand, the relative larger number of objects near the distance upper limit of 500 pc results from the fact that, assuming a constant density of stars, the number of objects at a distance increases with . On average, temperatures obtained from the far-UV excess flux are higher than those determined from the near-UV band. There is also a selective distribution of temperatures when the three distinct samples are compared, but this is mostly due to selection effects. The sample studied by Sahai et al. (2008, 2011) and Famaey et al. (2009) are biased towards UV bright objects, whilst that described in Sect. 4.3 is a distance-limited sample.
Sahai et al. (2008, 2011) used the second method to determine the temperature of the secondary, i.e. based on the near-to-far UV flux density ratio and atmosphere models by Castelli & Kurucz (2003). Table 4 shows a good agreement between their results and ours. For instance, Y Gem has one of the highest ratio and Sahai et al. (2011) argue that its companion might have a blackbody temperature as high as 38,000 K, which is beyond the spectral range considered in our study, restricted to intermediate-mass MS stars. Our results, obtained with the same method, confirms this conclusion. We note that some UV sources are associated with X-ray sources, but no clear relationship seems to exist among them, neither with the amount of far-UV excess, and/or the temperature of the secondary.
5 Discussion
5.1 The effect of variability
One of the major concerns when fitting photometric or spectroscopic data of AGB stars is their variability. This effect acts differently along the spectrum, changing its shape as pulsation changes the stellar temperature. As commented in Sect. 4.1, Mira- and SR-type variables often show a peak-to-peak variation of magnitudes (a factor in flux) in the band (Celis, 1986). The majority of the galex measurements were taken only once or twice, which is clearly insufficient to sample the whole range of the UV fluxes along the cycle. Therefore, in the cases where one or just a few multiple photometric measurements of a given source were taken, the actual amplitude of variability might be larger than the measured interval of fluxes.
The majority of the confirmed binaries listed in Table 2 show a variation in flux of 10-20%, whereas other systems, like Ceti and Y Gem for example, show relative flux variations over one order of magnitude. This suggests that the variability of the primary might affect the UV flux emitted by its companion. This effect is more evident in the far-UV band, where the predicted flux of the primary is over 5 orders of magnitude smaller than the values detected by galex. Therefore, besides the intrinsic variability of the primary’s atmosphere, other effects might play a role in the large UV amplitude observed in some binary AGB stars. For instance, it is well known that some AGB stars may exhibit large circumstellar dust envelopes (CDE) that can extend up to 1000 stellar radii. The extended atmosphere of the AGB star and its CDE may block part of the UV radiation emitted by the companion. An accurate estimate of this effect depends on various factors, most of them poorly known, such as the orbital parameters of the system, including the inclination angle, the extinction law of the dust (which depends on the chemical composition), the density law, and the opacity of the CDE. Figure 4 shows that the variation of 1.3 dex in the near-UV flux of Ceti causes a change of 1000 K in the determination of its temperature. The effect on the far-UV band is even more important: the variation of 1.2 dex in flux of Y Gem modifies its temperature by 1800 K.
Another possiblity would be the UV emission produced by an accretion flow onto the secondary or an accretion disk around it. This would produce stochastic or orbital-locked variations in the UV flux (Sahai et al., 2015).
| Name | HIPPARCOS | Far-UV | Comments | ||||
| (K) | (K) | (K) | (Y/N) | ||||
| Table 1: | |||||||
| RW Boo | hip71802 | 57605810 | 6640 | 80908220 | Y | 4.95.9 | companion: K and |
| AA Cam | hip35045 | 58605930 | 6790 | 80008170 | Y | 4.45.6 | companion: Kp |
| V Eri | hip19004 | 5340 | 6690 | 9880 | Y | 3.5 | companion: Kp |
| R UMa | hip52546 | 5670 | 7120 | 9630 | Y | 3.2 | companion: Kp |
| Y Gem | hip37438 | 70107830 | 931011,140 | Y | 38.7230.2 | companion: Kq | |
| Cet | hip10826 | 55306530 | 75508160 | Y | 4.7100.8 | symbiotic, WD secondaryo | |
| Table 2: | |||||||
| UMa | hip50801 | 5850 | 6790 | 8200 | Y | 37.7 | spectroscopic binaryj |
| FR Cam | hip58545 | 59205960 | 7000 | 82008270 | Y | 10.511.6 | spectroscopic binaryj |
| 4 Dra | hip60998 | 6350 | N | 24.7 | hot compact companionj | ||
| BY CVn | hip62355 | 6500 | 7840 | 9630 | Y | 200.1 | spectroscopic binaryj |
| EK Boo | hip72208 | 66707090 | 81308160 | 977014,870 | Y | 23.537.3 | X-ray sourcer |
| RR UMi | hip73199 | 60706150 | 73407360 | 87708910 | Y | 65.879.3 | X-ray sourcer |
| FF Boo | hip74253 | 62506260 | 70007110 | 77808090 | Y | 80.684.3 | spectroscopic binaryj |
| 42 Her | hip81497 | 60106070 | 65206580 | 70537420 | Y | 34.439.1 | X-ray sourcer |
| Her A | hip84345 | 7280 | 8020 | 8710 | Y | 26.1 | Her B (G5iii+A9iv-v) at 4.7″s |
| V980 Her | hip88563 | 5890 | 6670 | 7990 | Y | 83.489.2 | non-symbioticj |
| HR7547 | hip97372 | 64006440 | 71607190 | 79308070 | Y | 68.776.2 | X-ray sourcer |
| PT Peg | hip110346 | 6040 | 6900 | 7960 | Y | 68.7 | non-symbioticj |
| Table 3: | |||||||
| T Cet | hip1728 | 6060 | 6570 | 7290 | Y | 3.2 | upper limit on UV excessa,b |
| hd2268 | hip2086 | 6350 | 7080 | 7840 | Y | 8.5 | |
| RR Eri | hip13384 | 59105980 | 68206830 | Y | 3.44.3 | ||
| TW Hor | hip14930 | 57305970 | 66406730 | 77108840 | Y | 10.830.6 | binaryc, with no obvious bow shockd |
| SS Cep | hip17881 | 58706070 | 6660 | 76207980 | Y | 2.65.0 | |
| V1139 Tau | hip19853 | 63806440 | … | … | N | 26.230.6 | undetected HIPPARCOS binarym |
| GZ Eri | hip20075 | 6560 | 7250 | 7960 | Y | 24.3 | |
| Ori | hip22667 | 7750 | 8200 | 8600 | Y | 37.3 | spec. binary with WD companione |
| WX Men | hip26169 | 64806520 | 71607220 | 78008010 | Y | 11.112.4 | unresolved HIPPARCOS “Problem star”m |
| U Ori | hip28041 | 8690 | … | … | N | 164.9 | jet observed at 43 GHz SiO f |
| S Lep | hip28874 | 5620 | 6630 | 8510 | Y | 1.6 | binary candidateg |
| Y Lyn | hip36288 | 56105710 | 6400 | 74307640 | Y | 1.11.6 | binaryd,h,i |
| PX Pup | hip38792 | 8530 | … | … | N | 49.6 | |
| Z Cnc | hip41028 | 5610 | 66306670 | 85108640 | Y | 1.5 | |
| X Cnc | hip43811 | 4980 | 6470 | 14,030 | Y | 0.1 | suspected binaryj |
| RS Cnc | hip45058 | 5400 | 6210 | 7420 | Y | 0.5 | asymmetric CSEk |
| R LMi | hip47886 | 50805390 | 6310 | 77908500 | Y | 0.62.1 | jet observed at 43 GHz SiO f |
| U Hya | hip52009 | 5440 | 6290 | 7600 | Y | 3.6 | UV emission from a detached shelll |
| VY UMa | hip52577 | 55305770 | 64906540 | 75808390 | Y | 4.512.4 | binaryc,d |
| V361 Vel | hip53940 | 6560 | 7240 | 7940 | Y | 18.4 | |
| Z UMa | hip58225 | 57305770 | 6390 | 71707290 | Y | 1.51.7 | |
| SV Crv | hip62611 | 6080 | 7070 | 8220 | Y | 13.3 | unresolved HIPPARCOS “Problem star”m |
| EK Boo | hip72208 | 67507100 | 81308160 | 972012040 | Y | 23.537.3 | double star, separation 0.2″o |
| GG Lib | hip76075 | 61706200 | 7050 | Y | 10.811.7 | ||
| ST Her | hip77619 | 57105760 | 73407390 | 83208520 | Y | 3.13.7 | unresolved HIPPARCOS “Problem star”m |
| g Her | hip80704 | 5770 | 6400 | 7230 | Y | 1.6 | unresolved HIPPARCOS “Problem star”m |
| 13 Sge | hip98438 | 7590 | … | … | N | 23.8 | double star, separation 23″113″o |
| NU Pav | hip98608 | 6000 | 7050 | 8270 | Y | 4.8 | |
| V4434 Sgr | hip99920 | 7080 | 7180 | 7390 | Y | 64.8 | double star, separation 30″46″o |
| Cap | hip102978 | 70207030 | … | … | N | 53.354.9 | |
| W Cyg | hip106642 | 7340 | … | … | N | 45.6 | HIPPARCOS suspected doublen |
| S Gru | hip110736 | 53506180 | … | … | N | 2.146.8 | |
| HR Peg | hip113131 | 6300 | 7020 | 7780 | Y | 7.0 | unresolved HIPPARCOS “Problem star”m |
| 19 Psc | hip117245 | 5680 | 6450 | 7690 | Y | 7.7 | unresolved HIPPARCOS “Problem star”m |
5.2 A criterium for binarity
One of the objectives of this paper is to define a procedure for selecting potential binary candidates. Table 2 lists 12 confirmed binary AGB stars, discovered after the monitoring of their radial velocities (Famaey et al., 2009). All of them have been detected in the near-UV and all of them, but hd108907, have also a far-UV counterpart. This is especially significant because whilst varies between , the excess in the far-UV band is much larger, . This means that, as the near-UV flux has relative contributions of the primary and the secondary, the far-UV flux is originated mostly in the secondary. Therefore it can be proposed that the detection of an AGB star in the GALEX far-UV band is probe of binarity.
A second criterium to select binary AGB candidates is the near-UV excess, expressed as . Although disentangling the various effects that contribute for the flux variability (and as a consequence ) would require a modelization of each individual binary system, it is possible to establish a general statistical criterium for the majority of the objects. A -band amplitude of 3 mag (a factor 16 in flux) has been observed in the light curve of several types of variable AGB stars (Celis, 1986), which suggests that near-UV excesses in the approximate interval can be partially explained by the AGB variability. Accounting for this intrinsic AGB variability, we propose as an additional criterium for selecting binary AGB candidates. The lower limit of this quotient is uncertain, and in any case binarity should be confirmed only after a careful monitoring of the radial velocity.
The assumption of far-UV detection and/or as a general criterium to select binary AGB stars would select the following AGB stars of this study as binaries: all the objects studied by Sahai et al. (2008, 2011) shown in Table 1; all the AGB stars selected from Famaey et al. (2009) listed in Table 2; 34 objects among the 53 listed in Table 3. These are all listed in Table 4, as well as the , and companion temperatures determined with the methods described in Sect. 4.4. The incidence of binary candidates in a sample limited to the distance of 500 pc can be estimated as follows. As explained in Sect. 4.3, among the 58 AGB sources surveyed by GALEX not known to be symbiotic systems, 5 were not detected in the survey and 53 were detected in the far- and/or near-UV bands. Among these, 34 stars have been selected as binary AGB candidates. Therefore, the occurrence of candidates is 34/58 or 59%, higher than some previous studies focused on other samples: 8% of spectroscopic binaries in field red giants (Jorissen et al., 2004) and 26% in three open clusters (Mermilliod, 2001). Additional work, e.g. based on kinematic data, should be devoted to confirm the candidates selected in the present study, which eventually may decrease the incidence of confirmed AGB binary systems.
6 Conclusions
This work has focused on the search for main-sequence (MS) companions of AGB stars detected in the galex survey. This study extends the method originally proposed by Sahai et al. (2008): the UV excess of AGB stars is due to the presence of a companion, which can be detected above the emission of the primary if its temperature is 6000 K and the flux is within the detection limits of the galex survey. After analysing the characteristics of the UV emission of a sample of bona-fide binary AGB stars detected with galex, it can be concluded that:
-
1.
Within a distance of 500 pc, galex detection limits of MS stars are 5000 K and 6500 K for the near-UV and far-UV bands, respectively.
-
2.
Although the UV flux originates mostly from the secondary star, other extrinsic factors might affect its intensity, causing variability, for instance, the intrinsic variability of the primary and the opacity of a common envelope of gas and dust or accretion of material onto the secondary or onto an accretion disk around it.
-
3.
The galex near-UV excess of confirmed binary AGB stars varied within and .
-
4.
A possible criterium for binarity is: (1) detection in the far-UV galex band and/or (2) .
-
5.
The UV excess of the candidates to binary AGB stars cannot be fitted with a single-temperature companion. The UV emission of the secondary is possibly affected by the extended atmosphere of the primary and/or its circumstellar envelope or it may reveal additional sources of UV emission in accretion processes.
Acknowledgements
RO thanks the São Paulo Research Foundation (FAPESP) for the grants #2010/18835-3 and #2015/00890-1. MAG acknowledges support of the grant AYA 2014-57280-P, co-funded with FEDER funds.
This research has made use of the SIMBAD database, operated at CDS, Strasbourg, France. This research has made use of NASA’s Astrophysics Data System. The Guide Star Catalogue-II is a joint project of the Space Telescope Science Institute and the Osservatorio Astronomico di Torino. Space Telescope Science Institute is operated by the Association of Universities for Research in Astronomy, for the National Aeronautics and Space Administration under contract NAS5-26555. The participation of the Osservatorio Astronomico di Torino is supported by the Italian Council for Research in Astronomy. Additional support is provided by European Southern Observatory, Space Telescope European Coordinating Facility, the International GEMINI project and the European Space Agency Astrophysics Division. This publication makes use of data products from the Two Micron All Sky Survey, which is a joint project of the University of Massachusetts and the Infrared Processing and Analysis Center/California Institute of Technology, funded by the National Aeronautics and Space Administration and the National Science Foundation.
References
- Ake & Johnson (1988) Ake, T.B. & Johnson, H.R., 1988, ApJ 327, 214
- Baranne et al. (1979) Baranne, A., Mayor, M. & Poncet, J.L., 1979, Vistas in Astronomy 23, 279
- Belczynski et al. (2000) Belckzynski, K., Mikilajewska, J., Munari, U., Ivison, R.J. & Friedjung, M., 2000, A&AS 146, 407
- Beuzit et al. (2008) Beuzit, J.-L., Feldt, M., Dohlen, K., Mouillet, D., Puget, P., Wildi, F., Abe, L., Antichi, J., Baruffolo, A., Baudoz, P. et al., 2008, SPIE 7014, 18
- Bianchi et al. (2007) Bianchi, L., Rodriguez-Merino, L., Viton, M., Laget, M., Efremova, B., Herald, J., Conti, A., Shiao, B., Gil de Paz, A., Salim, S. et al., 2007, ApJS 173, 659
- Castelaz & McCollum (1995) Castelaz, M.W. & McCollum, B., 1995, AJ 109, 341
- Castelli & Kurucz (2003) Castelli, F. & Kurucz, R.L., 2003, in IAU Symp. 210, Modelling of Stellar Atmospheres, ed. W.W. Piskunov & D.F. Gray (San Francisco: ASP), A20
- Celis (1986) Celis, S.L., 1986, ApJS 60, 879
- Corradi & Schwarz (1993) Corradi, R.L.M. & Schwarz, H.E., 1993, A&A 268, 714
- Cotton et al. (2010) Cotton, W.D., Ragland, S., Pluzhnik, E.A., Danchi, W.C., Traub, W.A., Willson, L.A. & Lacasse, M.G., 2010, ApJS 188, 506
- Cox (2002) Cox, A.N. 2002, Allen’s Astrophysical Quantities, Springer
- Cox et al. (1012) Cox, N.L.J., Kerschbaum, F., van Marle, A.-J., Decin, L., Ladjal, D., Mayer, A., Groenewegen, M.A.T., van Eck, S., Royer, P., Ottensamer, R. et al., A&A 537, A35
- Danilovich et al. (2015) Danilovich, T., Olofsson, G., Black, J.H., Justtanont, K., & Olofsson, H., 2015, A&A 574, A23
- De Beck et al. (2010) De Beck, E., Decin, L, de Koter, A., Justtanont, K., Verhoelst, T., Kemper, F. & Menten, K.M., 2010, A&A 523, 18
- De Marco et al. (2013) De Marco, O., Passy, J.-C., Frew, D.J., Moe, M. & Jacoby, G.H., 2013, MNRAS 428, 2118
- ESA (1997) ESA 1997, The Hipparcos and Tycho Catalogues, SP 1136 (ESA)
- Famaey et al. (2009) Famaey, B., Pourbaix, D., Frankowski, A., van Eck, S., Mayor, M., Udry, S. & Jorissen, A., 2009, A&A 498, 627
- Fluks et al. (1994) Fluks, M.A., Plez, B., Thé, P.S., de Winter, D., Westerlund, B.E. & Steenman, H.C., 1994, A&AS 105, 311
- Frankowski et al. (2007) Frankowski, A., Jancart, S. & Jorissen, A., 2007, A&A 464, 377
- Froebrich et al. (2010) Froebrich, D., Schmeja, S., Samuel, D. & Lucas, P.W., 2010, MNRAS 409, 1281
- Fusco et al. (2014) Fusco, T., Sauvage, J.-F., Petit, C., Costille, A., Dohlen, K., Mouillet, D., Beuzit, J.-L., Kasper, M., Suarez, M., Soenke, C. et al., 2014, SPIE 9148, 1
- García-Segura et al. (1999) García-Segura, G., Langer, N., Rózyczka, M. & Franco, J., 1999, ApJ 517, 767
- García-Segura et al. (2005) García-Segura, G., López, J.A. & Franco, J., 2005, ApJ 618, 919
- Glass et al. (1995) Glass, I.S., Whitelock, P.A., Catchpole, R.M. & Feast, M.W., 1995, MNRAS 273, 383
- Groenewegen et al. (1992) Groenewegen, M.A.T., de Jong, T., van der Bliek, N.S., Slijkhuis, S. & Willems, F.J., 1992, A&A 253, 150
- Groenewegen & Whitelock (1996) Groenewegen, M.A.T. & Whitelock, P.A., 1996, MNRAS 281, 1347
- Horch et al. (2011) Horch, E.P., Gomez, S.C., Sherry, W.H., Howell, S.B., Ciardi, D.R., Anderson, L.M. & van Altena, W.F., 2011, AJ 141, 45
- Houk et al. (1988) Houk, M. & Smith-Moore, M., 1988, Michigan Spectral Survey, Univ. Michigan
- Huggins et al. (2009) Huggins, P.J., Mauron, N. & Wirth, E.A., 2009, MNRAS 396, 1805
- Hunsch et al. (1998) Hunsch, M., Schmitt, J.H.M.M., Schroeder, K. & Zickgraf, F., 1998, A&A 330, 225
- Ita et al. (2010) Ita, Y., Matsuura, M., Ishihara, D., Oyabu, S., Takita, S., Kataza, H., Yamamura, I., Matsunaga, N., Tanabé, T., Nakada, Y. et al., 2010, A&A 514, A2
- Ivanova et al. (2013) Ivanova N., et al., 2013, A&ARv, 21, 59
- Johnson et al. (1993) Johnson, H.R., Ake, T.B. & Ameen, M.M., 1993, ApJ 402, 667
- Jorissen et al. (2004) Jorissen, A., Famaey, B., Dedecker, M., Pourbaix, D., Mayor, M. & Udry, S., 2004, RMxAC 21, 71
- Jura (1994) Jura, M., ApJ 422, 102
- Karovska et al. (1993) Karovska, M., Nisenson, P. & Beletic, J., 1993, ApJ 402, 311
- Karovska et al. (1997) Karovska, M., M., Hack, W., Raymond, J. & Guinan, E., 1997, ApJ 482, L175
- Keenan (1954) Keenan, P.C., 1954, ApJ 120, 484
- Keenan et al. (1974) Keenan, P.C., Garrison, R.F. & Deutsch, A.J., 1974, ApJS 28, 271
- Kervella et al. (2015) Kervella, P., Montargès, M., Lagadec, E., Ridgway, S.T., Haubois, X., Girard, J.H., Ohnaka, K., Perrin, G. & Gallenne, A., 2015, A&A 578, A77
- Koornneef (1983) Koornneef, J., 1983, A&A 128, 84
- Lasker et al. (2008) Lasker, B.M., Lattanzi, M.G., McLean, B.J., Bucciarelli, B., Drimmel, R., Garcia, J., Greene, G., Guglielmetti, F., Hanley, C., Hawkins, G. et al., 2008, AJ 136, 735
- Lejeune et al. (1997) Lejeune, T., Cuisinier, F. & Buser, R., 1997, A&AS 125, 229
- Lépine et al. (1995) Lépine, J.R.D., Ortiz, R. & Epchtein, N., 1995, A&A 299, 453
- Maercker et al. (2014) Maercker, M., Ramstedt, S., Leal-Ferreira, M.L., Olofsson, G., & Floren, H.G., 2014, A&A 570, A101
- Maercker et al. (2016) Maercker, M., Vlemmings, W.H.T., Brunner, M., De Beck, E., Humphreys, E.M., Kerschbaum, F., Lindqvist, M., Olofsson, H. & Ramstedt, S., 2016, A&A 586, A5
- Maíz-Apellániz (2006) Maíz-Apellániz, J., 2006, AJ 131, 1184
- Marshall et al. (2006) Marshall, D.J., Robin, A.C., Reylé, C., Schultheis, M. & Picaud, S., 2006, A&A 453, 635
- Martin et al. (2005) Martin, D.C., Fanson, J., Schiminovich, D., Morrissey, P., Friedman, P.G., Barlow, T.A., Conrow, T., Grange, R., Jelinsky, P.N., Milliard, B. et al., 2005, ApJ 619, L1
- Mason et al. (1999) Mason, B.D., Martin, C., Hartkopf, W.I., Barry, D.J., Germain, M.E., Douglass, G.G., Worley, C.E. & Wycoff, G.L., 1999, AJ 117, 1890
- Mason et al. (2001) Mason, B.D., Wycoff, G.L., Hartkopf, W.I., Douglass, G.G. & Worley, C.E., 2001, AJ 122, 3466
- Mauron et al. (2013) Mauron, N., Huggins, P.J. & Cheung, C.-L., 2013, A&A 551, A110
- Mayer et al. (2013) Mayer, A., Jorissen, A., Kerschbaum, F., Ottensamer, R., Nowotny, W., Cox, N.L.J., Aringer, B., Blommaert, J.A.D.L., Decin, L., van Eck, S., Gail, H.-P., Groenewegen, M.A.T., Kornfeld, K., Mecina, M., Posch, Th., Vandenbussche, B. & Waelkens, C., 2013, A&A 549, A69
- McDonald et al. (2012) McDonald, I., Zijlstra, A.A. & Boyer, M.L., 2012, MNRAS 427, 343
- Mennessier et al. (1997) Mennessier, M.O., Boughaleb, H. & Mattei, J.A., 1997, A&AS 124, 143
- Mermilliod (2001) Mermilliod, J.-C., 2001, in Astrophys. Space Sc. Lib., 264, The Influence of Binaries on Stellar Population Studies, ed. D. Vanbeveren (Dordrecht: Kluwer), 3
- Morrissey et al. (2005) Morrissey, P., Schiminovich, D., Barlow, T.A., Martin, D.C., Blakkolb, B., Conrow, T., Cooke, B., Erickson, K., Fanson, J., Friedman, P.G. et al., 2005, ApJ 619, L10
- Nhung et al. (2015) Nhung, P.T., Thi HOai, D., Winters, J.M., Darriulat, P., Gérard, E. & Le Bertre, T., 2015, RAA 15, 713
- Nordhaus et al. (2007) Nordhaus, J., Blackman, E.G. & Frank, A., 2007, MNRAS 376, 599
- Ortiz & Lépine (1993) Ortiz, R. & Lépine, J.R.D., 1993, A&A 279, 90
- Ortiz & Maciel (1996) Ortiz, R. & Maciel, W.J., 1996, A&A 313, 180
- Perryman et al. (1997) Perryman, M.A.C., Lindegren, L., Kovalevsky, J., Hog, E., Bastian, U., Bernacca, P.L., Crézé, M., Donati, F., Grenon, M., Grewing, M. et al., 1997, A&A 323, L49
- Pourbaix et al. (2003) Pourbaix, D., Platais, I., Detournay, S., Jorissen, A., Knapp, G. & Makarov, V.V., 2003, A&A 399, 1167
- Pourbaix et al. (2004) Pourbaix, D., Tokovinin, A.A., Batten, A.H. et al. 2004, A&A 424, 727
- Prieur et al. (2002) Prieur, J.L., Aristidi, E., Lopez, B., Scardia, M., Mignard, F. & Carbillet, M., 2002, ApJS 139, 249
- Ramstedt et al. (2011) Ramstedt, S., Maercker, M., Olofsson, G., Olofsson, H., Schoeier, F.L., 2011, 531, A148
- Sahai et al. (2008) Sahai, R., Findeisen, K., Gil de Paz, A & Sánchez-Contreras, C., 2008, ApJ 689, 1274
- Sahai et al. (2011) Sahai, R., Neill, J.D., Gil de Paz, A. & Sánchez-Contreras, C., 2011, ApJ 740, L39
- Sahai et al. (2015) Sahai R., Sanz-Forcada J., Sánchez Contreras C., Stute M., 2015, ApJ, 810, 77
- Salaris & Cassisi (1997) Salaris, M. & Cassisi, S., 1997, MNRAS 289, 406
- Samus et al. (2015) Samus, N.N., Durlevich, O.V., Goranskij, V.P., Kazarovets, E.V., Kireeva, N.N., Pastukhova, E.N., Zharova, A.V., 2007-2015, General Catalogue of Variable Stars online edition available at www.sai.msu.su/gcvs/gcvs
- Sanchez et al. (2015) Sanchez, E., Montez Jr., R., Ramstedt, S. & Stassun, K.G., 2015, ApJ 798, L39
- Sivagnanam et al. (1988) Sivagnanam, P., Le Squeren, A.M. & Foy, F., 1988, A&A 206, 285
- Skrutskie et al. (2006) Skrutskie, R.M., Cutri, R. Stiening, M.D. Weinberg, S. Schneider, J.M. Carpenter, C. Beichman, R. Capps, T. Chester, J. Elias, J. Huchra, J. Liebert, C. Lonsdale, D.G. Monet, S. Price, P. Seitzer, T. Jarrett, J.D. Kirkpatrick, J. Gizis, E. Howard, T. Evans, J. Fowler, L. Fullmer, R. Hurt, R. Light, E.L. Kopan, K.A. Marsh, H.L. McCallon, R. Tam, S. Van Dyk, and S. Wheelock, 2006, AJ, 131, 1163
- Sloan & Price (1998) Sloan, G.C. & Price, S.D., 1998, ApJS 119, 141
- Smith & Lambert (1987) Smith, V.V. & Lambert, D.L., 1987, AJ 94, 977
- Soker (1998) Soker, N., 1998, ApJ 496, 833
- Soker (2006) Soker, N., 2006, PASP 118, 260
- Staff et al. (2016) Staff J. E., De Marco O., Macdonald D., Galaviz P., Passy J.-C., Iaconi R., Low M.-M. M., 2016, MNRAS, 455, 3511
- Thiering & Reimers (1993) Thiering, I. & Reimers, D., 1993, A&A 274, 838
- van Langevelde, H.J. et al. (1990) van Langevelde, H.J., van der Heiden, R. & Schooneveld, C., 1990, A&AS 239, 193
- van Leeuwen (2007) van Leeuwen, F., 2007, A&A 474, 653
- Wood & Cahn (1977) Wood, P.R. & Cahn, J.H., 1977, ApJ 211, 499
- Yuan et al. (2013) Yuan, H.B., Liu, X.W. & Xiang, M.S., 2013, MNRAS 430, 2188