Robust Keystroke Biometric Anomaly Detection
Abstract
The Keystroke Biometrics Ongoing Competition (KBOC) presented an anomaly detection challenge with a public keystroke dataset containing a large number of subjects and real-world aspects. Over 300 subjects typed case-insensitive repetitions of their first and last name, and as a result, keystroke sequences could vary in length and order depending on the usage of modifier keys. To deal with this, a keystroke alignment preprocessing algorithm was developed to establish a semantic correspondence between keystrokes in mismatched sequences. The method is robust in the sense that query keystroke sequences need only approximately match a target sequence, and alignment is agnostic to the particular anomaly detector used. This paper describes the fifteen best-performing anomaly detection systems submitted to the KBOC, which ranged from auto-encoding neural networks to ensemble methods. Manhattan distance achieved the lowest equal error rate of 5.32%, while all fifteen systems performed better than any other submission. Performance gains are shown to be due in large part not to the particular anomaly detector, but to preprocessing and score normalization techniques.
keywords:
keystroke dynamics, anomaly detection, behavioral biometrics, cybersecurity, human-computer interactionurl]www.vmonaco.com
1 Introduction
The Keystroke Biometrics Ongoing Competition (KBOC) presented an anomaly detection challenge in the form of a biometric competition [28, 29]. Given only several template samples for training, participants were tasked with designing keystroke biometric verification systems that achieved a low equal error rate on a set of unlabeled query samples. Unlike previous keystroke biometric competitions [23], the KBOC utilized a platform that allows ongoing participation [26]. This paper describes the best-performing systems of the KBOC. These systems addressed two unique features of the KBOC dataset not typically seen in other keystroke datasets.
The keystrokes closely match, but are not necessary identical to, a target sequence. Genuine and impostor subjects were required to type a case insensitive match to the template subject’s first and last name. As a result, the samples contain insertions, deletions, substitutions, and transpositions from each other, primarily due to the usage of modifier keys. Even the template keystroke sequences sometimes differ from one another, reflecting inconsistencies in the way a genuine subject types their name. Thus, the template and query samples only approximately match a target keystroke sequence. This scenario is not quite fixed-text, such as password entry, and not quite free-text, such as an essay response. To deal with the mismatched samples, a keystroke alignment preprocessing algorithm robust to typing errors was developed. The method maximizes the amount of data available for training and testing, achieving better performance over benchmark alternatives, such as discarding mismatched keystrokes or truncating sequences to the length of the shortest sequence.
The target keystroke sequence is unique to each subject. Unlike most fixed-text datasets in which every subject types the same password or passphrase (e.g., [15] and other datasets described in Giot et al. [10]), the target input string111string refers to the character sequence that actually appears on screen, and keystroke sequence refers to the sequence of keys pressed. For example, both keystroke sequences “G, Backspace, T” and “T” result in string “t”. Keyboard key names are denoted in monospace. for each subject in the KBOC dataset was the subject’s first and last name. Thus, the keystroke sequences for each subject are different. Importantly, the samples reflect a keystroke sequence that the genuine subject is more familiar with than an impostor. Since the keystroke sequences are different for each subject, two-class models (i.e., genuine vs. impostor) are not practical due to the difficulty in utilizing negative data for training. Therefore, only one-class models, i.e, anomaly detectors, are considered. Given only several template samples are available for training, the anomaly detector must be able to learn a given subject’s pattern quickly. To this end, feature and score normalization techniques robust to outliers and few training samples were developed.
The keystroke alignment and score normalization techniques described in this work are agnostic to the particular anomaly detector used, and results are obtained for a range of models. The complete anomaly detection systems utilize a processing pipeline that consists of four main steps: keystroke alignment, feature extraction, scoring, and score normalization. During keystroke alignment, a correspondence is established between keystrokes of the query and template samples, which may differ slightly as described below. The query sample keystrokes are aligned to match the template, which enables standard fixed-text techniques to subsequently be applied. Keystroke timing features are extracted from the aligned sequences using normalization bounds specific to each subject. Following this, an anomaly detector is trained on the template samples and a similarity score is assigned to the query sample. Finally, the score is normalized using subject-specific normalization bounds.
Performance gains are largely due to the score normalization and keystroke alignment techniques, over alternative methods, as demonstrated in the results of this work. The feature and score normalization techniques use subject-specific bounds which are robust against feature and score outliers, respectively. The keystroke alignment method is robust to typing errors and slightly differing keystroke sequences. This maximizes the amount of data available for training and testing, leading to a reduced failure to capture (FTC) rate [3]. The fifteen best-performing systems in the KBOC ranged from auto-encoding neural networks to Manhattan distance, and all fifteen systems achieved a lower equal error rate than any other submission.
The rest of this paper is organized as follows. Section 2 provides a background of the KBOC data collection procedure and competition details. Sections 3 and 4 describe keystroke alignment and feature extraction, respectively. Section 5 describes the various anomaly detectors, followed by score normalization in Section 6. Experimental results are contained in Section 7, and Section 8 discusses and analyzes the effects of keystroke alignment and score normalization. Finally, Section 9 draws conclusions and discusses future work. Source code of all the systems described and to reproduce the results in this paper is available at https://github.com/vmonaco/kboc.
2 Background
The KBOC was part of the IEEE Eighth International Conference on Biometrics: Theory, Applications, and Systems (BTAS 2016) and had two modes of participation: online mode and offline mode. Participation in the online mode is continuous, hence the “ongoing” competition222Current leaderboard https://www.beat-eu.org/platform/search/aythamimm/KBOC16_COMPETITION_SEARCH/ [28, 29]. This paper describes only the offline mode, which ran from January 31, 2016 (when the test dataset became available), to April 22, 2016 (the deadline for submissions). Each participant could submit up to 15 systems, and submissions were evaluated only after the competition deadline to avoid overfitting. The KBOC dataset, described in this section, is publicly available upon request333See https://sites.google.com/site/btas16kboc/home.
2.1 Dataset
Two separate datasets were made available to competition participants: a development set for the purpose of system development, and a test set for the purpose of system evaluation. The development set contains 10 subjects, each with 24 labeled samples (14 genuine and 10 impostor). The test set contains 300 subjects, each with 4 labeled template samples and 20 unlabeled query samples. The ratio of genuine to impostor samples in the test set remained hidden from competition participants to increase difficulty.
Data collection was performed in a semi-controlled environment designed for multimodal recordings [9]. Subjects were geographically dispersed across 6 collection sites and approximately evenly distributed by age (42% 18–25, 22% 25–35, 16% 35–45, 20% 45) and gender (54% male). Each subject participated in 4 data collection sessions within 4 months time. During each session, the subject typed 4 case-insensitive repetitions of their own name (2 in the middle of the session and 2 at the end) and the names of 3 other subjects (7 samples total). While there were totally 16 genuine and 12 impostor samples available for each subject in the original dataset [9], the numbers of genuine and impostor samples were randomly selected for the KBOC test dataset. This ranged from 8 to 12, leaving 4 template samples per subject. Samples that contained typing errors during data collection were discarded. However, the number of keystrokes per subject could vary due to the use of modifier keys, such as Shift and Caps Lock. This is an important characteristic motivating the development of a keystroke alignment preprocessing algorithm in Section 3.
Each raw sample contains a sequence of 3-tuple events comprised of the action (press or release), keyboard scancode, and the time interval since the previous event (beginning with 0 for the first event). In this work, the action sequence is converted to a keystroke sequence, wherein each keystroke event is a 3-tuple that contains the key name, press timestamp, and release timestamp. Samples range in length based on the subject’s name, from 12 to 30 keystrokes with an average of keystrokes. Timing features, described in Section 4, are extracted from the aligned keystroke sequence.
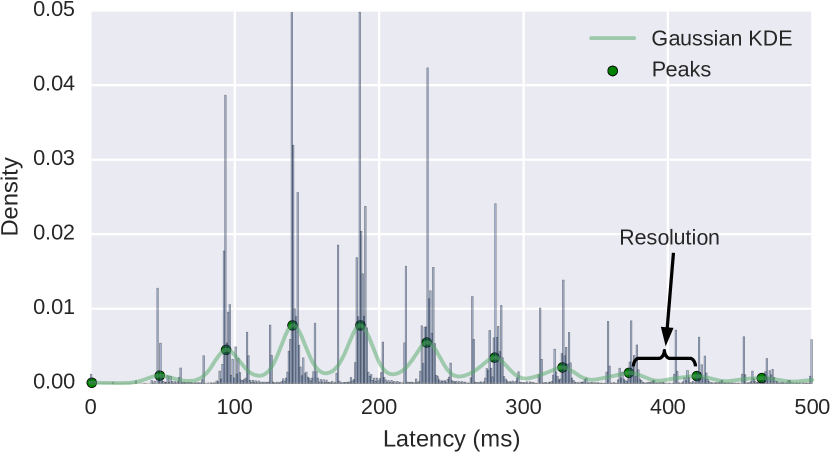
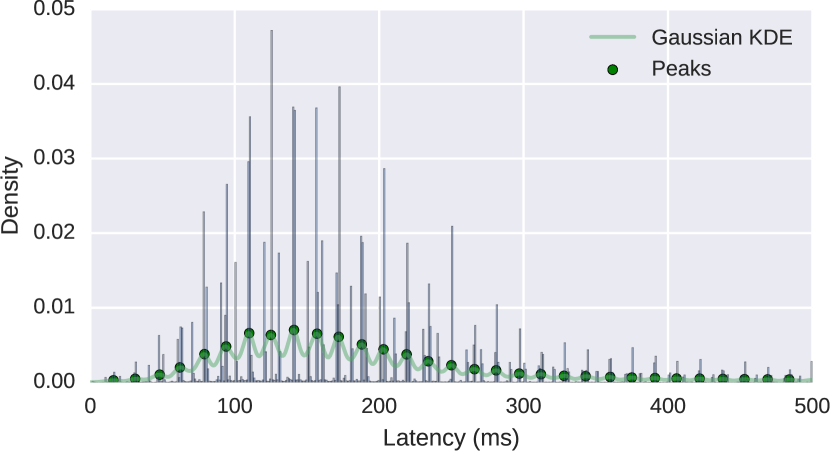
Timestamps were recorded with 1 millisecond (ms) resolution, although the actual resolution is limited by scheduling policies of the operating system kernel. Specifically, most operating system kernels handle interrupts from peripheral devices on a fixed period set by a global timer. Timestamp resolution is then limited by how quickly the kernel can respond to an interrupt generated by the keyboard device, which is at most the global timer period. This effect is evident in the empirical distribution of press-press latencies, shown in Figure 1a. A Gaussian kernel density estimate (KDE) is applied to the latencies to identify regions of relatively high density, i.e., clustered latencies. The high density regions reflect quantization introduced by the global timer, and dispersion within each region reflects timestamp precision444Note that resolution is the degree to which a measurement can be made and precision is the degree to which a measurement can be repeated.. Taking the mean distance between modes of the Gaussian KDE gives an estimated precision of 46.4 ms, close to the 40 ms estimated precision in Morales et al. [29]. For comparison, the same technique is applied to the press-press latencies of a free-text keystroke dataset collected on a different platform: a Java application running on Windows desktop computers [21]. The resolution of the free-text dataset, shown in Figure 1b, is estimated to be 15.6 ms, which agrees very well with the 15.6 ms Windows default system-wide timer [19]. According to results in Killourhy and Maxion [13], the relatively lower resolution of the KBOC timings makes anomaly detection more challenging, as higher equal error rates have been associated with lower resolution timestamps. Besides the global timer period, system load and other environmental factors also play a role in determining the resolution and precision of keystroke event timestamps [14].
2.2 System evaluation
Anomaly detectors are often evaluated by their equal error rate (EER), the point on the receiver operating characteristic (ROC) curve at which the false acceptance rate (FAR) is equal to the false rejection rate (FRR). The EER can be derived by varying either a global threshold or subject-dependent thresholds.
To compute the global EER, the ROC curve is derived by varying a global threshold. In this case, the proportions of false positive and false negative classifications from all subjects are counted to compute the FAR and FRR at each threshold value.
The subject EER is the EER obtained by deriving an ROC curve for each subject. As a subject-dependent threshold is varied, the FAR and FRR are computed using the number of false positive and false negative classifications for a single subject. Since this produces an EER for each subject in the dataset, system performance is typically characterized by the mean and standard deviation (SD) of the distribution of subject EERs.
The KBOC anomaly detectors are evaluated by the global EER. There are 20 query samples for each subject in the KBOC test dataset, which provides scores to derive the global ROC curve. In the rest of this paper, EER refers to the global EER unless otherwise noted.
3 Keystroke alignment
3.1 Motivation
The KBOC data collection procedure required samples to be a case-insensitive match to the subject’s first and last name. As a result, the presence of modifier keys (e.g., Shift and Caps Lock) produced different keystroke sequences for the same case-insensitive string typed. Samples could vary in length (i.e., number of keystrokes) depending on whether modifier keys were used for capitalization. They could also vary in sequence depending on the order of keys pressed. In particular, both template and query samples contain:
-
1.
Insertions and deletions, e.g., due to the use or disuse of Shift.
-
2.
Substitutions, e.g., due to the use of Caps Lock instead of Shift555There are also some substitutions due to different keyboard scancode sets being used [4]. In set 1, Keypad-minus is 35 (hex), and in set 2 Keypad-minus is 4a (hex)..
-
3.
Transpositions, e.g., both sequences “Space, Shift, T” and “Shift, Space, T” result in the string “T” when the Shift key is prolonged.
This scenario is not quite fixed text, such as password entry which requires an exact match, and not quite free text, such as answering an open-ended question which places no restriction on the text entered. Instead, the keystroke sequence closely matches some target sequence for each subject.
The need for a keystroke alignment method is verified by comparing the keystroke sequences, and not the typed string. Consider all possible combinations of template samples for each subject, i.e, combinations. Of these, 226 out of 1800 (12.6%) template-to-template comparisons differ from each other. The average Damerau-Levenshtein (DL) distance, which measures insertions, deletions, substitutions, and transpositions [6], is with a maximum distance of 4. Similarly, there are possible query-to-template combinations in which a query sample is compared to a single template sample. Of these, 1545 out of 24,000 (6.4%) query-to-template comparisons differ from each other, with an average DL distance of and maximum distance of 7.
Many anomaly detectors operate on fixed-length feature vectors, motivating the development of a method to compare slightly differing sequences. One option is to use a free-text approach in which fixed-length feature vectors are extracted from arbitrary keystroke sequences using a fallback hierarchy of descriptive statistics [21]. In this case, the fact that the sequences are very close to some target sequence is ignored. Instead, it would be desirable to create fixed-length keystroke sequences from the semi-constrained sequences and then apply standard feature extraction techniques [15]. The method introduced in this work aims to align the keystrokes from two slightly differing sequences and then extract standard time interval features from the aligned sequences.
3.2 Alignment method
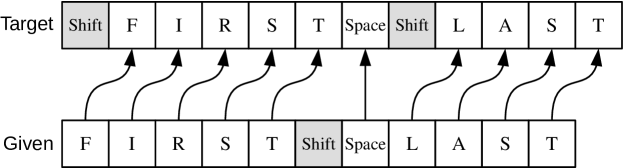
To compare slightly-differing keystroke sequences, a sequence-alignment algorithm was developed to establish a correspondence between keystrokes of two different samples. This allows two samples with similar keystroke sequences to be compared using an anomaly detector that operates on feature vectors of fixed length, such as Manhattan distance. In establishing the correspondence, let the target sequence be a fixed sequence of keystrokes to which a given sequence will be aligned. Thus, the given sequence is modified to match the target.
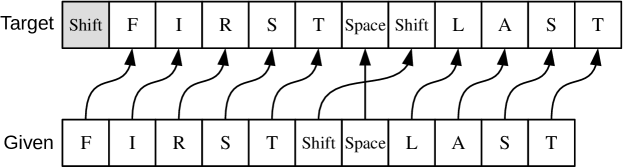
Keystrokes from the given sequence are aligned to the target sequence as follows. For each key in the target sequence, find the same key in the given sequence with the closest position. If the key does not exist in the given sequence, then use as a substitute the key in the corresponding position. If a key appears in the given sequence, but not the target sequence, it is simply ignored. The keystrokes in the given sequence are then reordered by their mapping to the target sequence, as shown in Figure 2a.
Since there exist both within-template and query-to-template differences in the keystroke sequences, as demonstrated in Section 3.1, a two-step alignment process is employed. First, let the target sequence for each subject be the template sample with fewest keystrokes. The remaining 3 template samples for each subject are aligned to the target sequence. This creates a set of aligned template samples from which the anomaly detector is trained. Next, the query samples for each subject are aligned to the target sequence. The aligned query samples are then scored by the fixed-text anomaly detector.
Alignment ensures an element-wise semantic similarity between the given and target keystrokes, and subsequently, the extracted features. In other words, considering the keystrokes of a target sequence, the corresponding keystrokes in the given sequence should have been pressed with similar intention by the subject. Keystroke alignment ensures this correspondence by matching substituted and transposed keys between the two sequences.
To illustrate its utility, keystroke alignment is compared to some benchmark alternatives, also shown in Figure 2. Let truncate be the method in which the keystrokes of the given sequence are simply truncated to be the same length as the target sequence. This approach is shown in Figure 2b. Unless the keystroke sequences match exactly, semantically different features will be compared by the anomaly detector, following feature extraction. Truncation is especially sensitive to sequences that differ in length, as shown in the example.
Alternatively, consider the method of discarding modifier keys, shown in Figure 2c. While this method has the advantage that the resulting sequences will match exactly after discarding modifier keys, it ignores distinguishable behavior which may have been captured by modifier key usage. For example, if a subject typically types “Left Shift, L” for a capital “L”, and an impostor types “Right Shift, L”, the press-press latencies of the impostor will likely be longer than that of the genuine subject. This is due keys that are far apart generally being be pressed in quicker succession than keys that are close together as a result of finger and/or hand reuse [32, 22].
4 Feature extraction
Time interval features are extracted from the aligned keystroke sequence, wherein each keystroke event contains a press time, release time, and key name. While a variety of keystroke timings can be computed from the timestamps, this work uses the press-press latencies and key-hold durations. The press-press latency is the time interval between two successive key-presses, denoted by . The key-hold duration is the time interval from the press to release of each key, denoted by . If the target sequence contains 11 keystrokes, then the feature vectors for every given sequence aligned to the target will contain 31 features (10 latencies and 11 durations). Note that any other time interval, such as release-press or release-release latencies of successive keystrokes, can be formed by a linear combination of the press-press latency and key-hold duration.
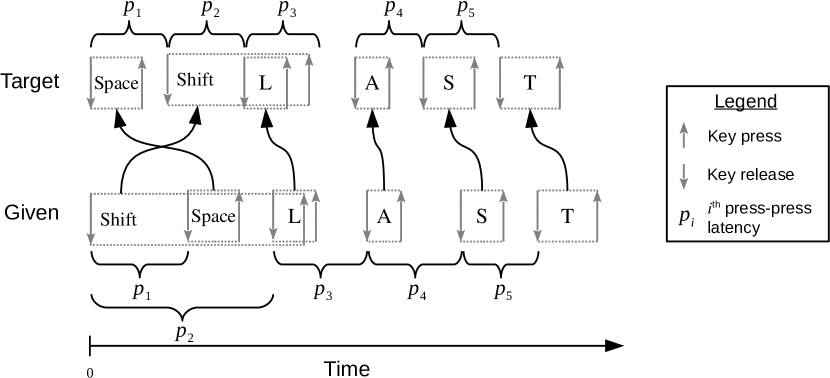
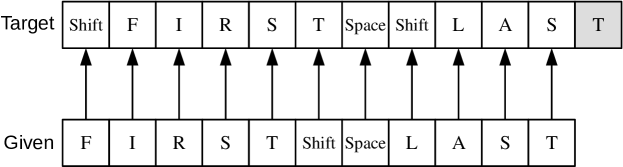
The press-press latency is typically positive since keystrokes are normally ordered by their press time (as they would appear on screen to the user). After a given sequence has been aligned to a target sequence, the press-press latency can be negative when there is a transposition between the given and target sequence. Using Figure 3 as an example, the keystrokes in the given sequence are reordered to the positions of the corresponding keys in the target sequence. In the given sequence, the press-press latency from Space to Shift, denoted by , is negative since Shift is pressed before Space.
Reordering the keystrokes of the given sequence in this way, such that the press-press latency becomes negative for transposed keys, does not have an adverse effect on anomaly detection as long as this behavior is also captured in the template samples. Consider a typist who presses the keys Space and Shift in very quick succession. The press-press latency between these keys will be close to 0, and if normal behavior is to transpose these keys 50% of the time, the distribution of press-press latencies will be centered on 0. Then, it does not matter whether the feature in the given sequence is positive or negative, i.e., whether the given sequence contains “Space, Shift” or “Shift, Space”; it has equal likelihood in both cases.
4.1 Feature normalization
The latency and duration features are normalized to the range . The th normalized press-press latency is given by
| (1) |
where is the raw feature and and provide the lower and upper bounds for normalization, respectively. Let be the mean and the SD of the distribution of latencies in the subject’s aligned template samples. That is, and are determined by the aligned templates no matter whether the feature being normalized is from a query or template sample. Normalization bounds are given by
| (2) |
where is a free parameter. In this work, results were obtained using , i.e., normalizing features to within one SD of the mean. The duration features are normalized similarly, replacing for .
Note that feature normalization uses the first and second order statistics of the distribution of the subject’s aligned template samples. The effect of this approach is twofold. First, it ensures that outlier features do not greatly affect the normalization bounds as they would using min/max normalization. Second, per-subject normalization ensures that normalized features are relative to the subject’s template since each subject has their own normalization bounds. Query samples are normalized using the lower and upper bounds determined from the template samples. Thus, if the query sample is genuine, its normalized features will be closer to the center of the interval , whereas the normalized features of an impostor sample will be closer to the endpoints (assuming it is greater or less than the genuine mean).
5 Anomaly detection
The keystroke alignment and feature normalization methods introduced in this work are agnostic to the particular anomaly detector used. Six different anomaly detectors, and one ensemble method, are described in this section. Neural network models were implemented using the TensorFlow library [1]. All models were implemented in Python and remain publicly available at https://github.com/vmonaco/kboc.
5.1 Autoencoder
The basic autoencoder (AE) is a neural network that aims to encode and then decode its input [2]. The network topology consists of equally-sized input and output layers separated by at least one hidden layer. Successive layers are fully connected through weight matrices, a bias vector, and a nonlinear function. It is common to use tied weights, i.e., the weight matrix connecting the hidden and output layers is simply the transpose weight matrix connecting the input and hidden layers. This limits the number of model parameters and acts as a kind of regularization.
Using feature vector as input, the hidden layer is calculated as
| (3) |
where is the weight matrix and is the hidden layer bias vector. Similarly, the output layer is given by
| (4) |
where is the output bias vector. The complete model parameters consist of . Hidden layers can be stacked to create a deep network, and dimensions of the hidden layers comprise the model hyperparameters. Typically, at least one hidden layer should be smaller than the input layer to achieve a compressed representation and avoid learning the identity function. Parameters are determined by back-propagating gradients from a squared error loss function,
| (5) |
where is the reconstructed output. The objective function of the basic autoencoder is given by
| (6) |
where is the set of training examples. Bias parameters are initialized to 0 and weights are initialized from a random uniform distribution such that the scale of the gradients in each layer is roughly the same [11]. During testing, the score of a query sample is given by the negative reconstruction error, .
5.2 Contractive autoencoder
The contractive autoencoder (CAE) is an autoencoder that uses the Frobenius norm of the hidden layer Jacobian as a regularization term [31]. This enables a sparse representation of the input whereby the dimension of the hidden layer is much larger than the input and output layer dimensions. The CAE is closely related to the denoising autoencoder, in which the goal is to reconstruct an input vector that has been corrupted by noise [34].
The CAE in this work uses a sigmoid activation function. The hidden layer is given by
| (7) |
where . Similarly, the output layer is given by
| (8) |
The objective function of the CAE includes a regularization term that penalizes the Jacobian of ,
where is a free parameter and is the squared Frobenius norm. Similar to the basic autoencoder, the loss function, , is the squared reconstruction error. Using a sigmoid activation function allows for efficient computation of the Jacobian, given by
| (9) |
where and are the hidden and input layer dimensions, respectively. Similar to the basic AE, bias vectors are initialized to 0 and weight vectors use Xavier initialization [11].
5.3 Variational autoencoder
The variational autoencoder (VAE) is a probabilistic autoencoder with continuous latent variables [17]. Parameters are learned efficiently by backpropagation through a reparametrization trick, which allows the gradient of the loss function to propagate through the sampling process. The objective function of the VAE is composed of both a reconstruction loss and a latent loss. Query sample scores are given by the negative reconstruction loss, which is the negative log probability of the input given the reconstructed latent distribution.
5.4 One-class support vector machine
The one-class support vector machine (SVM) is an unsupervised model that learns a separating hyperplane between the origin and feature vector points666Alternatively, one may learn a minimal-volume hypersphere that encapsulates most of the points in feature space. [33]. The free parameters of the model include , the fraction of training errors (samples that lie outside the separating plane), in addition to any parameters of the kernel function. This work uses the one-class SVM implemented by scikit-learn [30], which internally uses libsvm [5]. Query sample scores are given by the negative distance to the separating hyperplane.
5.5 Manhattan distance
Manhattan distance between two vectors and is computed by
| (10) |
where is the dimension of the feature vectors. Query sample scores are given by the negative Manhattan distance to the mean template vector. Thus, training is comprised simply of computing the element-wise mean of the template vectors.
Scaled Manhattan distance was previously shown to achieve state-of-the-art accuracy in keystroke biometric anomaly detection [15], and Manhattan distance closely followed. Scaled Manhattan distance was not used in this work since the number of template samples (4) is not large enough to obtain a reliable estimate of the absolute (or standard) deviation of each feature.
5.6 Partially observable hidden Markov model
The partially observable hidden Markov model (POHMM) is an extension of the hidden Markov model in which hidden states are conditioned on an independent Markov chain [24, 20]. In a two-state model of typing behavior, the subject can be in an active state, during which relatively short time intervals are observed, or passive state, during which relatively long time intervals are observed. The keyboard key names form an independent Markov chain upon which the hidden states are conditioned. The key name partially reveals the hidden state since certain keys, such as Space or Shift, indicate a greater probably of being in a passive state, i.e., of observing longer time intervals, than letter keys, such as H and E. Despite an explosion in the number of model parameters, parameter estimation can still be performed in linear time using a modified Baum-Welch algorithm. A parameter smoothing technique is employed to avoid overfitting the model to short input sequences [20].
Keystroke timing features are modeled by a lognormal distribution, and parameters are initialized based on a one-state model. The POHMM is a free-text model, since it operates on arbitrary keystroke sequences and does not require fixed-length input. Therefore, the POHMM does not use the keystroke alignment or feature extraction algorithms described in Sections 3 and 4, respectively. Query sample scores are given by the model loglikelihood.
5.7 Ensemble
An ensemble of anomaly detectors was formed with the goal of achieving higher accuracy than any individual member. The ensemble score is simply the mean unnormalized score from each system in the ensemble. The sum rule (which is equivalent to a scaled mean) has been shown to be a robust, albeit simple, method of combining classifier output scores, especially when the scores between the systems being combined are independent [18].
6 Score normalization
Per-subject score normalization is employed whereby normalization bounds are determined by the test scores for each subject. Let be the set of scores from subject and be the th score from subject . The normalized score, , is given by
| (11) |
where and are the lower and upper bounds used for normalization. Note that the clamping function ensures the resulting score is in the range . Two methods of score normalization are compared, which differ in the way and are defined.
6.1 SD normalization
In SD normalization, the scores are normalized using the SD of the scores within each subject. Let be the mean score for subject and be the SD score for subject . The lower and upper bounds for normalization are given by
| (12) |
where is a free parameter. In this work, normalizes scores to within 2 SD of the mean.
6.2 Min/max normalization
Min/max normalization is achieved by letting
| (13) |
where and denote the minimum and maximum scores from subject , respectively.
7 Results
| System | Description | Validation | Test | ||
| SD score normalization | |||||
| 1 | Autoencoder {5,4,3} | 7. | 90 (1.91) | 7. | 82 |
| 2 | Variational autoencoder | 6. | 50 (0.75) | 6. | 46 |
| 3 | POHMM | 7. | 75 (1.36) | 7. | 32 |
| 4 | One-class SVM | 7. | 40 (2.20) | 7. | 35 |
| 5 | Contractive autoencoder {400} | 6. | 20 (1.27) | 8. | 02 |
| 6 | Manhattan distance | 6. | 95 (1.17) | 5. | 32 |
| 7 | Autoencoder {5} | 5. | 75 (1.57) | 7. | 95 |
| 8 | Contractive autoencoder {200} | 6. | 50 (1.47) | 8. | 08 |
| 9 | Mean ensemble systems 3,4,5 | 5. | 40 (1.45) | 5. | 68 |
| 10 | Mean ensemble systems 1-8 | 5. | 85 (1.31) | 5. | 91 |
| Min/max score normalization | |||||
| 11 | POHMM | 8. | 75 (1.38) | 10. | 35 |
| 12 | One-class SVM | 12. | 10 (1.63) | 10. | 89 |
| 13 | Contractive autoencoder {400} | 7. | 85 (1.23) | 11. | 20 |
| 14 | Contractive autoencoder {200} | 8. | 00 (1.25) | 11. | 23 |
| 15 | Mean ensemble systems 11-14 | 5. | 75 (1.30) | 6. | 26 |
Hyperparameters, such as hidden layer sizes in the AE models and convergence criteria, were selected from a small range that performed well on the KBOC development set. A validation EER was determined for each system through a Monte Carlo validation procedure using the development dataset. In each repetition, 4 template samples were randomly selected from the genuine samples. The remaining 20 samples (10 genuine and 10 impostor) were used as the query samples. These conditions mimic the test dataset, in which there are 4 labeled template samples and 20 unlabeled query samples for each subject. This process was repeated 10 times to obtain a confidence interval on the EER. System descriptions, including hyper-parameters, are as follows:
- System 1:
-
AE with hidden layers of dimensions {5, 4, 3}. Models were trained for 5000 epochs using gradient descent with a learning rate of 0.5.
- System 2:
-
VAE with hidden layers of dimensions {5, 5}, 3-dimensional Gaussian latent space, and softplus nonlinearities between layers. Parameters were learned by Adam, a stochastic gradient-based optimization algorithm [16], using a learning rate of 0.001, mini-batch size of 2, and 700 epochs.
- Systems 3 and 11:
-
POHMM with two-dimensional log-normal emission (for the press-press latency and duration) and two hidden states. Convergence was reached when the reduction in the loglikelihood was less than 0.01.
- Systems 4 and 12:
-
one-class SVM with , radial basis function (RBF) kernel, and RBF kernel parameter .
- Systems 5 and 13:
-
CAE with hidden layer of dimension 400 and regularization weight . Model parameters were learned by gradient descent with a 0.01 learning rate and 1000 epochs.
- System 6:
-
Manhattan distance.
- System 7:
-
AE with hidden layer of dimension 5.
- Systems 8 and 14:
-
CAE with hidden layer of dimension 200 and regularization weight .
- System 9:
-
Ensemble mean score of systems 3, 4, and 5, which have low score correlations. The correlation between scores of systems 3 and 4 is 0.665, the lowest of any pair that utilized SD score normalization.
- System 10:
-
Ensemble mean score of systems 1-8, which all use SD score normalization.
- System 15:
-
Ensemble mean score of systems 11-14, which use min/max score normalization.
Additionally, systems 1-10 used SD score normalization, and systems 11-15 used min/max score normalization.
The resulting validation and test EERs of the fifteen systems submitted to the KBOC are shown in Table 1. The test EERs were determined by the KBOC organizers, as the ground truth labels of the query samples remained hidden from competition participants. Systems 1-10, which used SD score normalization, generally obtained lower EERs than systems 11-15, which used min/max score normalization. Systems 9 and 15, both ensembles, achieved a lower EER on the test set than any individual member in the ensemble. This is not the case for system 10, which is an ensemble of systems 1-8. Systems 5, 7, and 8 show a significant decrease in performance from the validation EER, suggesting overfitting to the development set due to the chosen hyperparameters.
8 Discussion
8.1 Effects of keystroke alignment
Bours and Komanpally [3] outlined three different scenarios that can occur as a result of typing fixed text, such as password entry:
-
1.
The string that was typed does not match the target string.
-
2.
The string that was typed matches the target string, but contains corrections due to typing errors.
-
3.
The string that was typed matches the target string without making corrections. This is the most commonly assumed scenario in keystroke biometrics, such that the query keystroke sequences exactly match the template sequence.
Bours and Komanpally [3] considered scenario 2, in which sequences could contain extra keystrokes, such as Backspace, due to typing errors. They concluded that system performance generally increased as a result of lower FTC and more data being available. However, their work did not utilize keystrokes outside of the target sequence (.tie5Roanl), as the data was simulated from the fixed-text dataset in Killourhy and Maxion [15] which assumed scenario 3. The KBOC dataset instead reflects scenario 1, in which the string that was typed approximately matches the target string.
In order to further reduce the FTC rate from scenario 2, typed strings that closely match, but slightly differ from, the target string may be retained (scenario 1). The KBOC dataset reflects this, as only case-insensitive matches to the target string were required. This resulted in differing keystroke sequences, and to handle these differences, a keystroke alignment technique was developed. To determine the effect of keystroke alignment, the method proposed in this work is compared to the benchmark alternatives described in Section 3.2:
- Discard:
-
Discard modifier keys, comparing only character keys.
- Truncate:
-
Truncate sequences to the length of the shortest sample.
Table 2 shows the effects of keystroke alignment using a Manhattan distance detector and SD score normalization. The best performance is achieved using the keystroke alignment method. Discarding modifier keys obtains the worst performance, suggesting that the use of modifier keys plays an important role in keystroke biometrics. Truncating sequences to be of equal length results in a slightly higher EER than keystroke alignment. Truncation causes different features to be compared to each other for sequences of differing length. For example, if the template begins with Shift, and the query begins with T, the Shift duration feature will correspond to the T duration feature. This has an adverse effect if the query sample is genuine. However, if the query sample is an impostor, the mismatched features may generally have greater distances than the aligned features, improving overall performance. Note that the validation EERs of the truncation and alignment methods are equal since the length of the samples in the development set did not differ within any of the 10 subjects.
| Discard | Truncate | Align | ||||
|---|---|---|---|---|---|---|
| Validation | 10. | 05 (1.44) | 6. | 95 (1.17) | 6. | 95 (1.17) |
| Test | 9. | 18 | 7. | 33 | 6. | 53 |
8.2 Effects of score normalization
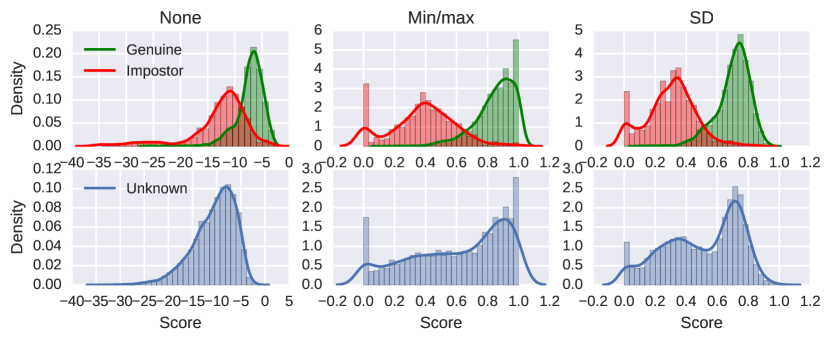
To determine the effects of score normalization, the EER is determined using each normalization method with a Manhattan detector and keystroke alignment. Table 3 contains the results, and Figure 4 shows the resulting score distributions. The unnormalized scores perform significantly worse than either min/max or SD normalization, while SD normalization achieves the best performance. The unnormalized scores of the test set appear to have a unimodal distribution. The min/max normalized scores appear bimodal at 0 and 1 due to the presence of 0 and 1 scores for each subject. This effect is not present in the SD normalized scores, which appear to have a trimodal distribution with peaks at 0 and above the (presumably) expected genuine and impostor scores. Score normalization can have a significant effect on system performance and remains an ongoing area of research [27]. System performance, as measured by either the global or subject EER, is affected by score normalization in three different ways.
| None | Min/max | SD | ||||
|---|---|---|---|---|---|---|
| Validation | 18. | 40 (1.90) | 7. | 55 (0.96) | 6. | 95 (1.17) |
| Test | 21. | 20 | 10. | 43 | 6. | 53 |
First, score normalization places the scores from multiple anomaly detectors on the same scale for the purpose of score-level classifier fusion [12]. Members of an ensemble may correspond to different models for a single modality or to different modalities. Normalization ensures that the scores for each anomaly detector are equally weighted or combined in a way that reflects the relative performance of each underlying model.
Second, score normalization places the scores from different subjects on the same scale. This is only relevant for performance metrics derived from a single global threshold, such as the global ROC curve and global EER. As the score distributions of different subjects vary, a single global threshold may correspond to vastly different FAR and FRR for each subject. To achieve similar FAR and FRR for each subject with a global threshold, the subject scores must be normalized. Score normalization, in this sense, does not greatly affect the subject EER which is based on subject-specific thresholds that vary independently. Specifically, the min/max score normalization described in Section 6.2 results in exactly the same subject EER since the shape of the score distribution for each subject is preserved.
Finally, score normalization can reshape the score distribution within a single subject. This can have the effect of being robust to sample outliers and lead to a better separation of genuine and impostor scores. Like tanh normalization [12], the SD score normalization described in this work is robust to sample outliers, whereas min/max score normalization is sensitive to outliers.
9 Conclusions and future work
The time between data collection sessions for each subject ranged from less than a day to several months, with an average interval of 1 month. This captured a wide range of variability in typing behavior. Despite this, the best system developed in this work (system 6) remained robust over long intervals, as noted in Morales et al. [29], having the lowest decrease in performance when testing query samples collected 2 months after the template (5.09% EER) compared to those collected 4 months after the template (5.10% EER). The relatively small decrease in performance of all systems evaluated in the KBOC (the greatest being a 7% relative increase [29]) may also be attributed to the stabilization of subjects’ templates. Keystroke sequences have been shown to converge towards a total profile, i.e., a stationary feature distribution, with the number of typing repetitions [25]. First and last names are likely practiced many times by the genuine subjects, each template having reached the subject’s total profile.
Manhattan distance is arguably the simplest anomaly detector out of the fifteen systems evaluated in this work since it has no free parameters, yet it achieved the lowest EER on the test dataset of 5.32%. Since feature normalization scales the features by their SD, Manhattan distance in this work is actually similar to the scaled Manhattan distance on the raw features. Taking the best submission (system 6) and using min/max feature normalization yields a validation EER of 8.55 (1.21)% and test EER of 8.60%. This result is consistent with Killourhy and Maxion [15], wherein scaled Manhattan obtained the best performance. Since the publication of Killourhy and Maxion [15], other anomaly detectors, such as Gaussian mixture models [7, 8]777The deep neural network and other methods in Deng and Zhong [7, 8] utilize negative data for training., have achieved only marginally-better performance than the scaled Manhattan distance detector. The relative worse performance of other systems in this work over the Manhattan detector indicates overfitting to the template samples, while an increase in test EER from validation EER indicates overfitting to the development set due to hyperparameter selection.
Unlike other keystroke biometric datasets, such as Killourhy and Maxion [15], the input sequences (first and last name) were unique to each subject in the KBOC dataset. Therefore, only anomaly detection approaches were investigated in this work, as negative data could not practically be utilized for training a discriminative model. Future work could examine the use of negative training data when keystroke sequences are unique to each subject and highly practiced, as is the case in the KBOC dataset.
Lastly, like most previous works, the results is this work reflect asymptotic system performance and may be considered forensics rather than biometrics. Both the min/max and SD score normalization methods utilize statistics of the empirical query score distribution, which requires having observed many query samples. Future work should investigate online score normalization, which is subject to the order in which genuine and impostor samples appear to the system.
References
References
- Abadi et al. [2016] Martın Abadi, Ashish Agarwal, Paul Barham, Eugene Brevdo, Zhifeng Chen, Craig Citro, Greg S Corrado, Andy Davis, Jeffrey Dean, Matthieu Devin, et al. Tensorflow: Large-scale machine learning on heterogeneous distributed systems. arXiv preprint arXiv:1603.04467, 2016.
- Bengio [2009] Yoshua Bengio. Learning deep architectures for ai. Foundations and trends® in Machine Learning, 2(1):1–127, 2009.
- Bours and Komanpally [2014] Patrick Bours and Vathsala Komanpally. Performance of keystroke dynamics when allowing typing corrections. In Biometrics and Forensics (IWBF), 2014 International Workshop on, pages 1–6. IEEE, 2014.
- Brouwer [2009-07-07] Andries Brouwer. Keyboard scancodes, 2009-07-07. URL http://www.win.tue.nl/~aeb/linux/kbd/scancodes-10.html. Visited on 2012-03-20.
- Chang and Lin [2011] Chih-Chung Chang and Chih-Jen Lin. Libsvm: a library for support vector machines. ACM Transactions on Intelligent Systems and Technology (TIST), 2(3):27, 2011.
- Damerau [1964] Fred J Damerau. A technique for computer detection and correction of spelling errors. Communications of the ACM, 7(3):171–176, 1964.
- Deng and Zhong [2013] Yunbin Deng and Yu Zhong. Keystroke dynamics user authentication based on gaussian mixture model and deep belief nets. ISRN Signal Processing, 2013, 2013.
- Deng and Zhong [2015] Yunbin Deng and Yu Zhong. Keystroke dynamics user authentication using advanced machine learning methods. Recent Advances in User Authentication Using Keystroke Dynamics Biometrics, GCSR, 2:23–40, 2015.
- Fierrez et al. [2010] Julian Fierrez, Javier Galbally, Javier Ortega-Garcia, Manuel R Freire, Fernando Alonso-Fernandez, Daniel Ramos, Doroteo Torre Toledano, Joaquin Gonzalez-Rodriguez, Juan A Siguenza, Javier Garrido-Salas, et al. Biosecurid: a multimodal biometric database. Pattern Analysis and Applications, 13(2):235–246, 2010.
- Giot et al. [2015] Romain Giot, Bernadette Dorizzi, and Christophe Rosenberger. A review on the public benchmark databases for static keystroke dynamics. Computers & Security, 55:46–61, 2015.
- Glorot and Bengio [2010] Xavier Glorot and Yoshua Bengio. Understanding the difficulty of training deep feedforward neural networks. In International conference on artificial intelligence and statistics, pages 249–256, 2010.
- Jain et al. [2005] Anil Jain, Karthik Nandakumar, and Arun Ross. Score normalization in multimodal biometric systems. Pattern recognition, 38(12):2270–2285, 2005.
- Killourhy and Maxion [2008] Kevin Killourhy and Roy Maxion. The effect of clock resolution on keystroke dynamics. In International Workshop on Recent Advances in Intrusion Detection, pages 331–350. Springer, 2008.
- Killourhy [2009] Kevin S Killourhy. The role of environmental factors in keystroke dynamics. In IEEE/IFIP International Conference on Dependable Systems and Networks (DSN 2009) Supplemental Volume (Student Forum), pages 125–134, 2009.
- Killourhy and Maxion [2009] Kevin S Killourhy and Roy A Maxion. Comparing anomaly-detection algorithms for keystroke dynamics. In Dependable Systems & Networks, 2009. DSN’09. IEEE/IFIP International Conference on, pages 125–134. IEEE, 2009.
- Kingma and Ba [2014] Diederik Kingma and Jimmy Ba. Adam: A method for stochastic optimization. arXiv preprint arXiv:1412.6980, 2014.
- Kingma and Welling [2013] Diederik P Kingma and Max Welling. Auto-encoding variational bayes. arXiv preprint arXiv:1312.6114, 2013.
- Kittler et al. [1998] Josef Kittler, Mohamad Hatef, Robert PW Duin, and Jiri Matas. On combining classifiers. Pattern Analysis and Machine Intelligence, IEEE Transactions on, 20(3):226–239, 1998.
- Microsoft [2010-06-16] Microsoft. Timers, timer resolution, and development of efficient code, 2010-06-16. URL http://download.microsoft.com/download/3/0/2/3027D574-C433-412A-A8B6-5E0A75D5B237/Timer-Resolution.docx. Visited on 2016-12-28.
- Monaco and Tappert [2016] John V Monaco and Charles C Tappert. The partially observable hidden markov model and its application to keystroke biometrics. arXiv preprint arXiv:1607.03854, 2016.
- Monaco et al. [2013] John V Monaco, Ned Bakelman, Sung-Hyuk Cha, and Charles C Tappert. Recent advances in the development of a long-text-input keystroke biometric authentication system for arbitrary text input. In Intelligence and Security Informatics Conference (EISIC), 2013 European, pages 60–66. IEEE, 2013.
- Monaco et al. [2015a] John V Monaco, Md Liakat Ali, and Charles C Tappert. Spoofing key-press latencies with a generative keystroke dynamics model. In Biometrics Theory, Applications and Systems (BTAS), 2015 IEEE 7th International Conference on, pages 1–8. IEEE, 2015a.
- Monaco et al. [2015b] John V Monaco, Gonzalo Perez, Charles C Tappert, Patrick Bours, Soumik Mondal, Sudalai Rajkumar, Aythami Morales, Julian Fierrez, and Javier Ortega-Garcia. One-handed keystroke biometric identification competition. In Biometrics (ICB), 2015 International Conference on, pages 58–64. IEEE, 2015b.
- Monaco [2015] John Vincent Monaco. Time intervals as a Behavioral Biometric. PhD thesis, Pace University, 2015.
- Montalvão et al. [2015] Jugurta Montalvão, Eduardo O Freire, Murilo A Bezerra Jr, and Rodolfo Garcia. Contributions to empirical analysis of keystroke dynamics in passwords. Pattern Recognition Letters, 52:80–86, 2015.
- Morales et al. [2015a] Aythami Morales, Mario Falanga, Julian Fierrez, Carlo Sansone, and Javier Ortega-Garcia. Keystroke dynamics recognition based on personal data: A comparative experimental evaluation implementing reproducible research. In Biometrics Theory, Applications and Systems (BTAS), 2015 IEEE 7th International Conference on, pages 1–6. IEEE, 2015a.
- Morales et al. [2015b] Aythami Morales, Elena Luna-Garcia, Julian Fierrez, and Javier Ortega-Garcia. Score normalization for keystroke dynamics biometrics. In Security Technology (ICCST), 2015 International Carnahan Conference on. IEEE, 2015b.
- Morales et al. [2016a] Aythami Morales, Julian Fierrez, Marta Gomez-Barrero, Javier Ortega-Garcia, Roberto Daza, John V Monaco, Jugurta Montalvão, Jânio Canuto, and Anjith George. Kboc: Keystroke biometrics ongoing competition. In Biometrics Theory, Applications and Systems (BTAS) IEEE 8th International Conference on. IEEE, 2016a.
- Morales et al. [2016b] Aythami Morales, Julian Fierrez, Ruben Tolosana, Javier Ortega-Garcia, Javier Galbally, Marta Gomez-Barrero, André Anjos, and Sébastien Marcel. Keystroke biometrics ongoing competition. IEEE Access, 4:7736–7746, 2016b.
- Pedregosa et al. [2011] Fabian Pedregosa, Gaël Varoquaux, Alexandre Gramfort, Vincent Michel, Bertrand Thirion, Olivier Grisel, Mathieu Blondel, Peter Prettenhofer, Ron Weiss, Vincent Dubourg, et al. Scikit-learn: Machine learning in python. The Journal of Machine Learning Research, 12:2825–2830, 2011.
- Rifai et al. [2011] Salah Rifai, Pascal Vincent, Xavier Muller, Xavier Glorot, and Yoshua Bengio. Contractive auto-encoders: Explicit invariance during feature extraction. In Proceedings of the 28th international conference on machine learning (ICML-11), pages 833–840, 2011.
- Salthouse [1984] Timothy A Salthouse. Effects of age and skill in typing. Journal of Experimental Psychology: General, 113(3):345, 1984.
- Schölkopf et al. [2001] Bernhard Schölkopf, John C Platt, John Shawe-Taylor, Alex J Smola, and Robert C Williamson. Estimating the support of a high-dimensional distribution. Neural computation, 13(7):1443–1471, 2001.
- Vincent et al. [2008] Pascal Vincent, Hugo Larochelle, Yoshua Bengio, and Pierre-Antoine Manzagol. Extracting and composing robust features with denoising autoencoders. In Proceedings of the 25th international conference on Machine learning, pages 1096–1103. ACM, 2008.