apsrevtex4-1
A Reverse Shock in GRB 160509A
Abstract
We present the second multi-frequency radio detection of a reverse shock in a -ray burst. By combining our extensive radio observations of the Fermi-LAT GRB 160509A at up to days after the burst with Swift X-ray observations and ground-based optical and near-infrared data, we show that the afterglow emission comprises distinct reverse shock and forward shock contributions: the reverse shock emission dominates in the radio band at days, while the forward shock emission dominates in the X-ray, optical, and near-infrared bands. Through multi-wavelength modeling, we determine a circumburst density of , supporting our previous suggestion that a low-density circumburst environment is conducive to the production of long-lasting reverse shock radiation in the radio band. We infer the presence of a large excess X-ray absorption column, , and a high rest-frame optical extinction, mag. We identify a jet break in the X-ray light curve at d, and thus derive a jet opening angle of , yielding a beaming-corrected kinetic energy and radiated -ray energy of erg and erg (1– keV, rest frame), respectively. Consistency arguments connecting the forward and reverse shocks suggest a deceleration time of s , a Lorentz factor of , and a reverse shock to forward shock fractional magnetic energy density ratio of .
Subject headings:
gamma-ray burst: general – gamma-ray burst: individual (GRB 160509A)1. Introduction
Long duration -ray bursts (GRBs) are produced during the catastrophic collapse of massive stars (MacFadyen & Woosley, 1999), their immense luminosity likely powered by relativistic outflows launched from a compact central engine (Piran, 2005). However, the nature of the central engine launching the outflow and the mechanism producing the collimated, relativistic jet remain two urgent open questions, with models ranging from jets dominated by baryons or by Poynting flux, and those with nascent black holes or magnetars providing the central engine (see Kumar & Zhang, 2015, for a review).
A direct means of probing the outflow and thus the nature of the central engine is via the study of synchrotron radiation from the reverse shock (RS), expected when the ejecta first begin to interact with the surrounding medium (Meszaros & Rees, 1993; Sari & Piran, 1999). Consistency arguments between the synchrotron spectrum of the forward shock (FS) and the RS at the time the RS has just crossed the ejecta (the deceleration time, ) allow a measurement of the ejecta Lorentz factor and the ejecta magnetization, i.e., the ratio of the fractional magnetic field energy density of the RS-shocked ejecta to that of the FS-shocked circumburst medium.
Theoretically predicted to produce optical flashes on hour timescales, reverse shocks were expected to be easily observable with the rapid X-ray localization enabled by Swift. However, this signature has only been seen in a few cases in the Swift era, despite optical follow-up observations as early as a few minutes after -ray triggers (see Japelj et al., 2014, for a review). The dearth of bright optical flashes suggests RS emission may instead be easier to observe at longer wavelengths (Mundell et al., 2007; Laskar et al., 2013; Kopac et al., 2015). We have therefore initiated a program at the Karl G. Jansky Very Large Array (VLA) for radio RS studies, and here present the detection of a reverse shock in the Fermi GRB 160509A. Combining our radio observations with X-ray data from Swift and ground-based optical/near-infrared (NIR) observations, we perform detailed modeling of the afterglow in a robust statistical framework to derive the properties of the relativistic ejecta. Following on GRB 130427A (Laskar et al., 2013; Perley et al., 2014), this is the second GRB where multi-frequency radio observations enable detailed characterization of the RS emission. All magnitudes are in the AB system (Oke & Gunn, 1983), times are relative to the LAT trigger time, and uncertainties are reported at 68% (), unless otherwise noted.
2. GRB Properties and Observations
2.1. High-energy: Fermi
GRB 160509A was discovered by the Fermi Large Area Telescope (LAT; Atwood et al., 2009) on 2016 May 09 at 08:59:04.36 UTC (Longo et al., 2016). The burst also triggered the Fermi Gamma-ray Burst Monitor (GBM; Roberts et al., 2016). The burst duration in the 50–300 keV GBM band is s with a 10 keV–1 MeV fluence of erg .
2.2. X-ray: Swift/XRT
The Swift X-ray Telescope (XRT; Burrows et al., 2005) began tiled observations of the LAT error circle 2 hr after the GRB. A fading X-ray transient was discovered at RA = 20h 47m 00.72s, Dec = +76d 06′ 286 (J2000), with an uncertainty radius of 15 (90% containment; Evans, 2016; Kennea, 2016; Kennea et al., 2016).111http://www.swift.ac.uk/xrt_positions/00020607/ The count rate light curve exhibits a break at s. We checked for spectral evolution across the break, by extracting XRT PC-mode spectra using the on-line tool on the Swift website (Evans et al., 2007, 2009) 222http://www.swift.ac.uk/xrt_spectra/00020607/ in the intervals s to s (spectrum 1) and s to s (spectrum 2). We employ HEASOFT (v6.18) and the corresponding calibration files to fit the spectra, assuming a photoelectrically absorbed power-law model with the Galactic neutral hydrogen absorption column fixed at (Willingale et al., 2013), and tying the value of the intrinsic absorption in the host galaxy, , to be the same between the two spectra since we do not expect any evolution in the intrinsic absorption with time. We find only marginal evidence for spectral evolution, with in the first spectrum and in the second. Fixing the two epochs to have the same spectral index, we obtain and an intrinsic absorption column, . We use this value of (corresponding to a spectral index333We use the convention . of ) and an associated counts-to-flux ratio of erg s-1 ct-1 to convert the count-rate to flux density, at 1 keV.
2.3. Optical/NIR
Ground-based observations at Gemini-North beginning at 5.75 hr uncovered a faint source ( mag, mag) consistent with the XRT position (Levan et al., 2016). Subsequent observations by the Discovery Channel Telescope (DCT) d after the LAT trigger showed the source had faded since the Gemini observations, confirming it as the afterglow (Cenko et al., 2016). The red color in the Gemini observations, mag indicated a high redshift or a significant amount of dust extinction within the host galaxy.
Gemini-North - and -band imaging at d revealed an NIR counterpart with mag and mag (Vega magnitudes; Tanvir et al., 2016).444In the absence of reported uncertainties, we assume an uncertainty of 0.3 mag, corresponding to a detection. Spectroscopic observations with Gemini-North at d yielded a single emission line identified as [O II]3727Å at , other identifications being ruled out by the absence of other lines in the spectrum (Tanvir et al., 2016). At this redshift, the inferred isotropic equivalent -ray energy in the 1– keV rest-frame energy band is erg.
We observed GRB 160509A using Keck-I/LRIS (Oke et al., 1995) beginning at d in - and -band with integration times of 972 s and 900 s, respectively. We calibrated the data using a custom LRIS pipeline, and performed photometry using Starfinder (Diolaiti et al., 2000) relative to SDSS stars in the field, obtaining mag and mag at 28.19 d.
| Frequency | Flux density | |
|---|---|---|
| (d) | (GHz) | (Jy) |
| 0.351 | 8.5 | |
| 0.351 | 11.0 | |
| 0.363 | 5.0 | |
| 0.363 | 7.4 | |
| … | … | … |
Note. — This is a sample of the full table available on-line.
2.4. Radio
We observed the afterglow with the VLA starting at 0.36 d. We tracked the flux density of the afterglow over multiple epochs spanning 1.2 to 33.5 GHz, using 3C48, 3C286, and 3C147 as flux and bandpass calibrators, and J2005+7752 as the gain calibrator. We carried out data reduction using the Common Astronomy Software Applications (CASA), and list the results of our VLA monitoring campaign in Table 1.
 |
 |
 |
 |
3. Multi-wavelength Modeling
3.1. Basic Considerations
We interpret the observed behavior of the afterglow from radio to X-rays in the framework of the standard synchrotron model, described by three break frequencies (the self-absorption frequency, , the characteristic synchrotron frequency, , and the cooling frequency, ) and an overall flux normalization, allowing for two possibilities for the density profile of the circumburst medium: the ISM profile (; Sari et al., 1998) and the wind profile (; Chevalier & Li, 2000).
3.1.1 X-rays – location of and a jet break
We fit the Swift XRT light curve as a power-law with two temporal breaks. The first break occurs at d when the decline rate steepens from to (). This steepening does not have a simple explanation in the standard synchrotron model (for instance, the passage of results in a steepening of the light curve by only ). It is possible that the X-ray data before are part of a plateau phase, which is commonly observed among GRB X-ray afterglows (Nousek et al., 2006), and we therefore do not consider the X-ray observations before d in the remainder of our analysis.
At d, the light curve steepens again to (), suggestive of a jet break. Since is expected to be below the X-ray band at this time and the post-break decay rate at is , we determine that the energy index of non-thermal electrons, (Sari et al., 1999). For this value of , we expect a spectral slope of or for and , respectively. The measured X-ray spectral index of requires the former, whereupon we expect . This is consistent with the measured value of . Thus, we conclude that the X-ray light curve and spectrum are both consistent with and . We note that in this regime the X-ray light curve does not distinguish between the ISM and wind models.
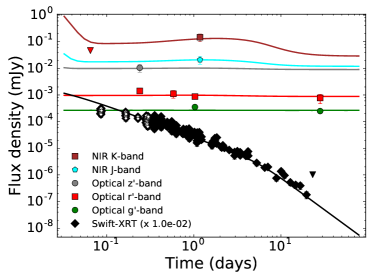
3.1.2 Optical/NIR – Extinction and Host Flux
At the time of the Gemini - and -band observations (0.24 d), the X-ray to -band spectral index is flat, , while the - spectral index is extremely steep, . Given the moderate redshift of the burst, the only explanation for these observations is a large amount of extinction along the sight-line through the GRB host galaxy, suppressing the optical flux. On the other hand, the spectral index between the DCT - and -band observations at d is , significantly shallower than , while the -band light curve before d declines as , shallower than expected in the standard afterglow model. Together, these observations indicate a significant contribution to the afterglow photometry from the host galaxy. This is confirmed by our Keck - and -band observations at d, which yield flux densities similar to the DCT observations at d. We find that modeling the -band light curve as a sum of a power-law and a constant yields , with the additive constant Jy. We note that whereas the light curve decay rate at is expected to provide diagnostic power for the circumburst density profile, the paucity of optical data and the large uncertainty in the optical decay rate for this event preclude such a discrimination. In the detailed modeling (Section 3.3) we fit for the host galaxy flux density in all optical/NIR filters, together with the optical extinction along the line of sight through the host.
3.1.3 Radio – Multiple Components
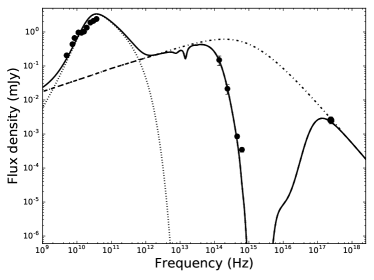
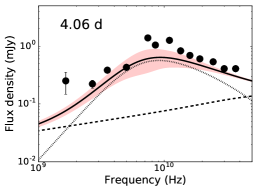
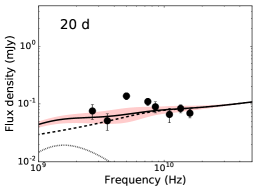
The radio spectral energy distribution (SED) at 4.06 d exhibits a clear peak at GHz with a flux density of mJy. At this time, the measured X-ray flux density is mJy. Fitting the radio data with a broken power-law and extrapolating to the X-rays, we find that the expected X-ray flux density is at least two orders of magnitude lower than observed (Figure 1). This suggests that the radio and X-ray emission at 4.06 d arise from separate processes. Further, we note that the radio spectral index above 10 GHz at 10 d is , in contrast to the spectral index above the peak at 4.06 d, . Since such a hardening of the spectral index is not expected in the standard synchrotron model, we propose that the radio peak at d has faded to reveal a fainter underlying component at 10 d. We show this underlying emission to be consistent with the FS in Section 3.3.
To summarize, the X-ray spectral index and light curve are consistent with a forward shock origin for the X-ray emission with and . The radio spectrum at 4.06 d cannot be extrapolated to match the observed X-ray flux at this time, suggesting that the radio and X-ray emission arise from separate processes. The radio peak at 4.06 d fades to reveal an underlying power-law continuum, which we ascribe to the FS. Finally, there is insufficient information in the afterglow observations to constrain the circumburst density profile.
 |
 |
 |
 |
 |
 |
 |
 |
 |
| Parameter | Value |
|---|---|
| Reverse Shock | |
| Hz | |
| Hz | |
| Hz | |
| mJy | |
| Forward Shock (ISM) | |
| erg | |
| mag | |
| d | |
| Jy | |
| Jy | |
| Jy | |
| Jy | |
| Jy | |
| aaCorrected for beaming. | erg |
| a,ba,bfootnotemark: | erg |
| Hz | |
| Hz | |
| Hz | |
| mJy | |
| Forward Shock (wind) | |
| erg | |
| mag | |
| d | |
| Jy | |
| Jy | |
| Jy | |
| Jy | |
| Jy | |
| aaCorrected for beaming. | erg |
| a,ba,bfootnotemark: | erg |
| Hz | |
| Hz | |
| Hz | |
Note. — All frequencies and flux densities in this table are calculated at 1 d. The host flux density measurements are corrected for Milky Way extinction and are presented for a representative model.
3.2. The Reverse Shock
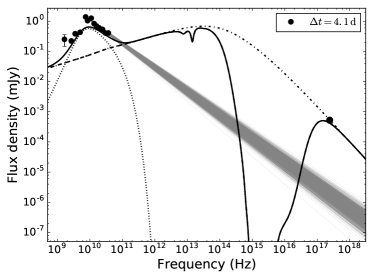
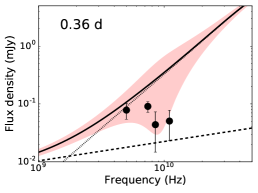
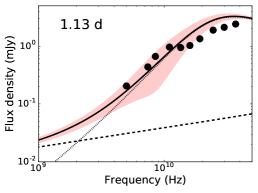
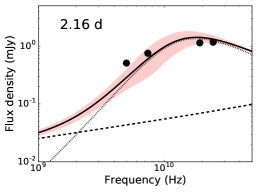
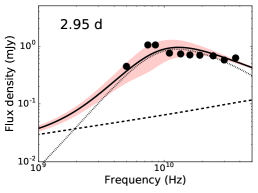
We construct a model SED for the radio to X-ray emission at 1.13 days comprising two emission components: (1) a FS (Section 3.3), which peaks between the radio and optical bands, fits the NIR to X-ray SED, and provides negligible contribution in the radio band, and (2) a RS (this section), which fits the radio SED and provides negligible contribution at higher frequencies. The synchrotron parameters of the RS are listed in Table 2. We find that this combined RS plus FS model completely describes the observed SED at 1.13 days (Figure 1).
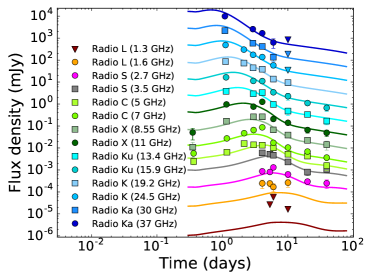
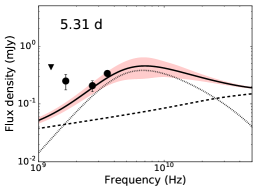
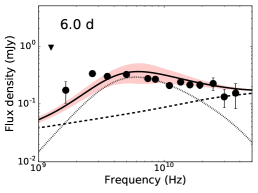
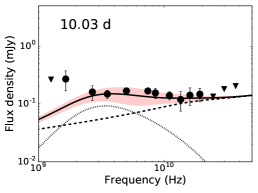
We evolve both emission components to the epochs of our radio observations. The evolution of the RS spectrum depends on whether the shock is Newtonian or relativistic in the frame of the unshocked ejecta, and is determined by the evolution of the ejecta Lorentz factor with radius, quantified by the parameter : . This was first measured observationally for GRB 130427A, where a value of was inferred for a Newtonian RS (Laskar et al., 2013). We find that evolving the RS SED for GRB 160509A with matches the observed radio spectrum well from 0.36 d to 10 d. This value of closely matches the predicted value of from numerical calculations of the RS evolution for a Newtonian RS (Kobayashi & Sari, 2000). A value of expected for a relativistic RS is ruled out by the observed evolution of the radio SED, providing the second direct measurement of , and the first observational confirmation of the numerical theory.
The radio peak ascribed to the RS emission fades faster than expected from the RS model after d. We note that this coincides with the time of the jet break in the X-ray light curve (Section 3.1). The standard FS jet break is a combination of geometrical effects that take place when the FS Lorentz factor, : the observer sees the edge of the jet and the swept-up material begins to expand sideways (Rhoads, 1999; De Colle et al., 2012; Granot & Piran, 2012). In the case of the RS, the ejecta internal energy drops rapidly after the RS crossing and the local sound velocity in the ejecta is expected to be sub-relativistic. Thus, we expect the lateral expansion to be fairly slow, resulting in no change in the dynamics or the scaling of the RS break frequencies across the jet break. The geometric effect is expected to dominate, resulting in a change in the RS peak flux scaling by at . Setting the RS jet break time to 5.2 d as derived from a preliminary fit to the FS (Section 3.3), we find that the resultant evolution of the RS SED fits all subsequent radio observations well (Figure 2).
Finally, we note that passes through the NIR at d in this model. After this time, we do not expect observable RS emission in the optical/NIR. This is consistent with the earliest available -band observation ( mag at d; Izzo et al., 2016), and with all subsequent optical/NIR data.
3.3. The Forward Shock
To model the FS emission we employ the framework of synchrotron radiation from relativistic shocks, including the effects of inverse Compton cooling (Sari & Esin, 2001; Granot & Sari, 2002). The parameters of the fit are the kinetic energy (), the density (), the electron energy index (), and the fraction of the shock energy given to electrons () and magnetic fields (). We use the Small Magellanic Cloud (SMC) extinction curve to model the extinction () in the GRB host galaxy (Pei, 1992), and include the flux density of the host in the bands (), together with the jet break time (), as additional free parameters.
The afterglow observations in this case do not allow us to directly determine the circumburst density profile, and both ISM and wind-like environments have been inferred for GRBs in the past (e.g. Panaitescu & Kumar, 2002; Yost et al., 2003; Cenko et al., 2010, 2011; Schulze et al., 2011). However, we find that consistency arguments between the FS and RS SEDs at the deceleration time provide meaningful results in the ISM case, but not in the wind case. We therefore focus on the ISM model in the remainder of the article, and discuss the wind model briefly in Section 4.3.
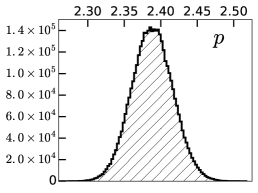
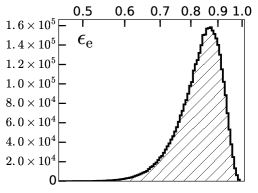
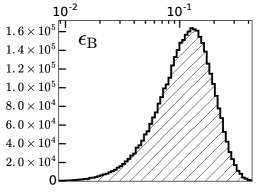
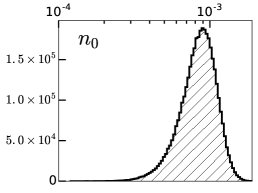
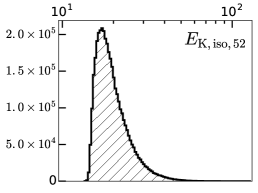
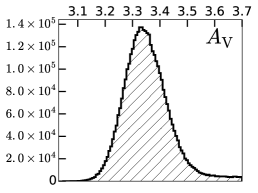
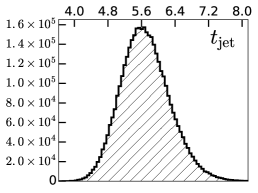
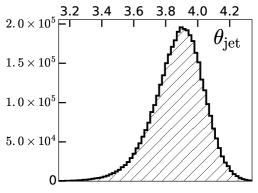
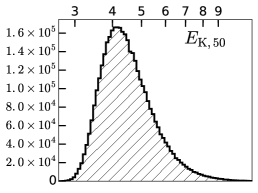
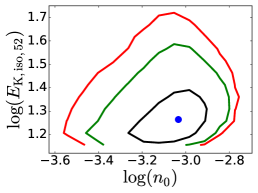
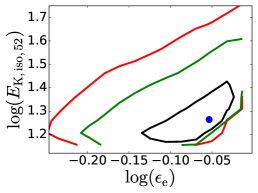
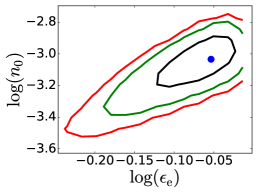
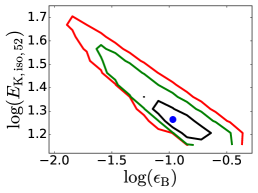
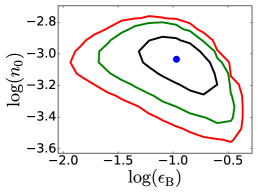
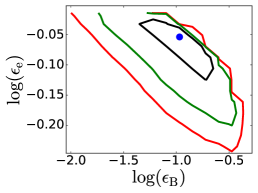
We fit all available photometry with a combination of the RS and FS contributions. A least-squares analysis provides the starting point, using which we find a FS jet break time of d. We fix the RS jet break time to this value. To efficiently sample parameter space and to uncover correlations between the parameters, we then carry out a Markov Chain Monte Carlo (MCMC) analysis using emcee (Foreman-Mackey et al., 2013). Our analysis methods are described in detail by Laskar et al. (2014). The resultant marginalized posterior density functions are summarized in Table 2 and Figure 3. Correlation functions between the four physical parameters are plotted in Figure 4. In our best-fit model ( for 12 degrees of freedom), the FS transitions from fast cooling to slow cooling at d, while the Compton Y-parameter is , indicating that inverse-Compton cooling is moderately significant.
 |
 |
 |
 |
 |
 |
 |
 |
 |
 |
 |
 |
 |
 |
 |
4. Discussion
4.1. Self-consistency of RS and FS models
In the standard synchrotron model, the break frequencies of the RS and FS spectra are expected to be related at : , , and , where is the bulk Lorentz factor at , and is the ejecta magnetization parameter (Gomboc et al., 2008; Harrison & Kobayashi, 2013). The three relations above then provide three constraints that can be solved exactly for , , and . For our best-fit FS+RS model, we find s , , and . We note that the derived values of , , , and can be used to derive a jet break time for the RS using the relation, d (Gao et al., 2013). Using the best-fit FS model, we find d, which is slightly earlier than the FS jet break time, as expected. The difference between this value and our assumed value of d in Section 3.2 only marginally affects the fit at one of the epochs (4.06 d) in Figure 2. A fully consistent solution requires bootstrapping the FS and RS parameters together, and we defer such an analysis to future work.
4.2. Low-density Environments and the RS
In our previous work on GRB 130427A, we suggested that a slow-cooling RS is more likely to produce detectable radio emission (Laskar et al., 2013). Since at , a low-density environment may be a requisite factor for observing long-lasting RS emission (Kobayashi, 2000; Resmi & Zhang, 2016). We find a low circumburst density in the context of long-lasting reverse shock emission for GRB 160509A, leading credence to this hypothesis. However, we also note that additional considerations such as high or late deceleration times may also contribute to stronger RS signatures; therefore, the detectability of a RS remains a complex question (Kopac et al., 2015).
4.3. Wind Model
Since the available afterglow observations do not distinguish strongly between a wind and ISM model, we also provide the parameters for a fiducial wind model (Table 2). For this model, the spectrum transitions from fast cooling to slow cooling at 0.17 d, and the spectral break frequencies at 1 d are within a factor of of the values derived for the ISM model in Section 3.3. We note that the value of for the RS remains plausible in the wind environment as well and, therefore, the RS parameters derived in Section 3.2 remain reasonable. Combining the RS and FS parameters for the wind model, we find s, , and . The low value of , the low inferred magnetization, and finding , together argue against the wind model (Fenimore et al., 1993; Woods & Loeb, 1995).
4.4. Neutral Hydrogen Column Density and Extinction
A correlation between the neutral hydrogen column derived from X-ray absorption and the line-of-sight extinction, , has been observed for the Milky Way (Predehl & Schmitt, 1995; Güver & Özel, 2009). However, the majority of GRB afterglows exhibit lower values of than would be expected from this correlation (e.g., Galama & Wijers, 2001; Stratta et al., 2004; Zafar et al., 2010; Zauderer et al., 2013). We note that the extinction of GRB afterglows by their host galaxy is often well fit with an SMC extinction curve (as we also do here; Japelj et al., 2015). We therefore derive a corresponding correlation for the SMC using the relation between and from Welty et al. (2012) and the mean for the SMC bar from Gordon et al. (2003), obtaining . For , this gives or mag, while the MW correlation gives mag. Our observed value of mag is, therefore, intermediate between the values expected from the two relations.
5. Conclusions
We present a detailed multi-wavelength study of the Fermi-LAT GRB 160509A at . Our VLA observations spanning – days after the burst clearly reveal the presence of multiple spectral components in the radio afterglow. We identify the two spectral components as arising from the forward and reverse shock, and from a joint analysis of the two emission components, we conclude:
-
•
The reverse shock dominates in the radio before d, and the forward shock dominates in the X-ray and optical/NIR.
-
•
The evolution of the reverse shock spectrum requires a Lorentz factor index, , consistent with theoretical predictions for a Newtonian RS. We derive a deceleration time of s, a Lorentz factor of at the deceleration time, and an ejecta magnetization of .
-
•
The afterglow observations do not strongly constrain the density profile of the circumburst environment. However, the RS-FS consistency relations yield a very low Lorentz factor in the wind environment.
-
•
We derive a circumburst density of , supporting the hypothesis that a low density environment may be a requisite factor in producing a slow-cooling and long-lasting RS.
This work follows on our previous successful identification and characterization of a reverse shock in GRB 130427A, and highlights the importance of rapid-response radio observations in the study of the properties and dynamics of GRB ejecta.
References
- Atwood et al. (2009) Atwood, W. B., et al. 2009, ApJ, 697, 1071
- Burrows et al. (2005) Burrows, D. N., et al. 2005, Space Sci. Rev., 120, 165
- Cenko et al. (2011) Cenko, S. B., et al. 2011, ApJ, 732, 29
- Cenko et al. (2010) Cenko, S. B., et al. 2010, ApJ, 711, 641
- Cenko et al. (2016) Cenko, S. B., Troja, E., & Tegler, S. 2016, GRB Coordinates Network, 19416
- Chevalier & Li (2000) Chevalier, R. A., & Li, Z.-Y. 2000, ApJ, 536, 195
- De Colle et al. (2012) De Colle, F., Ramirez-Ruiz, E., Granot, J., & Lopez-Camara, D. 2012, ApJ, 751, 57
- Diolaiti et al. (2000) Diolaiti, E., Bendinelli, O., Bonaccini, D., Close, L., Currie, D., & Parmeggiani, G. 2000, ApJ, 147, 335
- Evans (2016) Evans, P. A. 2016, GRB Coordinates Network, 19406
- Evans et al. (2009) Evans, P. A., et al. 2009, MNRAS, 397, 1177
- Evans et al. (2007) Evans, P. A., et al. 2007, A&A, 469, 379
- Fenimore et al. (1993) Fenimore, E. E., Epstein, R. I., & Ho, C. 1993, A&AS, 97, 59
- Foreman-Mackey et al. (2013) Foreman-Mackey, D., Hogg, D. W., Lang, D., & Goodman, J. 2013, PASP, 125, 306
- Galama & Wijers (2001) Galama, T. J., & Wijers, R. A. M. J. 2001, ApJ, 549, L209
- Gao et al. (2013) Gao, H., Lei, W.-H., Zou, Y.-C., Wu, X.-F., & Zhang, B. 2013, New Astronomy Reviews, 57, 141
- Gomboc et al. (2008) Gomboc, A., et al. 2008, ApJ, 687, 443
- Gordon et al. (2003) Gordon, K. D., Clayton, G. C., Misselt, K. A., Landolt, A. U., & Wolff, M. J. 2003, ApJ, 594, 279
- Granot & Piran (2012) Granot, J., & Piran, T. 2012, MNRAS, 421, 570
- Granot & Sari (2002) Granot, J., & Sari, R. 2002, ApJ, 568, 820
- Güver & Özel (2009) Güver, T., & Özel, F. 2009, MNRAS, 400, 2050
- Harrison & Kobayashi (2013) Harrison, R., & Kobayashi, S. 2013, ApJ, 772, 101
- Izzo et al. (2016) Izzo, L., de Ugarte Postigo, A., & Thoene, C. 2016, GRB Coordinates Network, 19409
- Japelj et al. (2015) Japelj, J., et al. 2015, A&A, 579, A74
- Japelj et al. (2014) Japelj, J., et al. 2014, ApJ, 785, 84
- Kennea (2016) Kennea, J. A. 2016, GRB Coordinates Network, 19407
- Kennea et al. (2016) Kennea, J. A., Roegiers, T. G. R., Osborne, J. P., & Page, K. L. e. a. 2016, GRB Coordinates Network, 19408
- Kobayashi (2000) Kobayashi, S. 2000, ApJ, 545, 807
- Kobayashi & Sari (2000) Kobayashi, S., & Sari, R. 2000, ApJ, 542, 819
- Kopac et al. (2015) Kopac, D., et al. 2015, ApJ, 806, 179
- Kumar & Zhang (2015) Kumar, P., & Zhang, B. 2015, Phys. Rep., 561, 1
- Laskar et al. (2014) Laskar, T., et al. 2014, ApJ, 781, 1
- Laskar et al. (2013) Laskar, T., et al. 2013, ApJ, 776, 119
- Levan et al. (2016) Levan, A. J., Tanvir, N. R., Cenko, S. B., & Perley, D. 2016, GRB Coordinates Network, 19410
- Longo et al. (2016) Longo, F., Bissaldi, E., Bregeon, J., McEnery, J., Ohno, M., & Zhu, S. 2016, GRB Coordinates Network, 19403
- MacFadyen & Woosley (1999) MacFadyen, A. I., & Woosley, S. E. 1999, ApJ, 524, 262
- Meszaros & Rees (1993) Meszaros, P., & Rees, M. J. 1993, ApJ, 405, 278
- Mundell et al. (2007) Mundell, C. G., et al. 2007, ApJ, 660, 489
- Nousek et al. (2006) Nousek, J. A., et al. 2006, ApJ, 642, 389
- Oke et al. (1995) Oke, J. B., et al. 1995, PASP, 107, 375
- Oke & Gunn (1983) Oke, J. B., & Gunn, J. E. 1983, ApJ, 266, 713
- Panaitescu & Kumar (2002) Panaitescu, A., & Kumar, P. 2002, ApJ, 571, 779
- Pei (1992) Pei, Y. C. 1992, ApJ, 395, 130
- Perley et al. (2014) Perley, D. A., et al. 2014, ApJ, 781, 37
- Piran (2005) Piran, T. 2005, Rev. Mod. Phys., 76, 1143
- Predehl & Schmitt (1995) Predehl, P., & Schmitt, J. H. M. M. 1995, A&A, 293
- Resmi & Zhang (2016) Resmi, L., & Zhang, B. 2016, ArXiv e-prints
- Rhoads (1999) Rhoads, J. E. 1999, ApJ, 525, 737
- Roberts et al. (2016) Roberts, O. J., Fitzpatrick, G., & Veres, P. 2016, GRB Coordinates Network, 19411
- Sari & Esin (2001) Sari, R., & Esin, A. A. 2001, ApJ, 548, 787
- Sari & Piran (1999) Sari, R., & Piran, T. 1999, ApJ, 520, 641
- Sari et al. (1999) Sari, R., Piran, T., & Halpern, J. P. 1999, ApJ, 519, L17
- Sari et al. (1998) Sari, R., Piran, T., & Narayan, R. 1998, ApJ, 497, L17
- Schulze et al. (2011) Schulze, S., et al. 2011, A&A, 526, A23
- Stratta et al. (2004) Stratta, G., Fiore, F., Antonelli, L. A., Piro, L., & De Pasquale, M. 2004, ApJ, 608, 846
- Tanvir et al. (2016) Tanvir, N. R., et al. 2016, GRB Coordinates Network, 19419
- Welty et al. (2012) Welty, D. E., Xue, R., & Wong, T. 2012, ApJ, 745, 173
- Willingale et al. (2013) Willingale, R., Starling, R. L. C., Beardmore, A. P., Tanvir, N. R., & O’Brien, P. T. 2013, MNRAS, 431, 394
- Woods & Loeb (1995) Woods, E., & Loeb, A. 1995, ApJ, 453, 583
- Yost et al. (2003) Yost, S. A., Harrison, F. A., Sari, R., & Frail, D. A. 2003, ApJ, 597, 459
- Zafar et al. (2010) Zafar, T., Watson, D. J., Malesani, D., Vreeswijk, P. M., Fynbo, J. P. U., Hjorth, J., Levan, A. J., & Michalowski, M. J. 2010, A&A, 515, A94
- Zauderer et al. (2013) Zauderer, B. A., et al. 2013, ApJ, 767, 161