nkimani@mpifr-bonn.mpg.de 22institutetext: Argelander-Institut für Astronomie, Auf dem Hügel 71, D-53121 Bonn, Germany 33institutetext: Onsala Space Observatory, Chalmers Univ. of Technology, 43992, Onsala, Sweden 44institutetext: Astron. Dept., King Abdulaziz University, P.O. Box 80203, Jeddah 21589, Saudi Arabia 55institutetext: Department of Astrophysics, Radboud University Nijmegen, Postbus 9010, NL-6500 GL Nijmegen, The Netherlands 66institutetext: ASTRON, Postbus 2, NL-7990 AA Dwingeloo, The Netherlands 77institutetext: Jodrell Bank Centre for Astrophysics, School of Physics and Astronomy, The university of Manchester, Oxford Road, Manchester M13 9PL, United Kingdom 88institutetext: Academia Sinica Institute of Astronomy and Astrophysics, 645 N. Aóhoku Place, Hilo, HI 96720, USA
The radio evolution of supernova SN 2008iz in M 82
We report on multi-frequency Very Large Array (VLA) and Very Long Baseline Interferometry (VLBI) radio observations for a monitoring campaign of supernova SN 2008iz in the nearby irregular galaxy M 82. We fit two models to the data, a simple time power-law, S tβ, and a simplified Weiler model, yielding decline indices, of -1.220.07 (days 100-1500) and -1.410.02 (days 76-2167), respectively. The late-time radio light curve evolution shows flux-density flares at 970 and 1400 days which are a factor of 2 and 4 higher than the expected flux, respectively. The later flare, besides being brighter, does not show signs of decline at least from results examined so far (2014 January 23; day 2167). We derive the spectral index, , S for frequencies 1.4 to 43 GHz for SN 2008iz during the period from 430 to 2167 days after the supernova explosion. The value of shows no signs of evolution and remains steep 1 throughout the period, unlike that of SN 1993J which started flattening at day 970. From the 4.8 and 8.4 GHz VLBI images, the supernova expansion is seen to start with shell like structure that gets more and more asymmetric, then breaks up in the later epochs with bright structures dominating the southern part of the ring. This structural evolution differs significantly from SN 1993J, which remains circularly symmetric over 4000 days after the explosion. The VLBI 4.8 and 8.4 GHz images are used to derive a deceleration index, , for SN 2008iz, of 0.86 0.02, and the average expansion velocity between days 73 and 1400 as (12.10.2)103 km s-1. From the energy equipartition between magnetic field and particles, we estimate the minimum total energy in relativistic particles and the magnetic fields and particles, we estimate the minimum total energy in relativistic particles and the magnetic fields during the supernova expansion and also find the magnetic field amplification factor for SN 2008iz to be in the range of 55 – 400.
Key Words.:
Galaxies:individual; M 82- radio continuum: stars-supernovae:individual; SN2008iz1 Introduction.
Radio-loud supernovae are rare events with just a few dozen detected (Weiler et al. 2002). The majority of them are relatively distant or fairly weak, making them difficult to study in great detail. To
date, the best known example is SN 1993J in M 81 (Martí-Vidal
et al. 2011a, b
and references therein), which has been studied extensively due to
its proximity (3.63 Mpc, Freedman et al. 1994), environment
(which allows for multi-wavelength studies) and galaxy orientation
(M 81 is almost face-on). The discovery of SN 2008iz (Brunthaler et al. 2009a)
offers the possibility to study another supernova at a very similar
distance in great detail and to make a comparison to SN 1993J.
For instance, considering the peak 5 GHz radio luminosities, SN 2008iz
at L5GHz24.41026 ergs-1Hz-1
is comparable to SN 1993J at L5GHz15.51026 ergs-1Hz-1 (van Dyk et al. 1994). The two supernovae are also comparable in the time they took to reach their peak after the explosion, with SN 2008iz
taking 125 days while SN 1993J took 133 days (Weiler et al. 2007).
SN 2008iz was discovered in M 82, which is a nearby irregular (IO)
galaxy forming part of M 81 group. This galaxy harbours numerous bright
radio supernova remnants with the current estimate at 50 supernovae
(Muxlow et al. 1994; Beswick et al. 2006; Fenech et al. 2008; Kronberg et al. 2000; Weiler et al. 2002).
Supernova 2008iz was discovered in 2009 April as a bright radio transient
(Brunthaler et al. 2009a, b). The explosion date of the
supernova is estimated to be 2008 February 186 days (Brunthaler et al. 2009b; Marchili et al. 2010).
The discovery was made at radio wavelengths with the VLA at 22 GHz
(Brunthaler et al. 2009a) and confirmed with MERLIN (Muxlow et al. 2009; Beswick et al. 2009)
and the Urumqi 25 meter telescope at 5 GHz (Marchili et al. 2010). Endeavours to make detections in other astronomical windows have never been successful. For instance, there are no detections in visible light and the X-Ray regimes (Brunthaler et al. 2009b). Varenius et al. (2015) also report the LOFAR (Low-Frequency Array for Radio Astronomy) non-detection at 154 MHz. However, a detection of the near-IR counterpart for SN 2008iz at 480 days was reported by Mattila et al. (2013) after careful analyses using image subtraction technique and considering possible uncertainties caused by the differing filter response functions between the Gemini-North telescope and the HST. Overall, this makes it challenging to classify this supernova. Nevertheless, since no type Ia supernova has yet been detected in the radio regime in M 82 (Pérez-Torres et al. 2014), we can firmly say that SN 2008iz is a core collapse supernova, in agreement with both Brunthaler et al. (2009b) and Mattila et al. (2013).
The position of supernova SN 2008iz is estimated to be ,
(Brunthaler et al. 2009b) which is 2.5′′ (43 pc)
South-West of the photometric center of M 82 based on the 2.2m
peak (Weiß et al. 2001). The location of the supernova is heavily obscured by dust and gas, hiding the region from direct observations at optical wavelengths (Weiß et al. 2001). Brunthaler et al. (2010) estimated the extinction towards SN 2008iz to be 24.4 mag, concluding that the supernova non-detections was because it exploded behind a large dusty interstellar cloud. However, using the same data and relations Mattila et al. (2013) obtained a total extinction of 48.9 mag suggesting that the authors may have missed to multiply the value of N(H2) by 2 to convert to hydrogen nuclei before applying the extinction relation of Güver & Özel (2009). The near-IR detection could indicate that the supernova was located in the foreground with most of the H2 column density behind the site of SN 2008iz (Mattila et al. 2013).
VLBI observations reveal the expansion of SN 2008iz to be self-similar with an expansion velocity of 21 000 km s-1 over the first 430 days
after the explosion, making it one of the fastest expanding radio
supernovae, with an expansion index, , of 0.890.03 (Brunthaler et al. 2010).
The modeled light curve by (Marchili et al. 2010) shows that synchrotron
self-absorption (SSA) is negligible, making free-free absorption (FFA)
the most significant process during the supernova expansion.
Radio monitoring of SN 2008iz with VLA and VLBI has been ongoing
on a regular basis since its discovery. We describe the monitoring
and data reduction process in section 2. In section 3 we present multi-frequency
radio observations from 36 to 2167 days after the explosion. In
section 4 we discuss the variations of the spectral index ,
equipartition minimum energy and magnetic fields, the evolution of
the magnetic field evolution Beq and its amplification.
We present our summary in section 5.
2 Observations and data calibration
The radio monitoring campaign conducted with the VLA, at 1.4, 4.8, 8.4, 22, and 43 GHz to trace the evolution of the radio emission from SN 2008iz has been ongoing since its discovery in 2008. The first series of observations is archival and corresponds to the data published by (Brunthaler et al. 2009b, 2010). It consists of six observations (epochs 1 - 6 in table 1) obtained between 2008 March 24 (day 36) and 2009 September 19 (day 580). For details on the observations of those epochs, the reader is referred to their publications. For the later observations, the data were taken in the standard continuum observation mode with a total bandwidth of 128 MHz, each in dual circular polarisation. During these epochs, observations were done in VLA configurations A, AB, B, and C. Flux density measurements were derived using calibrator 3C 48. The flux calibrator was observed for a total time of 2 minutes in each observation. The observation used a switching cycle of six minutes, spending on average 1 minute on the phase calibrator J1048+7143 and 5 minutes on M 82. The cycles were repeated 5 times over the observations, yielding an integration time of 25 minutes on M 82 at each frequency.
The last epoch of VLA observations on 2014 January 23 was obtained during a confirmation search of a newly discovered Type Ia supernova, SN 2014j at C and K bands under the observation code TOBS0008 at configuration AB. Data were taken in the standard continuum observation mode with a total bandwidth of 128 MHz, each in dual circular polarisation. The flux calibrator 3C 48 was observed for a total time of 3 minutes. The observation used a switching cycle of 9 minutes, spending an average time of 30 seconds on the phase calibrator J1048+7143 and 8 minutes on M 82. The cycle was repeated 4 times over the observation, yielding an integration time of 32 minutes on M 82 at both frequencies.
The VLA observations in this work are matched by high resolution VLBI observations at 1.6, 4.8, and 8.4 GHz. These were taken with a network consisting of the Very Long Baseline Array (VLBA), the Green Bank 100 meter telescope and the Effelsberg 100 meter telescope leading to a maximum resolution of 4.3 milliarcseconds (mas) at 1.6 GHz, 1.2 mas at 4.8 GHz, and 0.8 mas at 8.4 GHz. SN 2008iz was observed 15 times between 2009 October and 2013 January in dual polarisation. The total bandwidth of most datasets is 64 MHz, although two datasets have a bandwidth of 32 MHz and three have a bandwidth 260 MHz wide. The fluxes were calibrated using system temperature measurements and standard gain curves, and the AGN in M 81 (M 81*) was used as a phase reference calibrator. The calibrator J1048+7143 was observed several times during each observation run, each time for 90 to 120 seconds. SN 2008iz and M 81* were observed in turns for 45 to 55 seconds at 1.6 GHz and 80 seconds at 4.8, and 8.4 GHz during each observation run.
The VLA and VLBI data were reduced using standard packages within the AIPS (Astronomical Image Processing Software) of the National Radio Astronomy Observatory (NRAO). To ascertain the late-time enhancement of flux values, which are much higher than expected from the supernova radio light curve, the VLA data was run using “CASA-EVLA_pipeline1.1.3” of NRAO for all epochs after 2009 September 19. The results from both data reduction procedures are in agreement.
3 Results
Tables 1 and 2 contain the complete VLA and VLBI logs of radio flux measurements of SN 2008iz. The first column in each table lists the observation dates. The second column lists the number of days elapsed since explosion, which is estimated to be 2008 February 18 (6) (Marchili et al. 2010) while the rest of the columns lists the integrated/peak flux density or source size at different frequencies. To minimize the contribution of the diffuse emission in M 82 on the supernova measurements, we use only baselines longer than 30 k in the imaging. The AIPS task ‘JMFIT’ is used to determine the flux by fitting a 2D Gaussian to the identified compact supernova source. The flux errors of the VLA observations are derived by adding in quadrature the formal errors from the 2D Gaussian, a 5% systematic error, and a small random error derived as the difference between peak and integrated flux densities. The errors of the VLBI 1.6 GHz fluxes are derived in a similar way; adding in quadrature the formal errors from 2D Gaussian fit to the sources, and a 9% systematic error. However, the supernova is resolved at 4.8 and 8.4 GHZ in the VLBI data, thus their integrated fluxes cannot be derived in the same way as for the other observations. In table 2, we list the peak intensities at 4.8 and 8.4 GHz.
3.1 Light curve
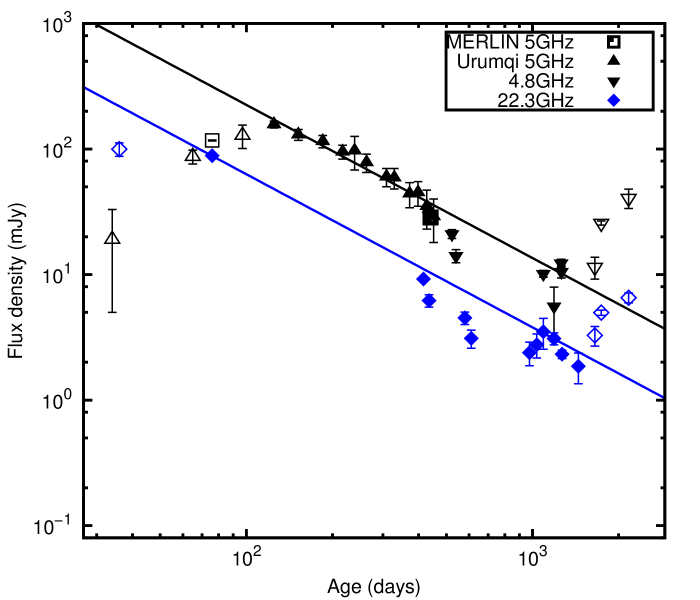
The light curve of SN 2008iz is well fit by a power-law of the form,
| (1) |
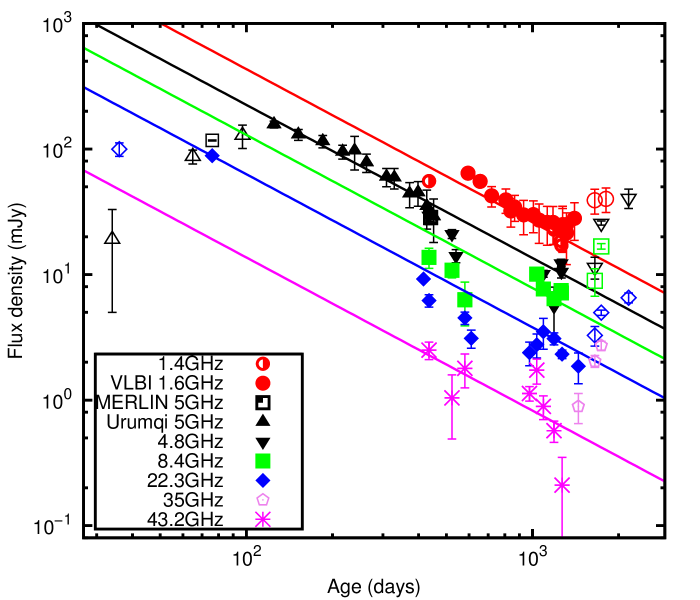
especially in the well-sampled optically thin regime, i.e., 5 and 22 GHz (see Fig. 1). is a flux scaling factor which does not change the overall behaviour of the fit, (tt0) is the time elapsed after the explosion date, while is the flux decay index. The obtained fit results (see Fig. 1) with and as free parameter at 5 GHz (100 – 1500 days) are = (6.292.22)104 mJy and =1.220.07. The time range 0 – 100 days is excluded because the radio emission from the supernova shock wave was still within the optically-thick regime, while the last epochs of the data sets have their peak intensity higher than expected from the light curve. The obtained fit value at 22 GHz (50 – 1500 days) with both and as free parameters yields = (1.460.33)104 mJy and =1.180.05. Considering the 5 GHz data set, which is better sampled over the time range than the one at 22 GHz, we adopt a value of 1.220.07 to be more representative. Fitting the 22 GHz data with our adopted value, we obtain the scaling parameter to be (1.730.10)104 mJy. A fit to all frequencies (Fig. 3) using one single value of -1.220.07 yields a different value for each frequency. The values of are = (1.190.60)105 mJy, = (6.190.17)104 mJy, = (3.570.40)104 mJy, = (1.730.1)104 mJy, = (3.770.52)103 mJy. The derived scaling factor yields a normalised average spectrum that depends on frequency as shown in Fig.2.
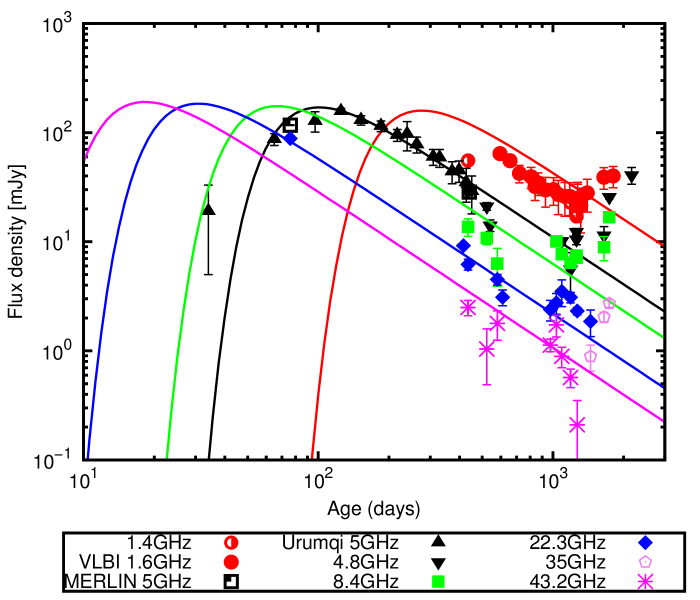
Although the simple power-law (see equation 1) describes the optically-thin regime of the light curve very well, a complete fit to the supernova light curve model is not possible because we have data for only very few epochs in the optically-thick regime. For the complete radio light curve, we fit the simplified Weiler model (Weiler et al. 2007) described as
| (2) |
where K1 is a scaling factor in Jy and is the spectral index of the emission in the optically-thin regime. The exponent is related to the flux density drop at late epochs, normally affected by both the spectral index, , and the opacity, . The date of explosion is denoted as t0 and t is the epoch of observation. The opacity of thermal electrons of the circumstellar medium (CSM) in equation 2 is modeled as
| (3) |
where K2 is the scaling factor and is the absorption decline index related to the CSM radial density profile derived as =3. The exponent 2.1 corresponds to the spectral dependence of FFA by thermal ionised gas in the radio regime.
To constrain the simplified Weiler model, we apply the best-fit parameters of the model 2 and 3 obtained by (Marchili et al. 2010) at 5 GHz (i.e. K1=(2.140.04)105 mJy, =1.430.05, t0=18 Feb 2008, =(11.00.7)104 mJy, =2.650.10) and from (Brunthaler et al. 2010) we obtain the spectral index, =1.080.08. We fit all frequencies at the same time as shown in Fig.4 using as a free parameter, for which a value of 1.410.02 is determined.
The model fits satisfactorily the flux density decline from day 500 except for the 1.4 GHz observations that fall well below the model fit on Fig. 4. The lower flux densities at 1.4 GHz are also confirmed by a 3 LOFAR non-detection limit of SN 2008iz at a level of 0.41mJy/beam at the even lower frequency of 154 MHz (Varenius et al. 2015). The plausible explanations could be FFA from a dense foreground screen along the line of sight. Other effects, like low-frequency cut-off caused by Razin-Tsytovich effect could also help explain the lower 1.4 GHz flux and LOFAR non-detection. From the same figure, the observations at 43.2 GHz drop quite fast past 1000 days. This drop is most likely related to synchrotron ageing of the emitting electrons in the shocked CSM.

3.2 Deceleration of SN 2008iz
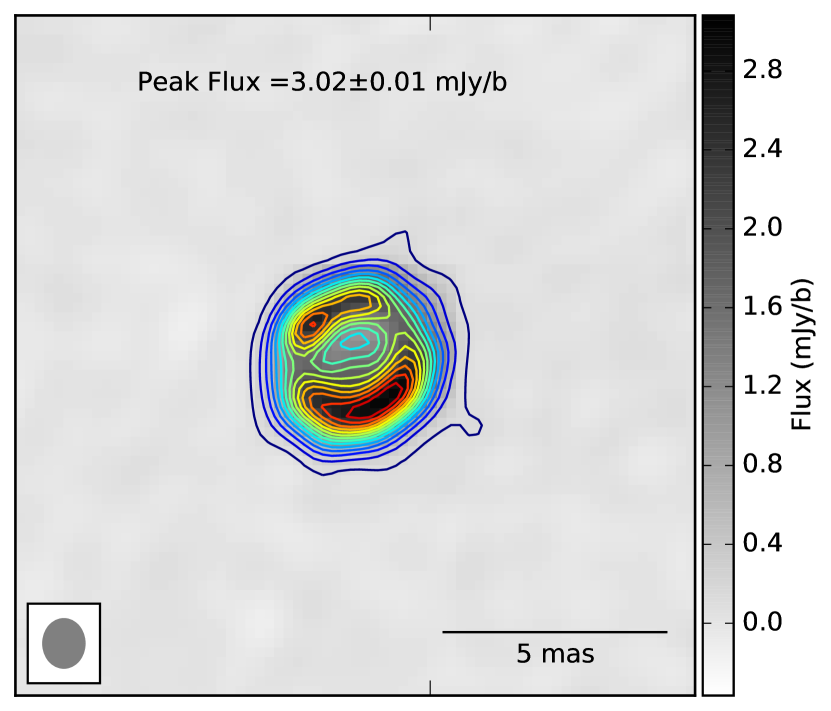
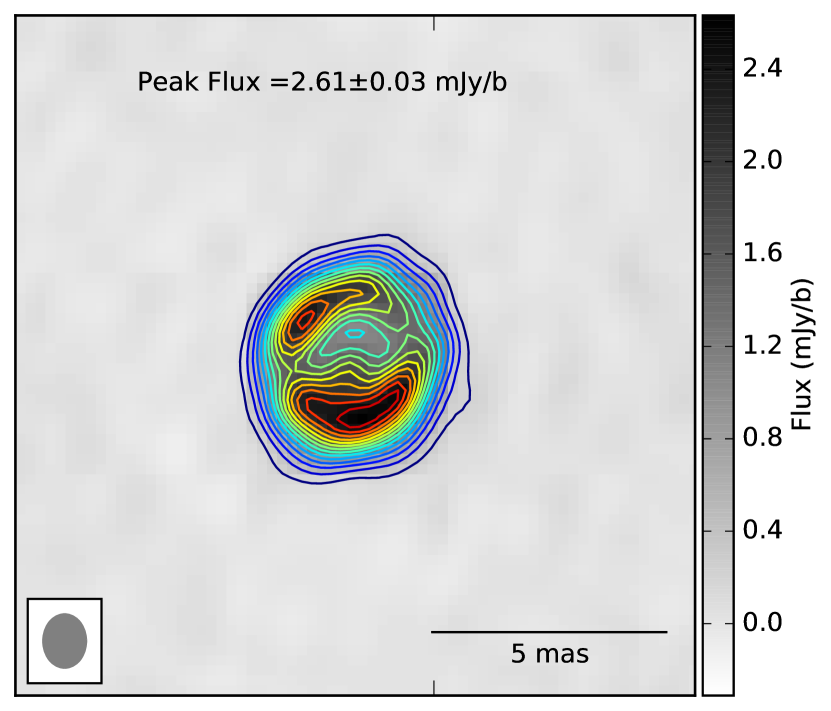
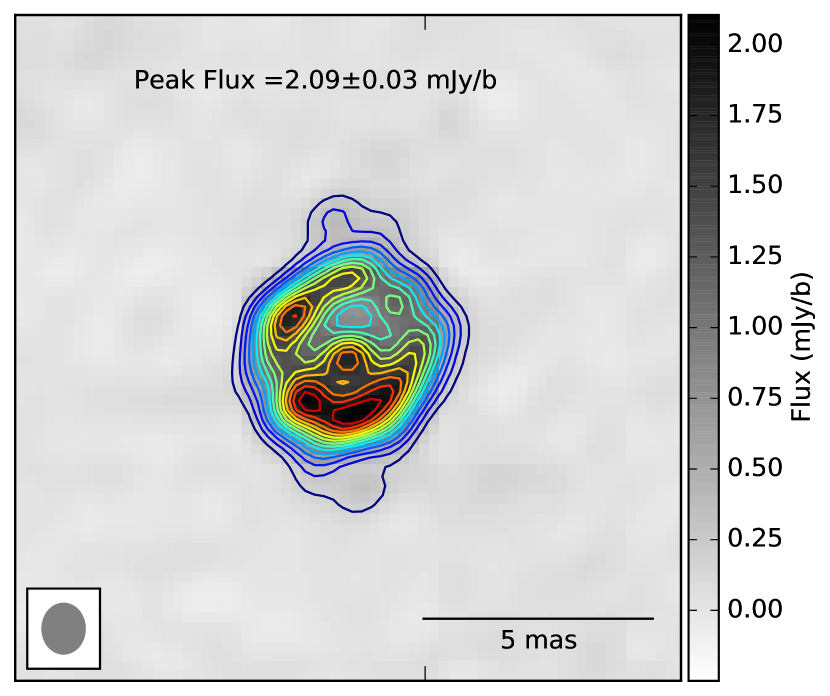
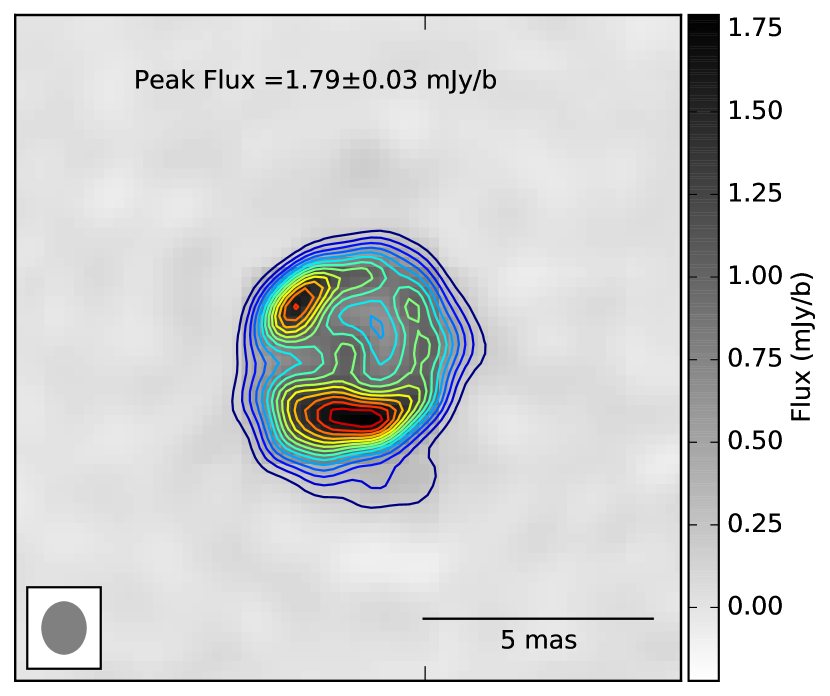
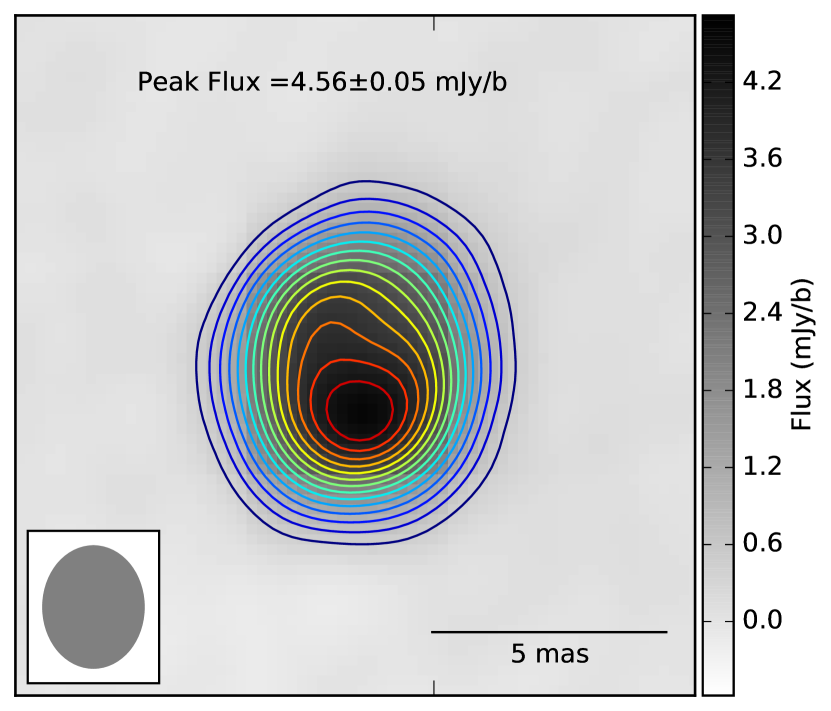
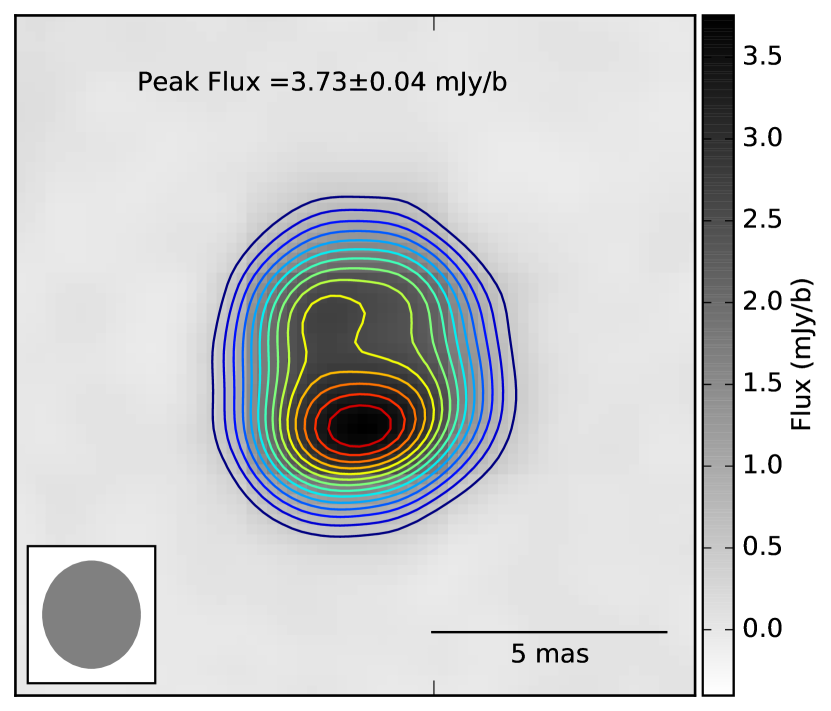
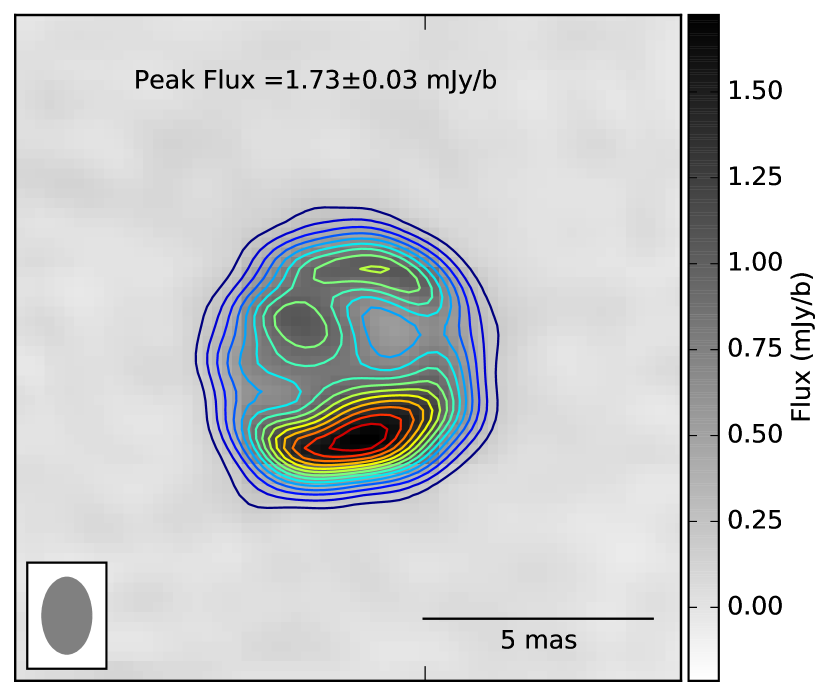
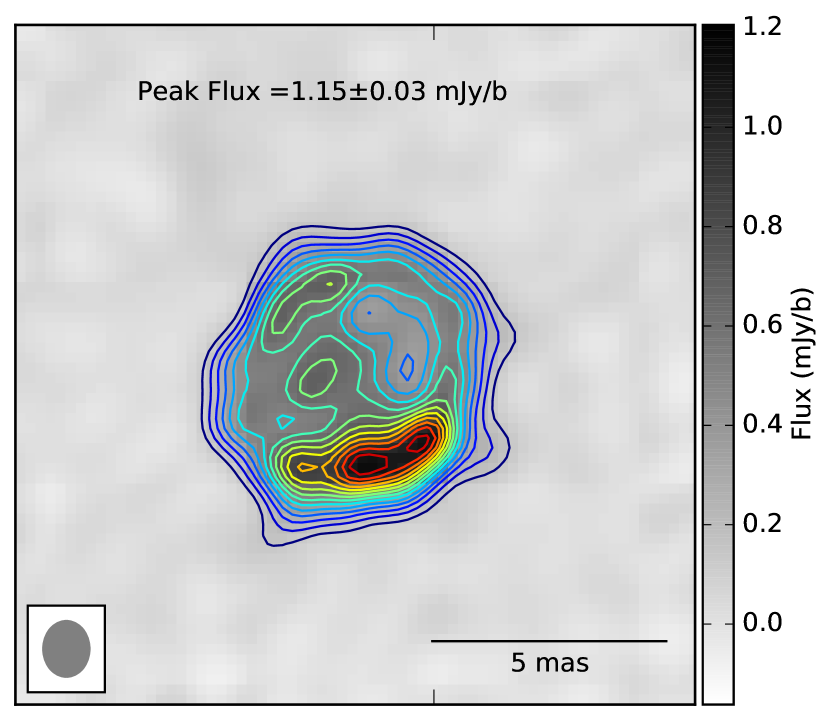
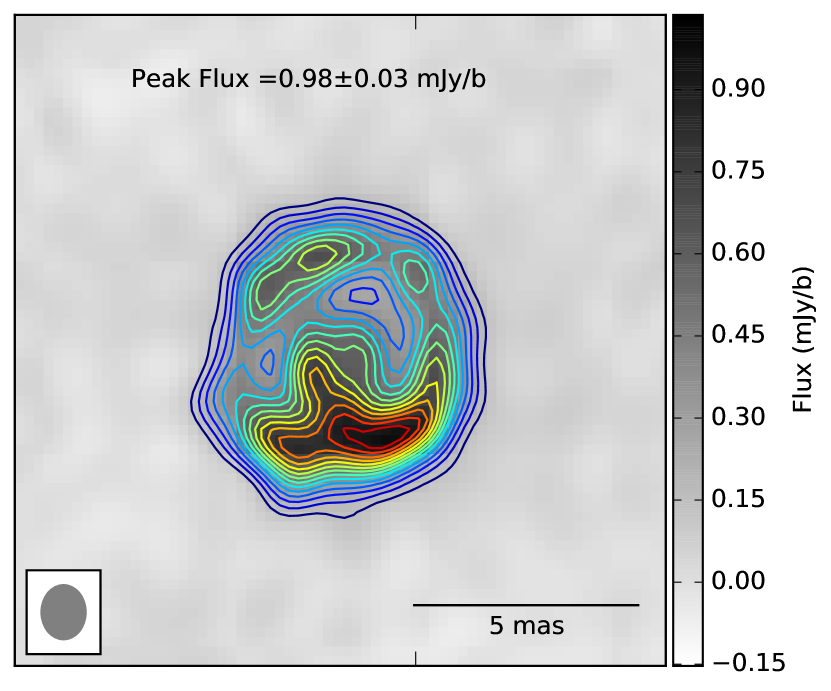
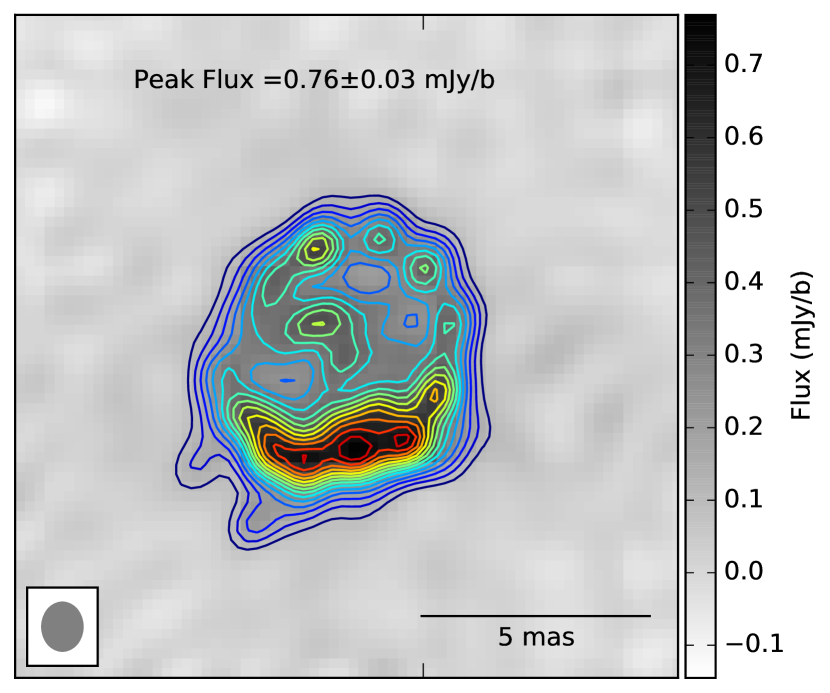
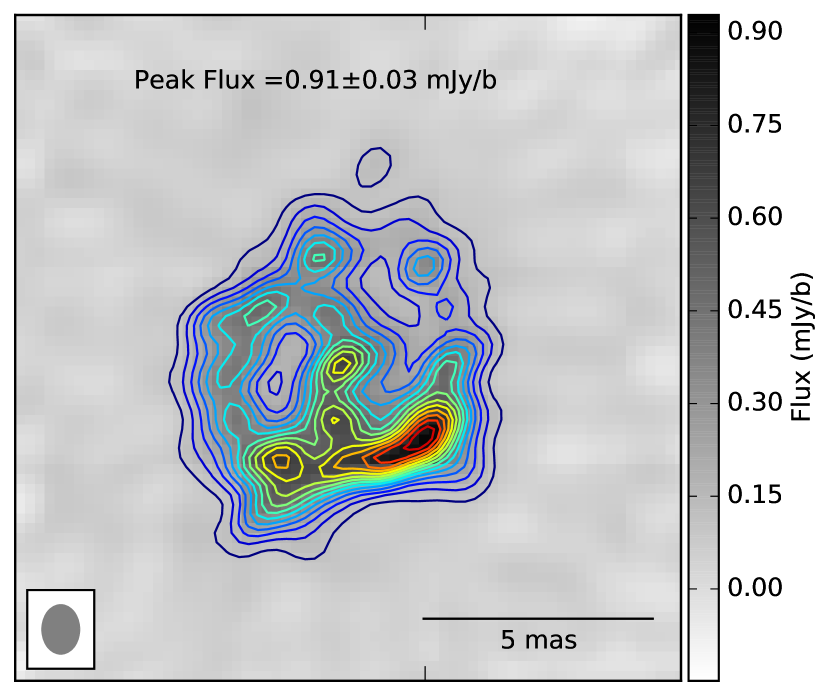
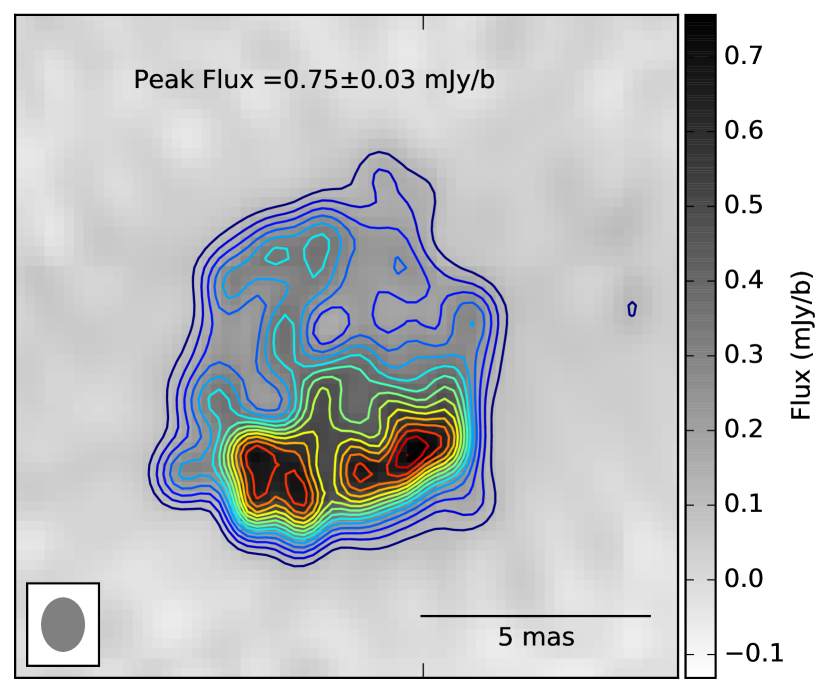
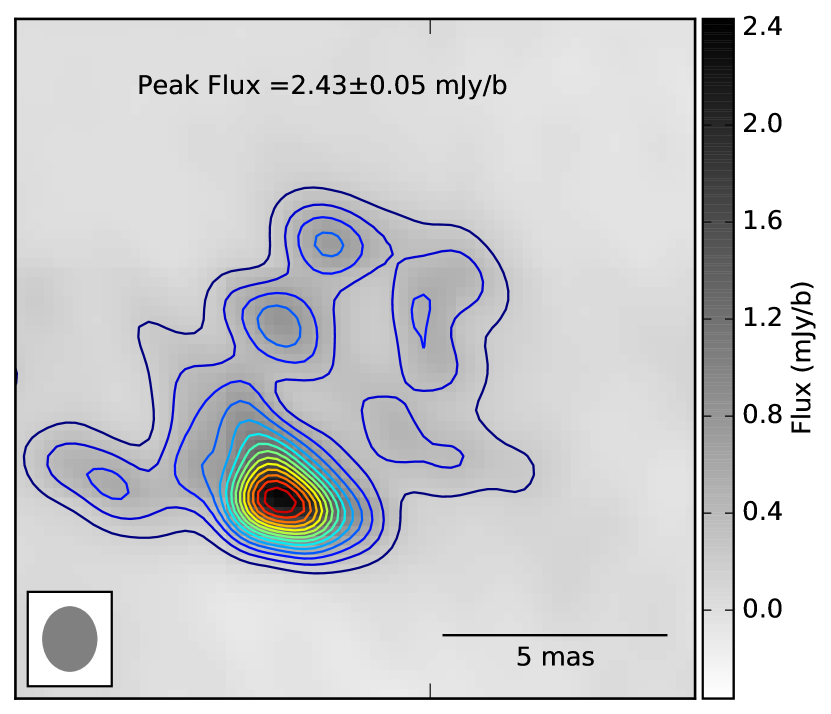
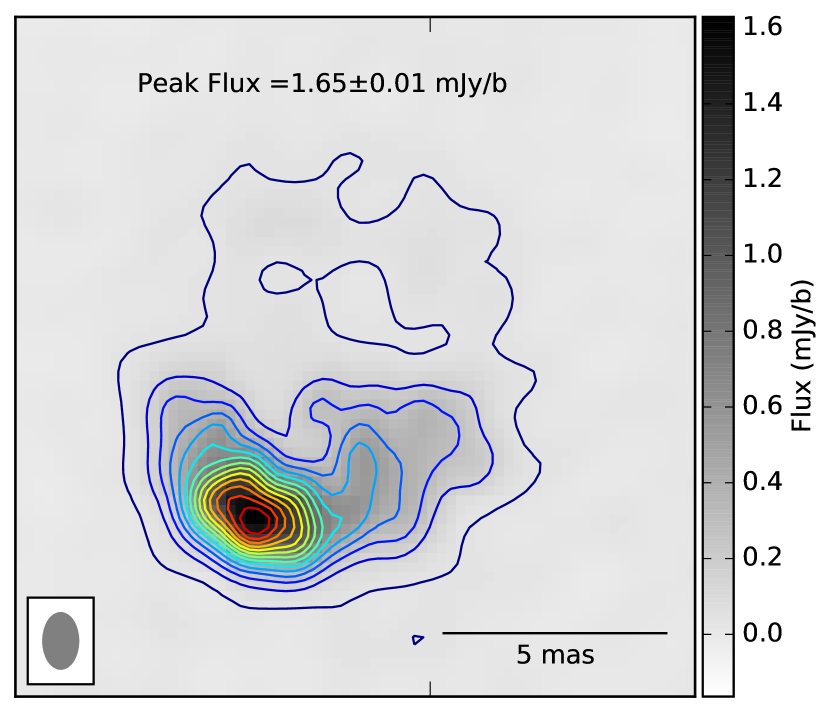
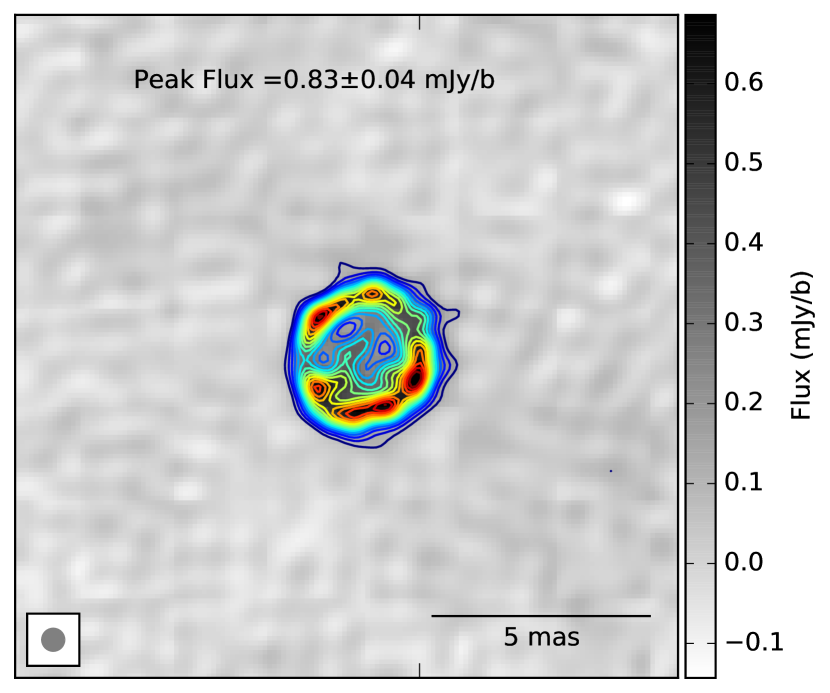
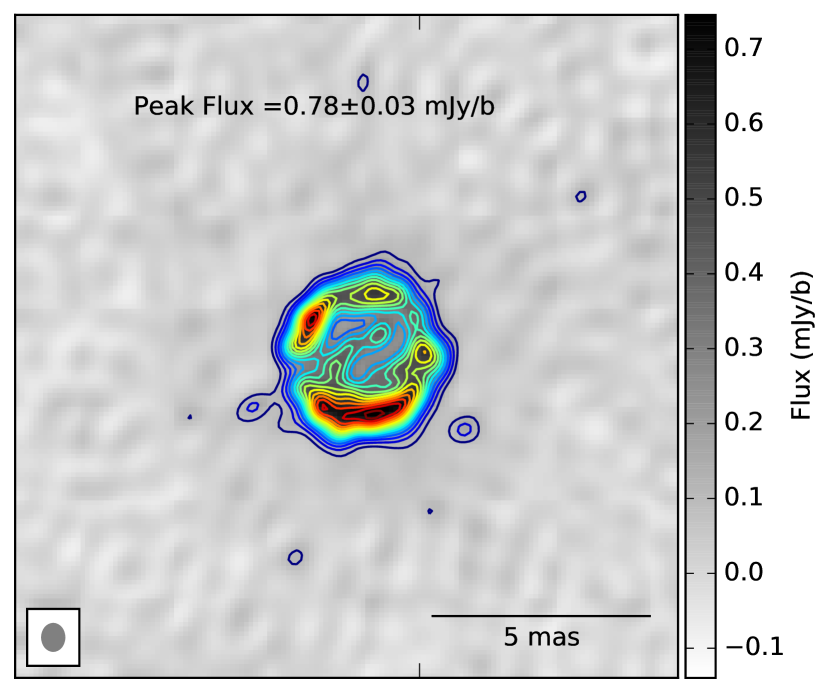
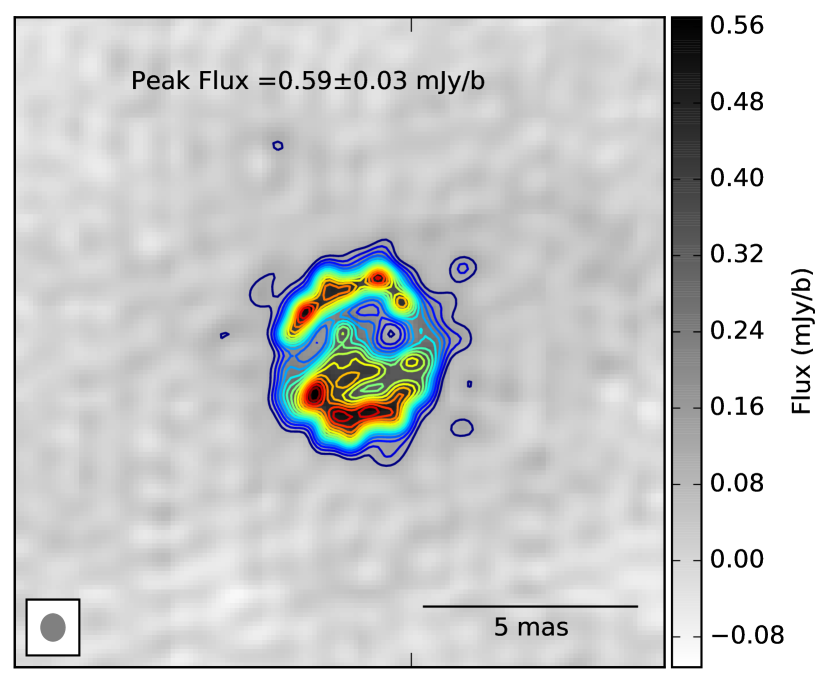
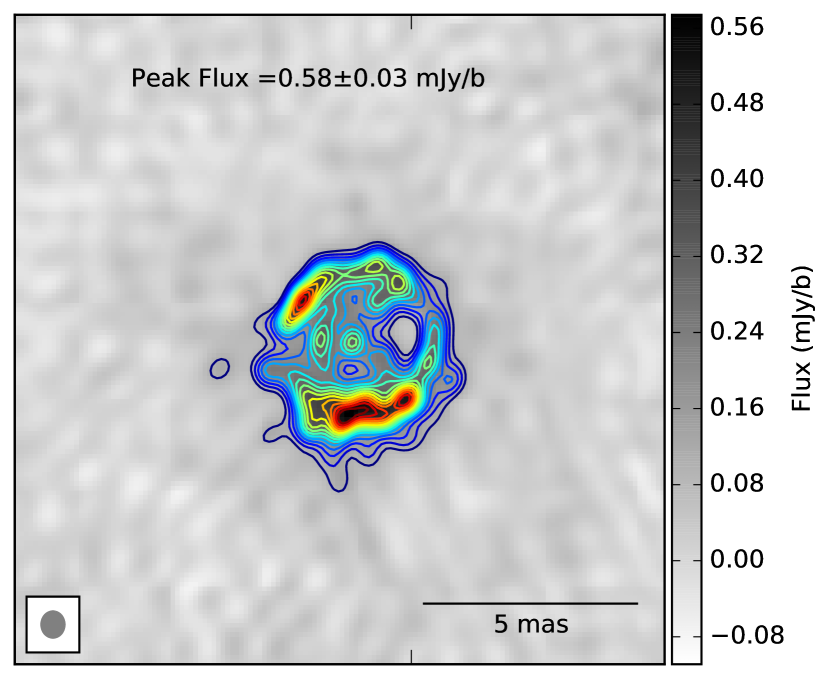
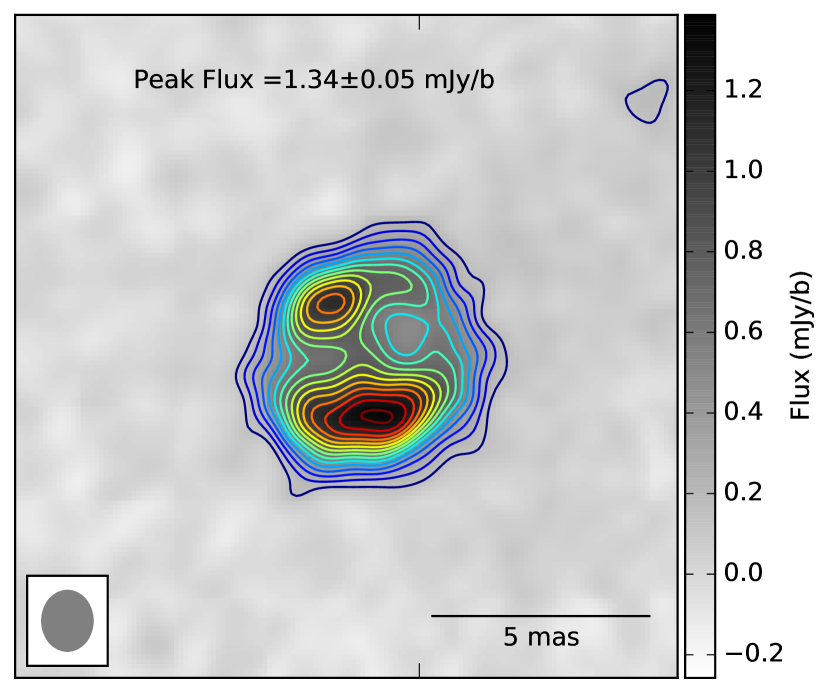
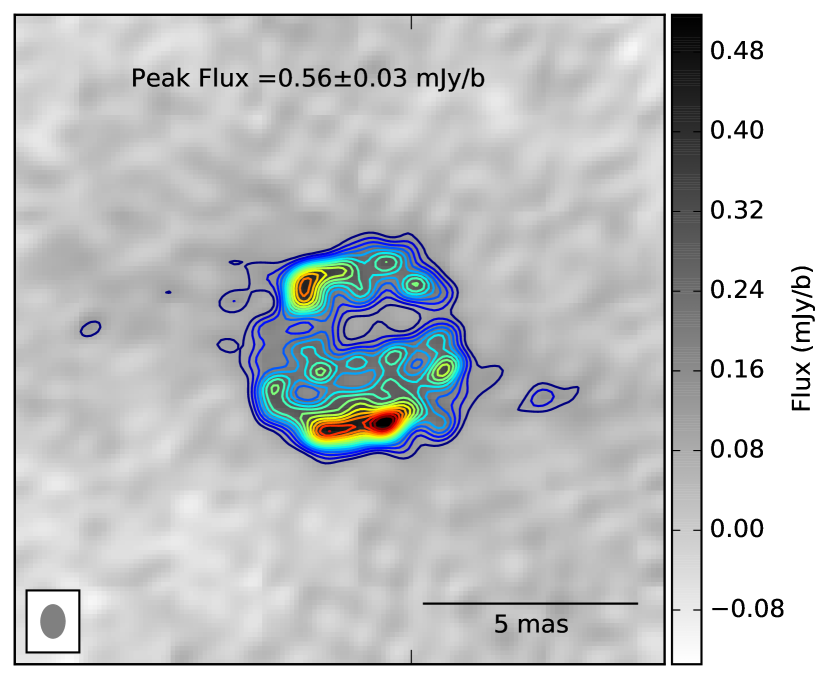
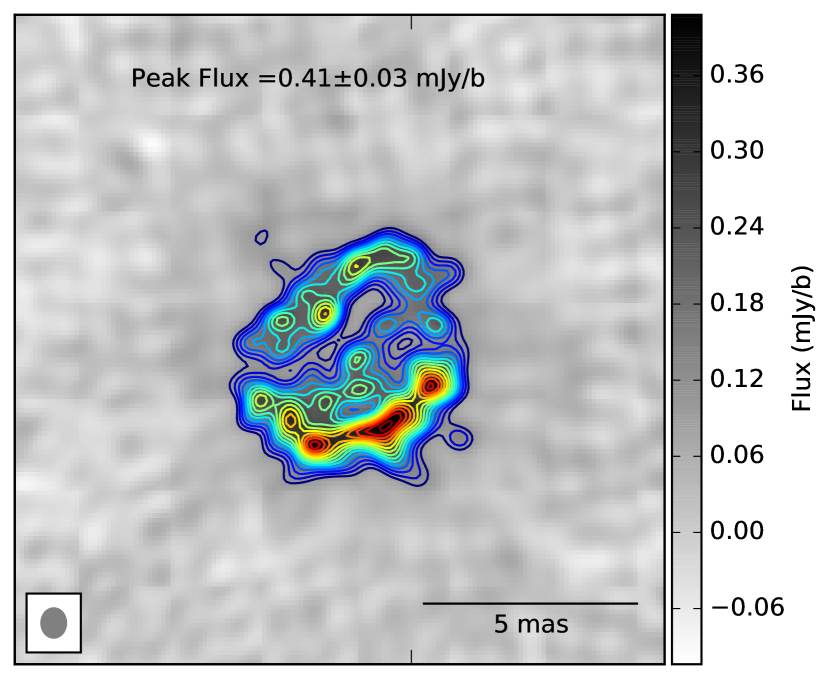
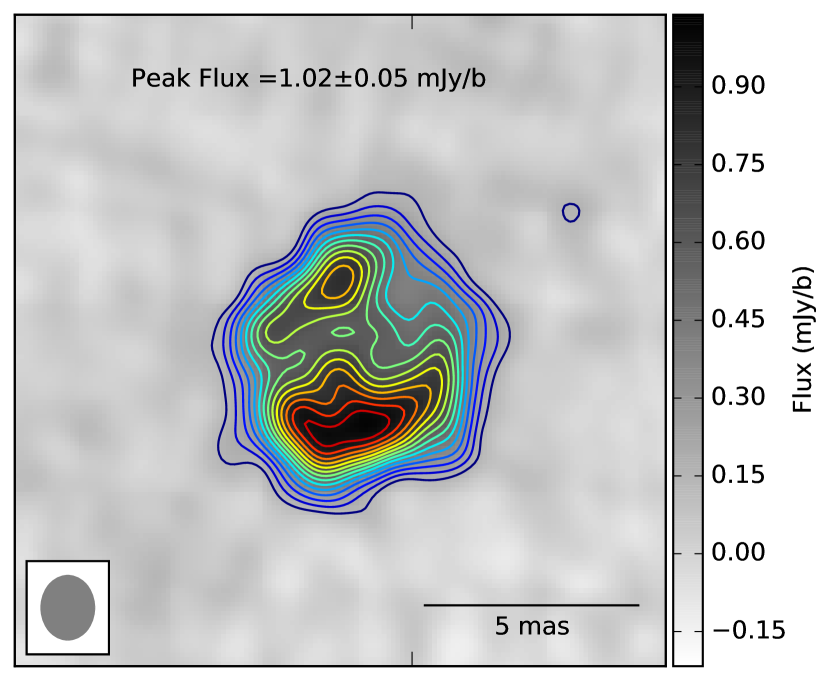
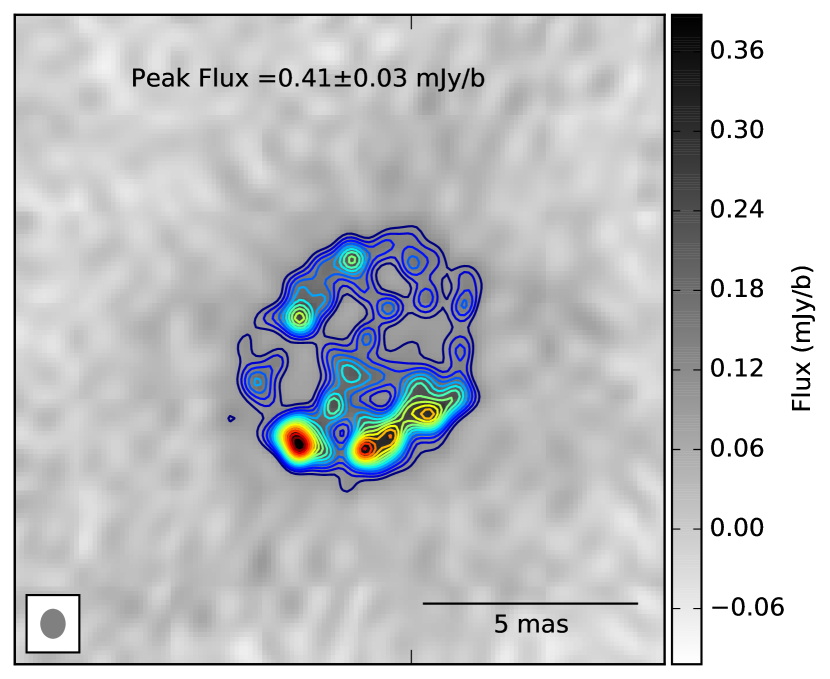
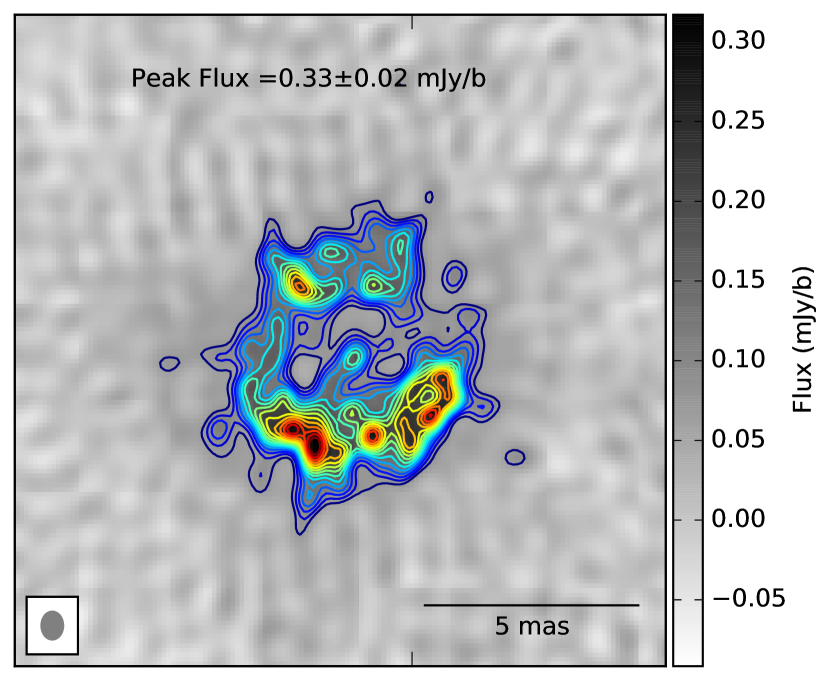
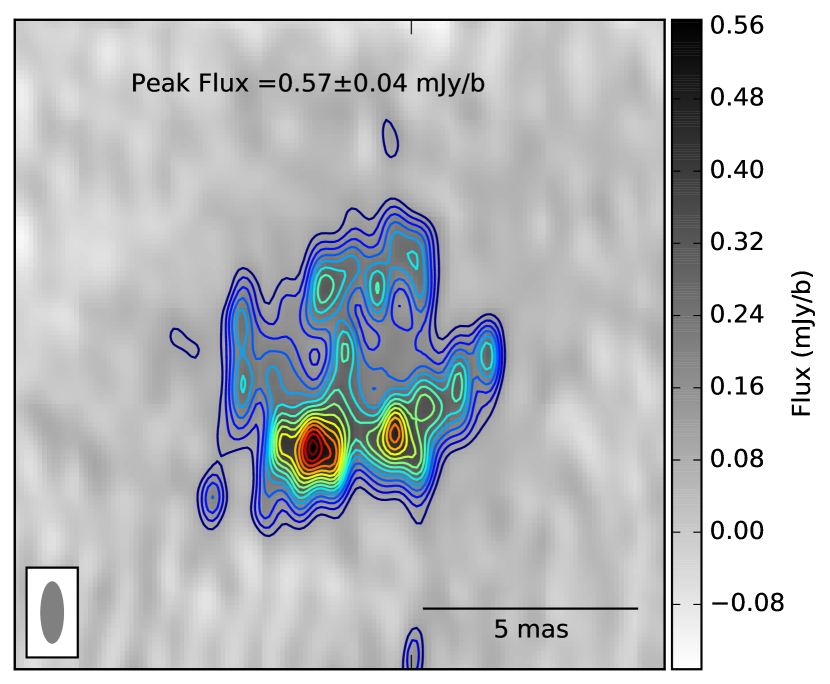
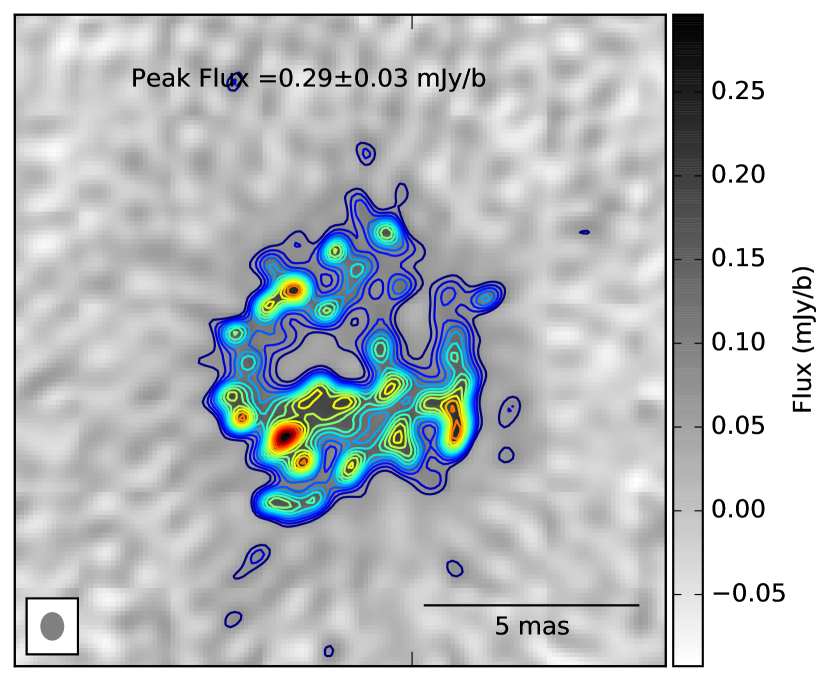
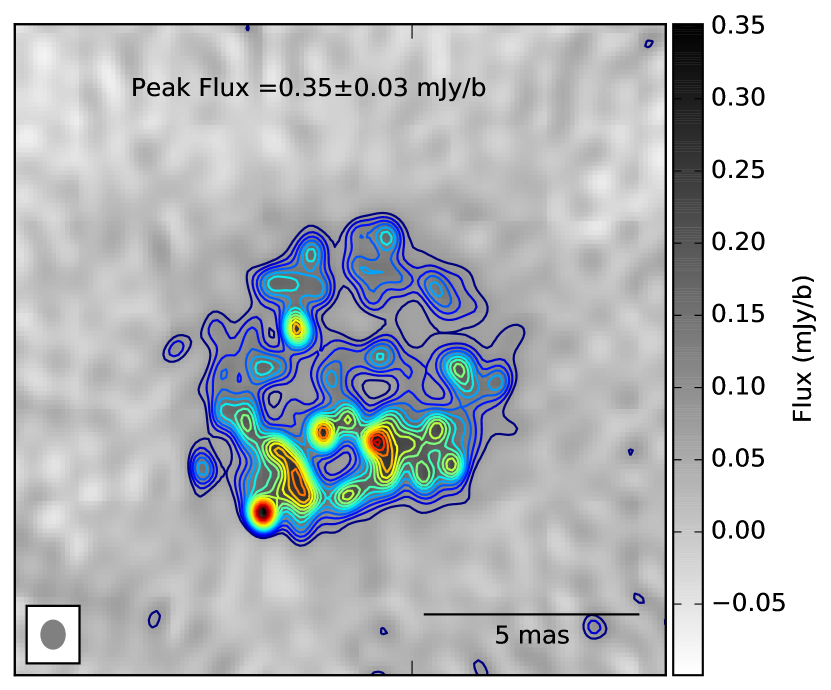
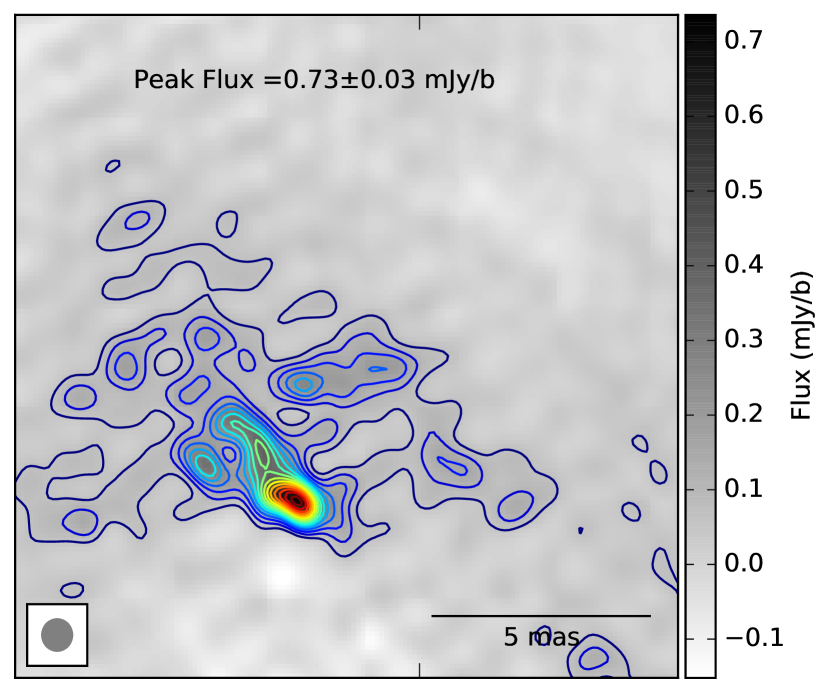
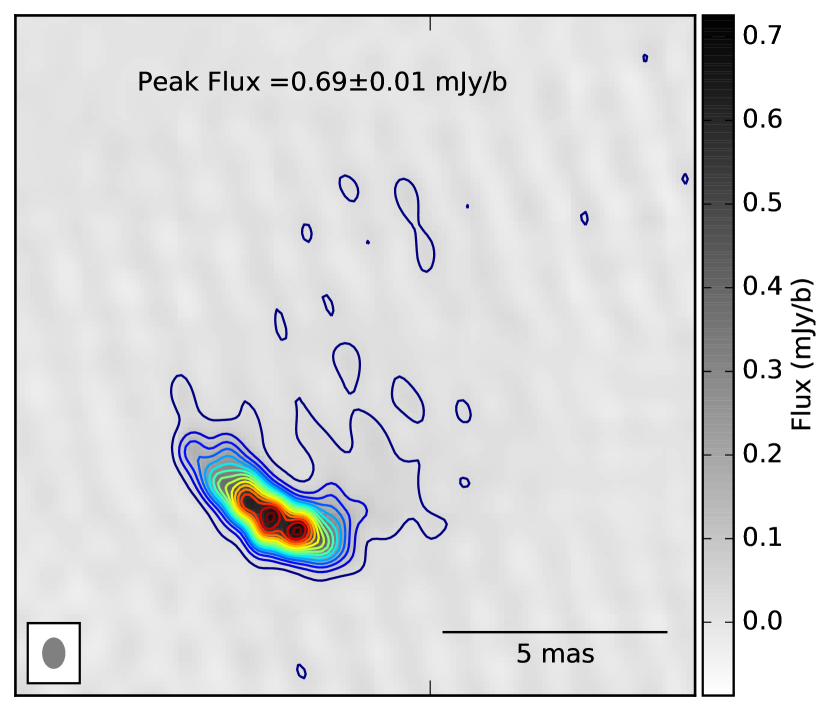
The VLBI images of SN 2008iz at 4.8 and 8.4 GHz are shown in Fig.6, and 7 respectively. All the images are phase referenced to the M 81 core, M 81*, for consistency in their alignment. The SNR is resolved at these frequencies. We use natural weighting in order to reveal more information on the larger scale structures. The size and shape of the beam used for restoring the images is determined by the set of antennas (uv-coverage) that were employed for each of the the considered data sets. For instance, the resolution of images Fig 6 e, f and Fig 7 e, h is lower because some telescopes, especially the Effelsberg 100 meter telescope, have not taken part in the observations.
The images show that the supernova expansion starts with a shell like structure that gets more and more asymmetric. Overall, we see expansion with similar velocities into all directions. During the later epochs, the emission distribution breaks up and shows substructures in the southern part of the ring. There, the ring is much brighter than in its other parts, indicating a denser surrounding medium along the southern direction.
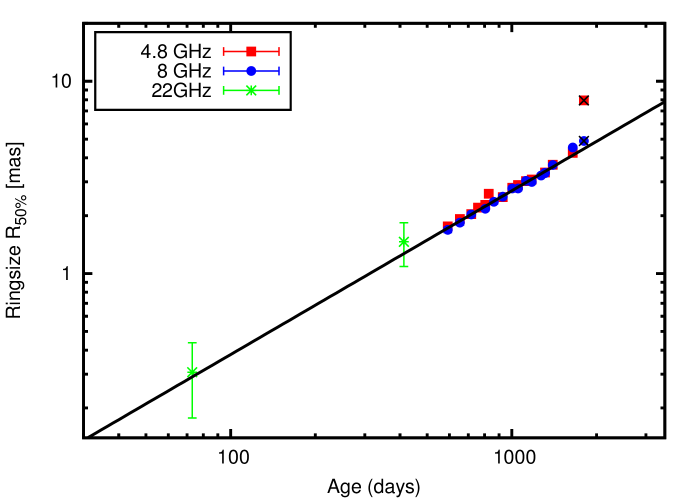
The deceleration of SN 2008iz is derived from the VLBI images convolved with a dynamic beam at 4.8 and 8.4 GHz. A dynamic beam (see Marcaide et al. 1997) scales the resolution of the later epochs to the resolution of the first epoch with respect to the size of the supernova shell size before imaging. It eliminates the systematic errors that would otherwise arise from the different resolution with which the SNR was imaged while it expands. We obtain the size of the SNR with the AIPS task ’IRING’, which was used to fit 2D Gaussians to the obtained light profiles. The centre of the SNR remains at the same position during the time span of our observations. We take the radius of the supernova ring at 50% of the peak intensity on the outside of the bright rim since this is the real ring size times an unknown factor. This method is more reliable than taking the maximum of the ring as the radius (see a more detailed description in Brunthaler et al. 2010; Beswick et al. 2006). We fit a power-law of the form
| (4) |
to the size evolution of SN 2008iz, where cy is a scaling factor, (t-t0) is the time elapsed after the explosion date and is the deceleration index. We derive values of cy=(7.50.9) 10-6 arcsec/day and =0.860.02. The errors are obtained from the post-fit covariance matrix. The size evolution and deceleration of SN 2008iz are displayed in Fig. 5. Also shown are two 22 GHz data points from Brunthaler et al. (2010) that were included in the analysis. The last two data points were excluded from the fit since we know from the light curve that there is a change in the surrounding medium of SN 2008iz at around 1400 days after the explosion that is not caused by internal processes.
| Date | Days since | Config- | S | S | S | S | S | S |
|---|---|---|---|---|---|---|---|---|
| (dd/mm/yy) | 18-2-2008 | uration | (mJy) | (mJy) | (mJy) | (mJy) | (mJy) | (mJy) |
| 2008/03/24 | 36 | C | – | – | – | 1002 | – | – |
| 2008/05/03 | 76 | C | – | – | – | 88.40.2 | – | – |
| 2009/04/08 | 416 | B | – | – | – | 9.20.2 | – | – |
| 2009/04/27 | 435 | B | 556 | 305 | 143 | 6.20.7 | – | 2.50.4 |
| 2009/07/24 | 523 | C | – | 212 | 111 | – | – | 1.00.6 |
| 2009/09/19 | 580 | B | – | 142 | 62 | 52 | 1.80.5 | |
| 2009/10/21 | 612 | D | – | – | – | 31 | – | – |
| 2010/10/20 | 976 | C | – | – | – | 2.40.3 | – | 1.10.2 |
| 2010/12/18 | 1035 | C | – | – | 10.10.9 | 2.80.3 | – | 1.70.4 |
| 2011/02/12 | 1091 | B | – | 10.20.6 | 7.70.7 | 3.50.1 | – | 0.90.2 |
| 2011/05/21 | 1189 | AB | 235 | 62 | 6.40.7 | 3.10.3 | – | 0.60.1 |
| 2011/07/30 | 1259 | A | 193 | 12.30.9 | 7.50.5 | – | – | – |
| 2011/08/01 | 1261 | A | 172 | 111 | 7.10.4 | – | – | – |
| 2011/08/09 | 1269 | A | – | – | – | 2.30.2 | – | 0.20.1 |
| 2012/02/02 | 1446 | C | – | – | – | 1.90.5 | 0.90.2 | – |
| 2012/08/25 | 1651 | B | – | 122 | 92 | 3.30.6 | 2.00.2 | – |
| 2012/11/21 | 1739 | A | – | 261 | 16.80.9 | 5.00.2 | 2.70.2 | – |
| 2014/01/23 | 2167 | AB | – | 417 | – | 6.50.6 | – | – |
| Date | Age | S1.6GHz | S1.6GHz | S4.8GHz | S8.4GHz | ||
|---|---|---|---|---|---|---|---|
| (t-t0) | (mJy) | (mJy/b) | (mJy/b) | (mJy/b) | (mas) | (mas) | |
| 2009/10/04 | 595 | 646 | 57.90.5 | 3.020.04 | 0.830.04 | 1.80.2 | 1.70.2 |
| 2009/12/04 | 656 | 554 | 50.90.4 | 2.610.03 | 0.780.03 | 1.90.2 | 1.80.1 |
| 2010/02/06 | 720 | 428 | 34.60.2 | 2.090.03 | 0.590.03 | 2.00.2 | 2.00.1 |
| 2010/03/20 | 758 | – | – | 1.80 0.03 | – | 2.30.2 | – |
| 2010/05/04 | 807 | 399 | 30.80.2 | 1.790.03 | 0.580.03 | 2.30.2 | 2.20.1 |
| 2010/05/29 | 828 | – | – | 1.710.03 | – | 2.40.2 | – |
| 2010/06/07 | 840 | 328 | 24.90.1 | – | – | – | – |
| 2010/07/02 | 866 | 358 | 26.50.2 | 4.560.05 | 1.340.05 | – | 2.40.2 |
| 2010/09/05 | 931 | 309 | 20.80.1 | 3.730.04 | 0.560.03 | 2.50.2 | 2.50.2 |
| 2010/11/19 | 1006 | 309 | 21.50.1 | 1.730.03 | 0.410.03 | 2.80.2 | 2.80.2 |
| 2011/01/07 | 1055 | 279 | 17.60.1 | 1.150.03 | 1.020.05 | 2.90.3 | 2.80.2 |
| 2011/03/18 | 1125 | 269 | 17.10.1 | 0.980.03 | 0.410.03 | 3.00.3 | 3.00.2 |
| 2011/05/12 | 1180 | 269 | 17.30.2 | 0.760.03 | 0.330.02 | 3.10.3 | 3.00.2 |
| 2011/08/14 | 1274 | 2510 | 15.20.1 | 1.550.05 | 0.570.04 | – | 3.20.2 |
| 2011/08/14 | 1274 | 249 | 15.30.1 | 3.780.04 | 1.180.04 | – | – |
| 2011/09/23 | 1314 | 252 | 12.60.1 | 0.910.03 | 0.290.03 | 3.40.3 | 3.30.2 |
| 2011/09/23 | 1314 | 219 | 12.00.1 | 3.170.07 | 0.900.03 | – | 3.30.2 |
| 2011/12/19 | 1401 | 289 | 18.70.2 | 0.750.03 | 0.350.03 | 3.70.6 | 3.70.3 |
| 2012/08/25 | 1650 | 399 | 30.30.3 | 2.430.05 | 0.730.03 | 4.30.4 | 4.50.2 |
| 2013/01/28 | 1806 | 409 | 21.20.1 | 1.650.01 | 0.690.01 | 8.00.4 | 4.90.2 |
4 Discussion
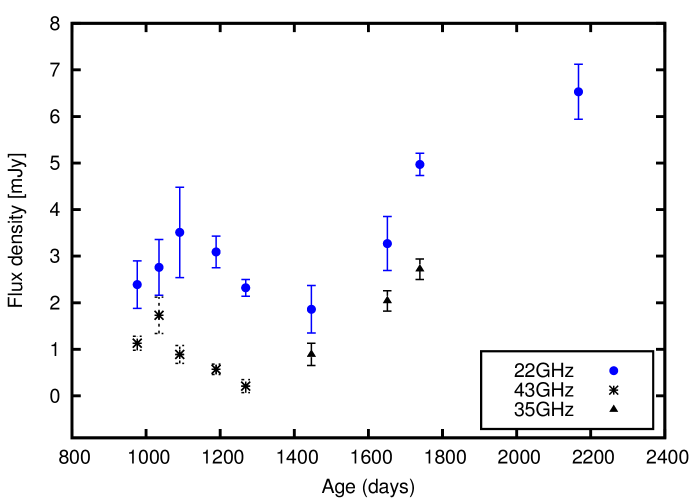
4.1 Flux-density flare from day 970
A zoom into the light curve at the higher frequencies (see Fig.8) uncovers excess emission from the supernova after t=970 days and after t=1400 days. We note that the extra emission after t=970 days is detected at 8.4, 22.3 and 43.2 GHz while the enhancement at t=1400 days is detected at 4.8, 8.4, 22 and 35 GHz. The later flare after time 1400 days is also confirmed with our densely sampled VLBI 1.6 GHz results. The extra emission increases the total flux density of the supernova by a factor of 2 at t=970 days, lasting for about 240 days. The second flare increases the total flux density by a factor of 4, without showing signs of flux decline so far, i.e., in 2014 January. This calls for a continuation of the monitoring to determine how long the second flare lasts.
The source is obviously optically-thin at all frequencies during the flares and its spectral index remains steep (see section 4.2). Weiler et al. (2002) indicate that a supernova whose radio emission preserves its spectral index while deviating from the standard model is showing evidence for a change in the conditions of the CSM that its remnant expands into. We therefore examine the changes in the density of the CSM as the explanation to the observed flares. According to Chevalier (1982), radio luminosity is related to the average CSM density ( /w) through
| (5) |
where the relativistic particle index =12, =1.080.08 and expansion index = 0.860.02. For SN 2008iz, L(/w)1.62. Consequently, for the radio emission to double its flux in the first flare, the CSM density must have increased by a factor of 1.5, while for the increase by factor of 4 in the second flare, the CSM density must have tripled. However, the VLBI images of the remnant of SN 2008iz do not show a spherically-symmetric density enhancement. This suggests that the shock wave is encountering dense inhomogeneities in the CSM.
The late flare (day 1400), may also be related to the transition of the front shock from the CSM bubble into the ISM. This would enhance the magnetic field and increase the emission at all frequencies. However, we obtain the size of the shock on day 1400 is 0.06 pc (3.6 mas), which is very small compared to the supernova remnant sizes measured by Batejat et al. (2011) of 0.4 pc in Arp 220 at the transition. Were the flare related to the transition, this indicates the presence of a very dense ISM for the pressure balance to hold at the bubble boundary of SN 2008iz. Thus we require an ISM with a density higher than the characteristic one in Arp 220 of 104cm-3 to explain the light curve of SN 2008iz at late stages, in the frame of the ISM interaction model.
4.2 Evolution of the spectral index
Figure 9 shows the best-fit radio spectral index, , for SN 2008iz from 430 days up to 2167 days. To obtain the radio spectral index we fit a simple power-law spectrum of the form () to our VLA data for all the epochs except for epoch 2009 April 27 which was best fit with a broken power-law of the form
| (6) |
as presented by Brunthaler et al. (2010). We fit this expression to our data with the S0 and are left as free parameters. For epochs with two or three frequency data points only, i.e., 2010 October 20, 2010 December 18, 2011 July 30 and 2011 August 01, a systematic error of 30% was added to the fit error to account for the low data statistics. This causes the data points for those epochs to have slightly larger error bars compared to the epochs with more frequency data points whose errors are derived directly from the post-fit covariance matrix. The observed spectral index does not show signs of evolution and remains steep, i.e. 1 throughout the period. This steepness seems to persist persist longer than in the the case of SN 1993J, whose spectral index evolution shows flattening at all frequencies beginning at an age 970 days (Alberdi & Marcaide 2005, Martí-Vidal et al. 2011b, Weiler et al. 2007)

| Date | Days since | Radius | Luminosity | Beq | Beq | Emin | Emin |
|---|---|---|---|---|---|---|---|
| (yy/mm/dd) | 18-2-2008 | (cm) | (ergs-1) | (G)k=1 | (G)k=2000 | (ergs)k=1 | (ergs)k=2000 |
| 2008/03/24 | 36 | 0.881016 | 142.61035 | 0.444 | 3.197 | 1.581046 | 0.821048 |
| 2008/05/03 | 76 | 1.671016 | 126.61035 | 0.248 | 1.784 | 3.351046 | 1.741048 |
| 2009/04/08 | 416 | 7.221016 | 13.21035 | 0.037 | 0.266 | 6.051046 | 3.141048 |
| 2009/04/27 | 435 | 7.511016 | 8.91035 | 0.032 | 0.230 | 5.081046 | 2.631048 |
| 2009/09/19 | 580 | 9.611016 | 6.51035 | 0.024 | 0.170 | 5.831046 | 3.021048 |
| 2009/10/21 | 612 | 10.071016 | 4.41035 | 0.020 | 0.146 | 4.961046 | 2.571048 |
| 2010/10/20 | 976 | 15.041016 | 3.41035 | 0.013 | 0.096 | 7.161046 | 3.711048 |
| 2010/12/18 | 1035 | 15.821016 | 4.01035 | 0.013 | 0.097 | 8.391046 | 4.351048 |
| 2011/02/12 | 1091 | 16.551016 | 5.01035 | 0.014 | 0.099 | 10.101046 | 5.231048 |
| 2011/05/21 | 1189 | 17.821016 | 4.41035 | 0.012 | 0.090 | 10.321046 | 5.351048 |
| 2011/08/09 | 1269 | 18.851016 | 3.31035 | 0.011 | 0.079 | 9.421046 | 4.881048 |
| 2012/02/02 | 1446 | 21.091016 | 2.71035 | 0.009 | 0.068 | 9.701046 | 5.031048 |
| 2012/08/25 | 1651 | 23.641016 | 4.71035 | 0.010 | 0.072 | 15.421046 | 7.991048 |
| 2012/11/21 | 1739 | 24.721016 | 7.11035 | 0.011 | 0.078 | 20.671046 | 10.711048 |
| 2014/01/23 | 2167 | 29.901016 | 9.11035 | 0.010 | 0.071 | 30.231046 | 15.661048 |
4.3 Equipartition, total minimum Energy and Magnetic field
For sources of radio synchrotron emission, energy equipartition between the particles and the magnetic field is usually postulated (Pacholczyk 1970). The total minimum energy content (Emin) and magnetic field (Beq) in SN 2008iz can be expressed as described in relations 7 and 8
| (7) |
and
| (8) |
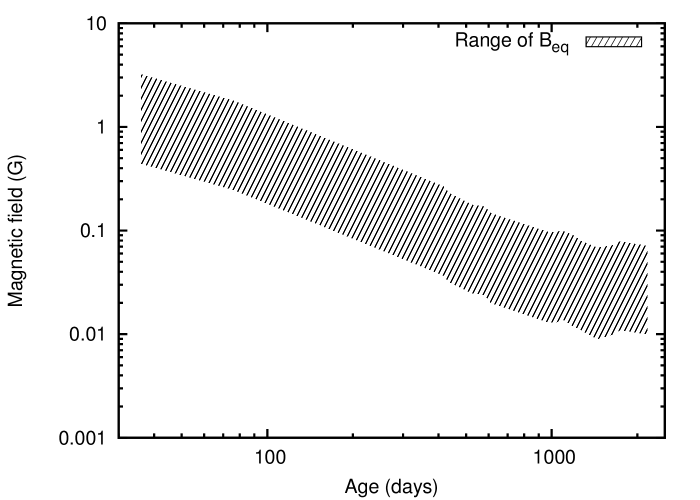
where the dimensionless parameters c12 and c13 are 9.3107 and 3.3104 respectively (Pacholczyk 1970) for spectral index, 1. The filling factor, , the ratio of the inner and outer radii of the emitting region, is estimated as 0.3 (Marchili et al. 2010). R is the source radius in derived from our VLBI data R50%, which predicts =0.860.02 and cy=(7.50.9)10-6 arcsec/day in agreement with previous derivations from Brunthaler et al. (2010) of =0.890.03. is the integrated radio luminosity in ergs-1 between the radio synchrotron cutoff frequencies =107 Hz and =1011 Hz. is the ratio between the relativistic heavy particle energy density to the relativistic electron energy density. The parameter is dependent on masses of the particles, and varies from mp/me1 to mp/me2103 (Marchili et al. 2010). With varying value of , we cannot compute a single value of total minimum energy and equipartition magnetic field, but can only give a range of possibilities (see table 3). The derived Emin values are in the range of 1046 – 1048 erg. Our results of Beq at 2008 May 3, which range between 0.25 G and 1.78 G, are comparable to the values derived byMarchili et al. (2010) at 5 GHz of 0.3 G and 2.1 G and also on 2009 April 8 between 0.04 G and 0.27 G, compared to 0.04 G and 0.31 G respectively. Figure 10 shows the magnetic field evolution as the supernova ages derived from the integrated 22.3 GHz flux densities from day 36 to 2200 after the explosion. From this figure, we notice that the magnetic fields at each epoch scale with time, showing a hint of flattening in the time day 1300. This flattening corresponds to the flux-density flare events when the shock interacts with dense CSM. However, assuming a constant value, the magnetic field generally decreases according to on the full time range.
Considering the equipartition between fields and particles, the Beq range between (37 – 266) mG on 2009 April 8 (day 416) is expected to explain the observed level of radio emission. The choice of the radius which is 7.21016 cm, allows for a comparison with other supernovae at about the same point of expansion. The energy density of the magnetic field in the remnant is postulated to be lower than the kinetic energy density (i.e., ), such that
| (9) |
Using a mass-loss of the progenitor of SN 2008iz of 3.6910-5M⊙yr-1 (Marchili et al. 2010), a standard pre-supernova wind velocity of 10 km s-1, and a standard CSM density profile of r-2, we obtain Bcsm= 0.67 mG, which is a factor of about 55 – 400 times smaller than the equipartition field. This indicates that the magnetic field inferred for SN 2008iz cannot originate solely from compression of the existing circumstellar magnetic field, which is predicted to increase the field only by a factor of 4 (Dyson & Williams 1980). Large amplification factors of the magnetic field have also been found for other radio supernova: for SN 2001gd an amplification factor in the range of 50-350 was determined (Pérez-Torres et al. 2005); the SN 1993J amplification factor of a few hundred (Fransson & Björnsson 1998; Pérez-Torres et al. 2001); for SN 1986J values in the range of 40–300 (Pérez-Torres et al. 2002); for SN 1979C in the range of 50 – 400 (Pérez-Torres et al. 2005); and between 37 and 260 for SN 2004et (Martí-Vidal et al. 2007). Thus, if equipartition between fields and particles holds, amplification mechanisms other than compression of the circumstellar magnetic field need to be invoked to explain the level of radio emission from the supernova, such as turbulent amplification due to Rayleigh-Taylor instability (Chevalier 1982; Chevalier & Blondin 1995).
5 Summary
We report on multi-frequency VLA and VLBI radio data in the optically thin regime for an on-going monitoring campaign of SN 2008iz. We fitted two models to the data, a simple power-law () and a simplified Weiler model, yielding = 1.220.07 (days 100-1500) and 1.410.02 (days 76-2167) respectively. The light curve uncovers flux density enhancements at t=970 days and t=1400 days by a factor of 2 and 4 respectively. The later flare, besides being brighter, does not show signs of decline, at least from the results examined so far (2014 January 23; day 2167). The flaring activity is attributed to increase in the number density of shocked circumstellar medium (CSM) electrons as the expanding shock wave encounters a clumpy denser medium. The late flare may also be attributed to the transition of the front shock from the CSM bubble into the interstellar medium (ISM), although a very dense ISM (104 cm-3) would be required, which is consistent with SN 2008iz being deeply buried within the center of M 82.
The 1.4 GHz flux density values fall below the supernova model fit, a phenomena confirmed by 3 LOFAR non-detection limit at 154 MHz level of 0.41 mJy/beam. The low flux values could be attributed to free-free absorption (FFA) from a dense foreground screen along the line of sight, or a low-frequency cut-off caused by Razin-Tsytovich effect.
The spectrum for SN 2008iz for the period from 430 to 2167 days after the supernova explosion shows no signs of evolution and remains steep (1). This is different from SN 1993J, whose spectral index evolution shows flattening of the spectrum at all frequencies, beginning at an age 970 days.
From the 4.8 and 8.4 GHz VLBI images, the supernova expansion is seen to start with a shell like structure, reflecting an expansion with similar velocities into all direction that gets more and more asymmetric at later stages. Finally, in later epochs the structure breaks up, with bright structures dominating the lower part of the ring, which serves as an indication of a denser surrounding medium along the southern direction. This structural evolution differs significantly from SN 1993J, which remains circularly symmetric over 4000 days after the explosion. From the size evolution of the SN 2008iz SNR derived from the 4.8 and 8.4 GHz VLBI images, a deceleration parameter, , of 0.860.02 and an expansion velocity of (12.10.2)103 km s-1 are derived for the time range between 73 and 1400 days.
From the energy equipartition between fields and particles, we estimate
the minimum total energy in relativistic particles and the magnetic
fields during the supernova expansion. On 2009 April 8, Emin3.151046 – 1.631048 erg, which corresponds to an average equipartition magnetic field of B37 – 266 mG.
We derive the average magnetic field in the circumstellar wind of
Bcsm= 0.67 mG at a radius from the center of the supernova
explosion of 7.21016 cm. Since the supernova
shock compression could only enhance the magnetic field by a factor
of 4, powerful amplification mechanisms must be at play in SN 2008iz
to account for the derived magnetic field amplification of 55 – 400
that is responsible for the synchrotron radio emission.
We wish to thank Dr. S. Mattila for the valuable and constructive comments. Naftali Kimani was supported for this research through a stipend from the International Max Planck Research School (IMPRS) for Astronomy and Astrophysics at the Universities of Bonn and Cologne. This work made use of the Swinburne University of Technology software correlator, developed as part of the Australian Major National Research Facilities Programme and operated under licence. More information on the software can for example be found in Deller et al. (2011).
References
- Alberdi & Marcaide (2005) Alberdi, A. & Marcaide, J. M. 2005, in IAU Colloq. 192: Cosmic Explosions, On the 10th Anniversary of SN1993J, 13
- Batejat et al. (2011) Batejat, F., Conway, J. E., Hurley, R., et al. 2011, ApJ, 740, 95
- Beswick et al. (2009) Beswick, R. J., Muxlow, T. W. B., Pedlar, A., et al. 2009, The Astronomer’s Telegram, 2060
- Beswick et al. (2006) Beswick, R. J., Riley, J. D., Marti-Vidal, I., et al. 2006, MNRAS, 369, 1221
- Brunthaler et al. (2010) Brunthaler, A., Martí-Vidal, I., Menten, K. M., et al. 2010, A&A, 516, A27
- Brunthaler et al. (2009a) Brunthaler, A., Menten, K. M., Reid, M. J., et al. 2009a, The Astronomer’s Telegram, 2020
- Brunthaler et al. (2009b) Brunthaler, A., Menten, K. M., Reid, M. J., et al. 2009b, A&A, 499, L17
- Chevalier & Blondin (1995) Chevalier, R. & Blondin, J. M. 1995, ApJ, 444, 312
- Chevalier (1982) Chevalier, R. A. 1982, ApJ, 258, 790
- Deller et al. (2011) Deller, A. T., Brisken, W. F., Phillips, C. J., et al. 2011, 123, 275
- Dyson & Williams (1980) Dyson, J. & Williams, D. 1980, Physics of the Interstellar Medium (Manchester: Manchester University Press)
- Fenech et al. (2008) Fenech, D. M., Muxlow, T. W. B., Beswick, R. J., Pedlar, A., & Argo, M. K. 2008, MNRAS, 391, 1384
- Fransson & Björnsson (1998) Fransson, C. & Björnsson, C.-I. 1998, ApJ, 509, 861
- Freedman et al. (1994) Freedman, W. L., Hughes, S. M., Madore, B. F., et al. 1994, ApJ, 427, 628
- Güver & Özel (2009) Güver, T. & Özel, F. 2009, MNRAS, 400, 2050
- Kronberg et al. (2000) Kronberg, P. P., Sramek, R. A., Birk, G. T., et al. 2000, ApJ, 535, 706
- Marcaide et al. (1997) Marcaide, J. M., Alberdi, A., Ros, E., et al. 1997, ApJL, 486, L31
- Marchili et al. (2010) Marchili, N., Martí-Vidal, I., Brunthaler, A., et al. 2010, A&A, 509, A47
- Martí-Vidal et al. (2007) Martí-Vidal, I., Marcaide, J. M., Alberdi, A., et al. 2007, A&A, 470, 1071
- Martí-Vidal et al. (2011a) Martí-Vidal, I., Marcaide, J. M., Alberdi, A., et al. 2011a, A&A, 526, A142
- Martí-Vidal et al. (2011b) Martí-Vidal, I., Marcaide, J. M., Alberdi, A., et al. 2011b, A&A, 526, A143
- Mattila et al. (2013) Mattila, S., Fraser, M., Smartt, S. J., et al. 2013, MNRAS, 431, 2050
- Muxlow et al. (2009) Muxlow, T. W. B., Beswick, R. J., Pedlar, A., et al. 2009, The Astronomer’s Telegram, 2073
- Muxlow et al. (1994) Muxlow, T. W. B., Pedlar, A., Wilkinson, P. N., et al. 1994, MNRAS, 266, 455
- Pacholczyk (1970) Pacholczyk, A. G. 1970, Radio astrophysics. Nonthermal processes in galactic and extragalactic sources (San Francisco: Freeman Publishers)
- Pérez-Torres et al. (2001) Pérez-Torres, M. A., Alberdi, A., & Marcaide, J. M. 2001, A&A, 374, 997
- Pérez-Torres et al. (2005) Pérez-Torres, M. A., Alberdi, A., Marcaide, J. M., et al. 2005, MNRAS, 360, 1055
- Pérez-Torres et al. (2002) Pérez-Torres, M. A., Alberdi, A., Marcaide, J. M., et al. 2002, MNRAS, 335, L23
- Pérez-Torres et al. (2014) Pérez-Torres, M. A., Lundqvist, P., Beswick, R. J., et al. 2014, ApJ, 792, 38
- van Dyk et al. (1994) van Dyk, S. D., Weiler, K. W., Sramek, R. A., Rupen, M. P., & Panagia, N. 1994, ApJ, 432, L115
- Varenius et al. (2015) Varenius, E., Conway, J. E., Martí-Vidal, I., et al. 2015, A&A, 574, A114
- Weiler et al. (2002) Weiler, K. W., Panagia, N., Montes, M. J., & Sramek, R. A. 2002, ARA&A, 40, 387
- Weiler et al. (2007) Weiler, K. W., Williams, C. L., Panagia, N., et al. 2007, ApJ, 671, 1959
- Weiß et al. (2001) Weiß, A., Neininger, N., Hüttemeister, S., & Klein, U. 2001, A&A, 365, 571